Calibration of Flowmeters
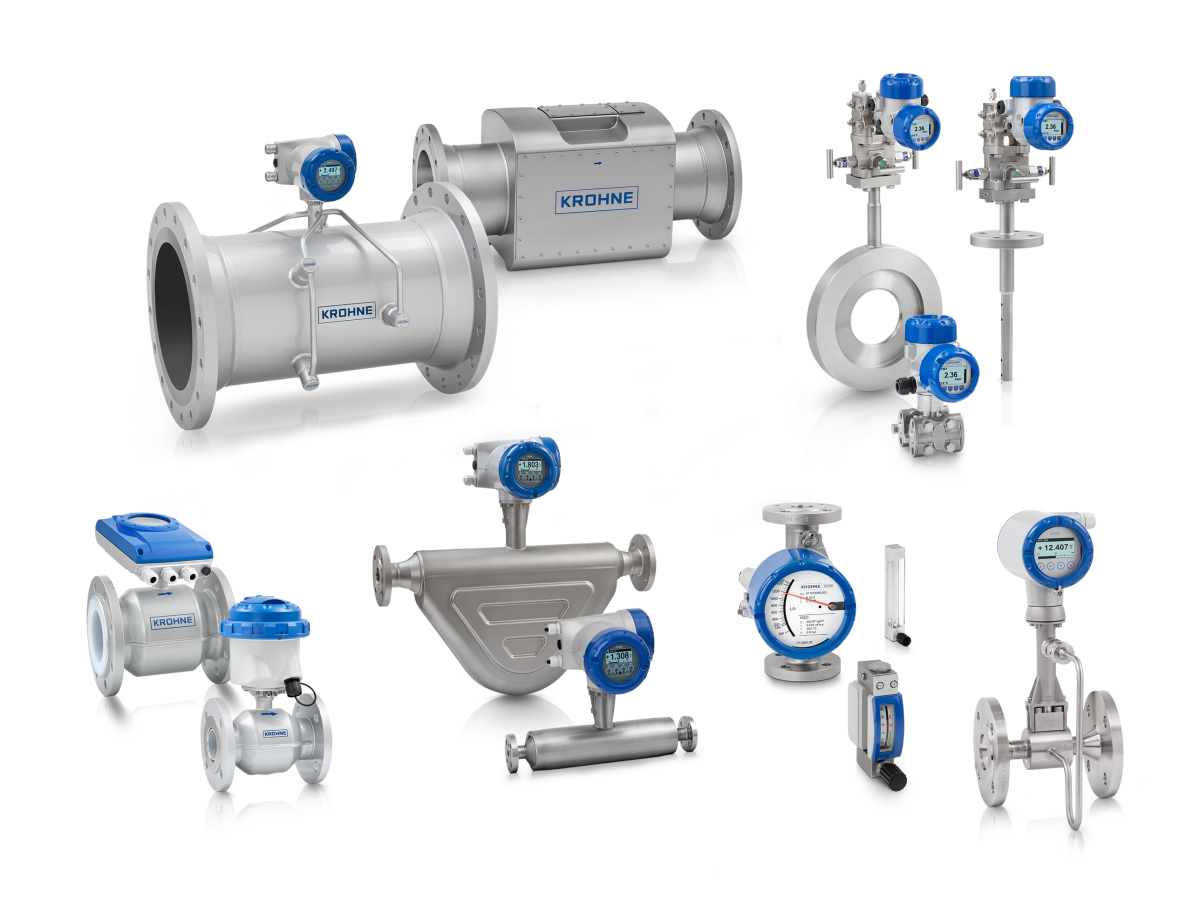
The objective of this experiment was to calibrate bulk-flow measuring devices that rely on measurements of pressure change by determining their flow coefficients as functions of the flow rate.
Supplies
The types of meters used in the experiment include venturi meters, orifice-plate meters, and paddlewheel flowmeters. Each apparatus consists of a pipe with two different flowmeters: a hydraulic one and a paddlewheel one, both mounted in a pipe as well as a weighing tank.
Procedure
The first step is making sure the discharge valve is closed followed by checking the mercury levels in the mercury-water manometer for the hydraulic flowmeter. If the levels were not equal, we would slowly open and close the two manometer drain valves to remove any trapped air in the supply lines. We then calibrated the output voltage from the validyne differential pressure transducer. We zeroed the transducer output on the interface box that is located next to the computer. With the discharge valve closed, we opened the manometer bleed valve to reduce the pressure artificially in one of the manometer lines. Five data points are generally used, from zero pressure differential to the maximum pressure differential possible with the bleed valve fully open. To acquire the data, we opened the discharge valve slowly until either the valve is fully open or the allowable manometer deflection is reached. At the maximum flow rate, we then recorded the manometer readings, the paddlewheel flowmeter readings, took the weight-time measurement, and recorded the time-averaged pressure-transducer voltages. We repeated the process at successively slower flow rates until 10 data sets were acquired.
Linearly Scaling the Flow Rate As a Function of the Manometer Deflection
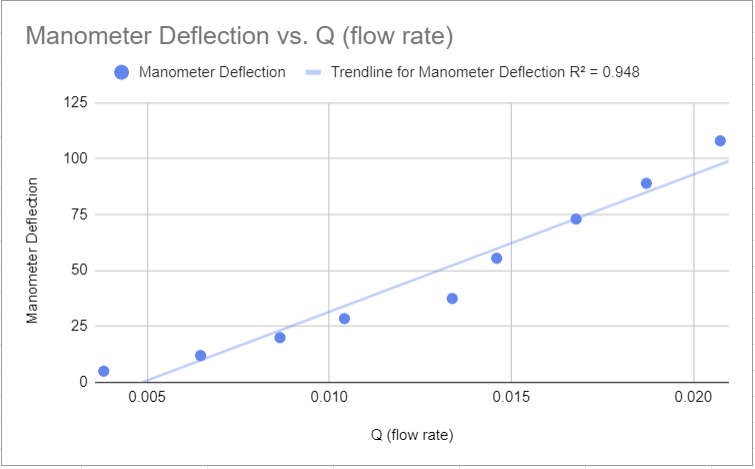
This plot includes the data points for measured flow rate Q as a function of the manometer deflection. Linear scales are used.
Logarithmically Scaling the Flow Rate As a Function of the Manometer Deflection
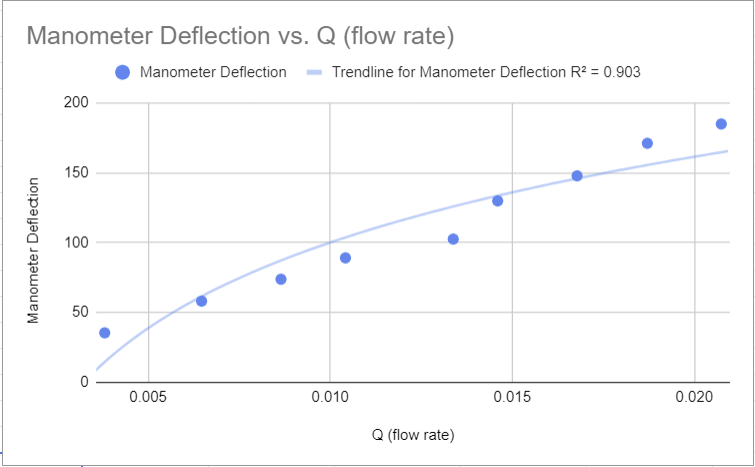
This plot also includes the data points for measured flow rate Q as a function of the manometer deflection. However, logarithmic scales are used instead. When analyzing the data and questioning whether it appears to fall along a straight line to potentially indicate that a power-law relation applies, we see that the points do not follow a straight line. There is a clear exponential curve that runs amongst the points, indicating that a power-law relation does not apply here.
Plotting the Discharge Coefficient As a Function of the Reynolds Number on Linear-log Scales
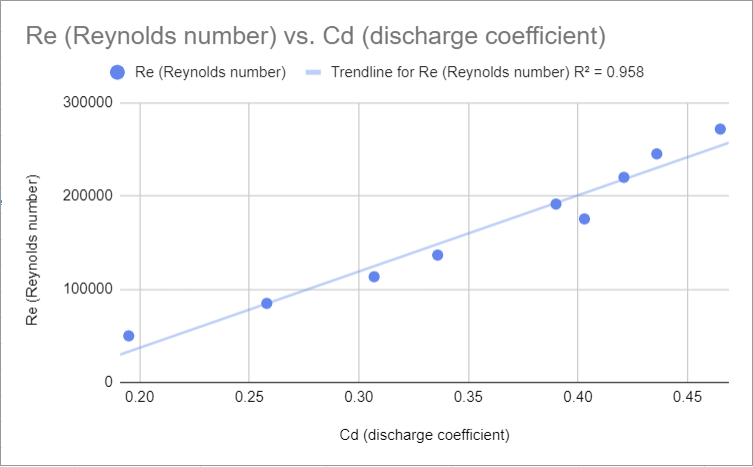
The plot was obtained using values from the calibration curve.
Calibration Curve for the Paddlewheel Flowmeter Showing the Voltage Output Versus the Actual Discharge Rate
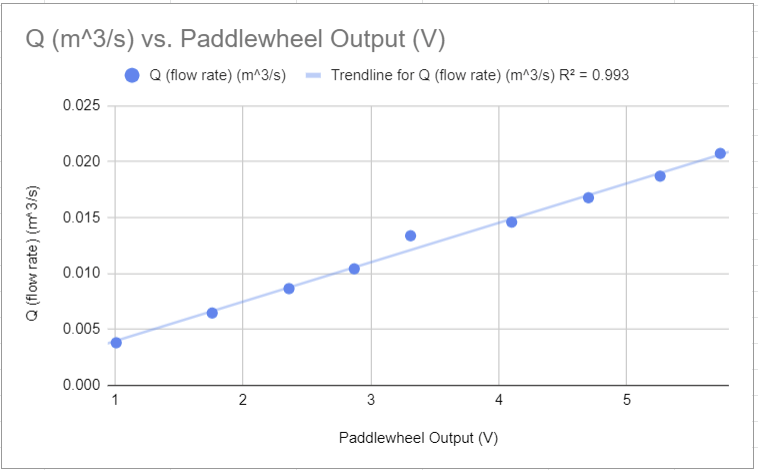
The plot was obtained using weight-time measurements.
Questioning the Discharge Coefficient
Let's take a series of questions we can now ask ourselves now that we have obtained all the data for the discharge coefficient:
- Is the discharge coefficient essentially constant over the range of Reynolds numbers tested?
- Are the experimentally measured values for the discharge coefficient close to the ideal value of unity derived theoretically?
- What corrections might need to be made to the theory to obtain more realistic values for the discharge coefficient?
First and foremost, the discharge coefficient is not constant over the range of Reynolds numbers tested. Every plot we created as well as the data tables themselves show otherwise. As the Reynolds numbers increased, so did the discharge coefficients in every scenario. All saw an increase, whether it was linear, exponential, or logarithmic, indicating that the discharge coefficient most definitely did not stay constant over the range of Reynolds numbers tested.
When comparing the ideal value of unity derived theoretically to the experimentally measured values for the discharge coefficient, we see a plethora of similarities. Simply eyeballing the data may not give you the answer upfront, but after plotting both the experimentally measured values and the theoretically derived values and comparing the graphs, we saw a great deal of resemblance. This indicates that the experimentally measured values are indeed close to the theoretically derived ideal value of unity.
The values for the discharge coefficient came out to be relatively realistic. However, if there was a correction to be made to achieve more flawless and accurate values for the discharge coefficient, it would be a simple yet effective one: more trials. There would be less discrepancies between the values and the outputs would result in smoother approximations, especially when plotting the values.
Questioning the Reliability of the Paddlewheel Flowmeter
Simply put, paddlewheel flowmeters can measure high flow rates with low pressure loss. Their accuracy when compared to other flowmeters is unmatched, have superior flow rates, can measure flow in either direction, and are even compatible with a wide range of pipe sizes without being restricted to certain ones. Not only are they convenient and cost effective but have a remarkable reputation for having extremely reliable performance. We saw this firsthand when we put the paddlewheel flowmeter to the test in this experiment.
Generally speaking, the lower the flow rate the more accurate the readings. We did see a slightly smaller number of discrepancies when the flow rate values were on the lower end, so this confirmed this theory. However, the discrepancies between values in general was never large, whether the flow rate hovered around 1 or went up to 5 or even as close as 6. As mentioned before, one of the biggest advantages of the paddlewheel flowmeter is that it can measure flow in either direction and maintains pinpoint accuracy in almost all conditions of flow. This allowed us to consistently obtain accurate results for the paddlewheel output at both high and low flow rates.