Calibration of a Flowmeter
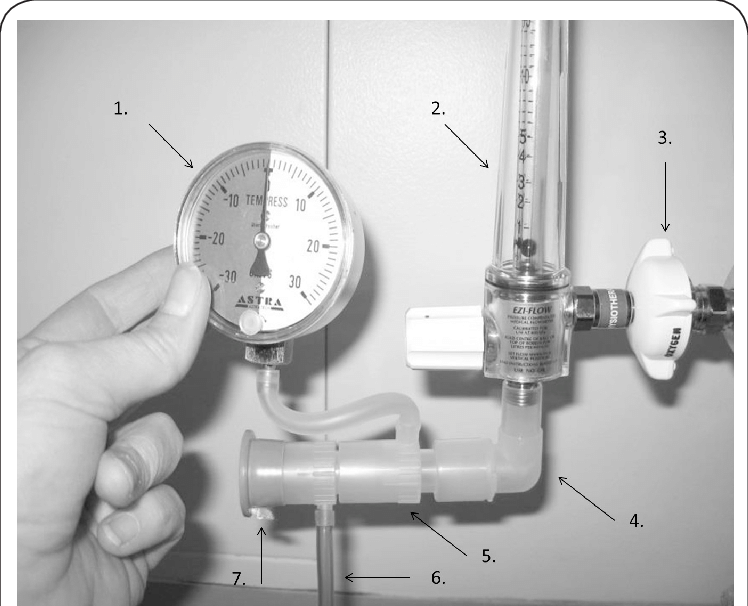
Hi! Welcome to the team - we are so excited to have you here. In this workshop, we will learn how to calibrate bulk-flow measuring devices such as venturi meters, orifice plate meters and paddlewheel flowmeters that rely on measuring pressure change by determining their flow coefficients as functions of the flow rate in terms of the Reynold number.Calibrating flowmeters is an extremely critical task for the analysis of fluid systems, so make sure to follow along and reach out if you have any questions.
Supplies
- Large scale with watertight container
- Paddlewheel type flowmeter
- Hydraulic flow meter setup, consisting of a pipe with an orifice, and a manometer.
- Steady source of flowing water, on which valves, and the flowmeters can be installed. Stopwatch
Calibrating the Flowmeter
- Begin by checking that the discharge valve is properly sealed. This procedure must be done statically, with no system flow.
- Check that the two mercury columns in the manometer are equivalent.
- The transducer output VFn interface box should be set to zero.
- Activate the manometer bleed valve. The label reads 'CAL VALVE.' In the LabVIEW program, record the transducer output and manometer level values. If the maximum output voltage exceeds 10V, the values will become erroneous.
Note Taking and Collecting Data
- Using the Gain Adjust control, ensure that the paddlewheel flowmeter has 6.25 turns for P1 and P4 and 3.00 turns for P3.
- Start by opening the discharge valve. Take your time and be careful.
- As soon as a significant nonzero value arises, observe and record the voltage readings.
- Once the maximum flow rate is attained, record the manometer and paddlewheel flowmeter values, a weight-time measurement, and the time-average pressure-transducer voltages using the LabVIEW program.
- Repeat the operation at 90% of the maximum flow rate. Continue to reduce the flow rate by 10% at a time until it is barely 10% of its original rate. Continue using the same data until the set of all 10 points is finished.
Understanding the Results
Congratulations! This brings the experimental approach for calibrating flowmeters to a close. The data must be captured in LabView and can be tabulated and displayed to improve the visualization of the results. The photos and steps that follow are highlights of the relationships discovered during the experiment.
Plot of Flow Rate Vs Manometer Deflection on a Linear Scale
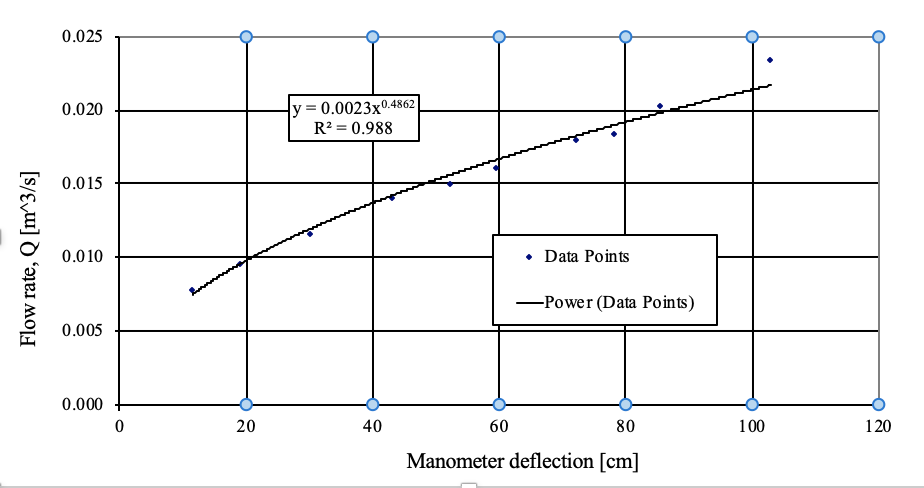
The flow rate Q as a function of the manometer deflection should look like a graph with a linear scale.
Plot of Flow Rate Vs Manometer Deflection on a Logarithmic Scale
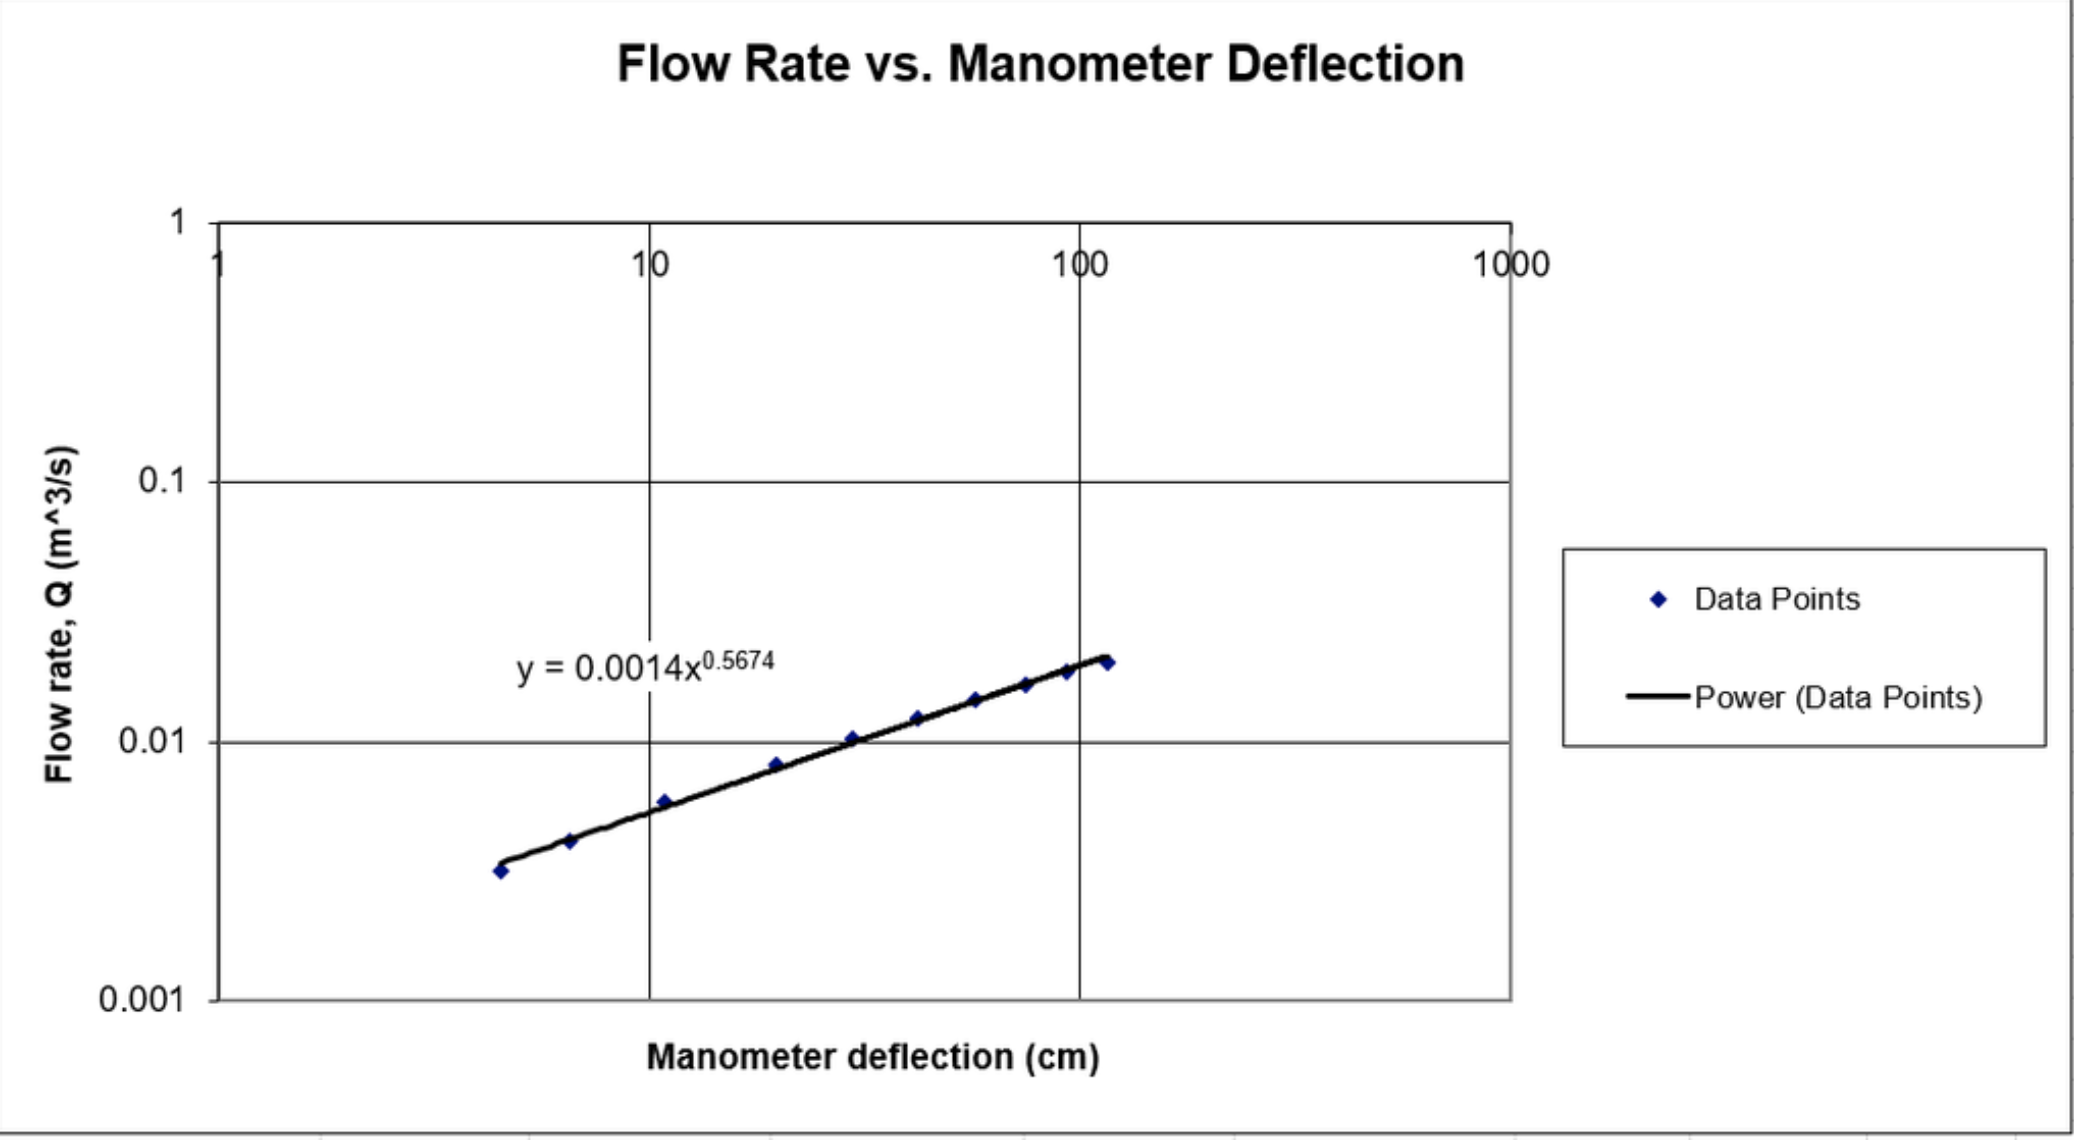
The flow rate Q as a function of the manometer deflection should look a graph with a logarithmic scale.
The curve does appear to fall along a straight line thus indicating a power-law relation of the
𝑄= 𝑘(𝛥h)^𝑚 type.
Plot of Discharge Coefficient Vs Reynolds Number
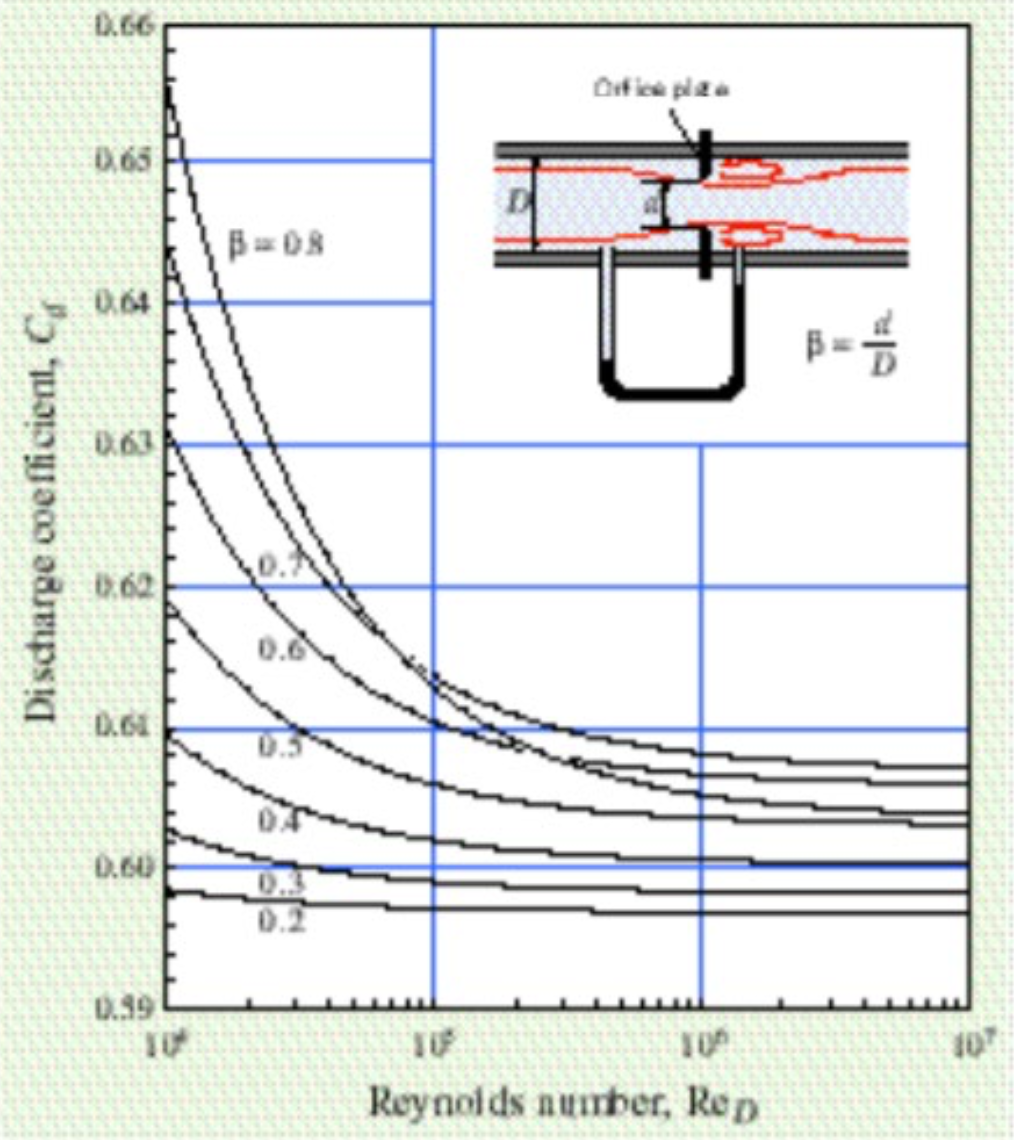
The following equation may be used to calculate Reynold's number:
ReD = V1D/v
where V1 is the velocity, D is the pipe diameter, and v is the viscosity The graphic shows that when Reynold's number grows, the discharge coefficient drops exponentially. According to this equation, the discharge coefficient is smaller for slower flowing fluids. This should be true since greater viscosity fluids should travel slower overall.
Plot of Flow Rate Vs Paddlewheel Voltage
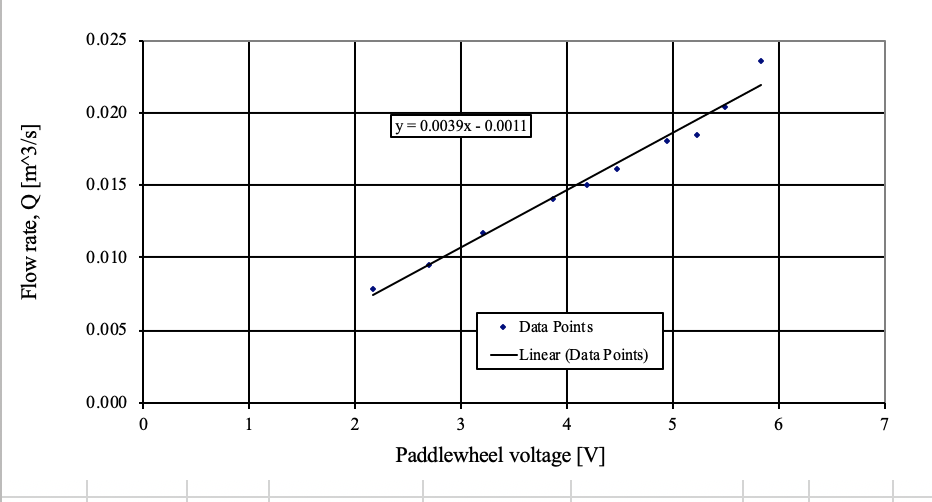
The graphic clearly shows a linear relationship between the flow rate and the paddlewheel voltage. As the flow rises, the paddlewheel rotates faster and generates more voltage. There are no data points on the plot that show a time when the paddlewheel is stationary. The highest velocity seen at the paddlewheel may be calculated by dividing the maximum flow rate by the area of the pipe it was travelling through.
Discussion of the Discharge Coefficient and Accuracy of the Paddlewheel
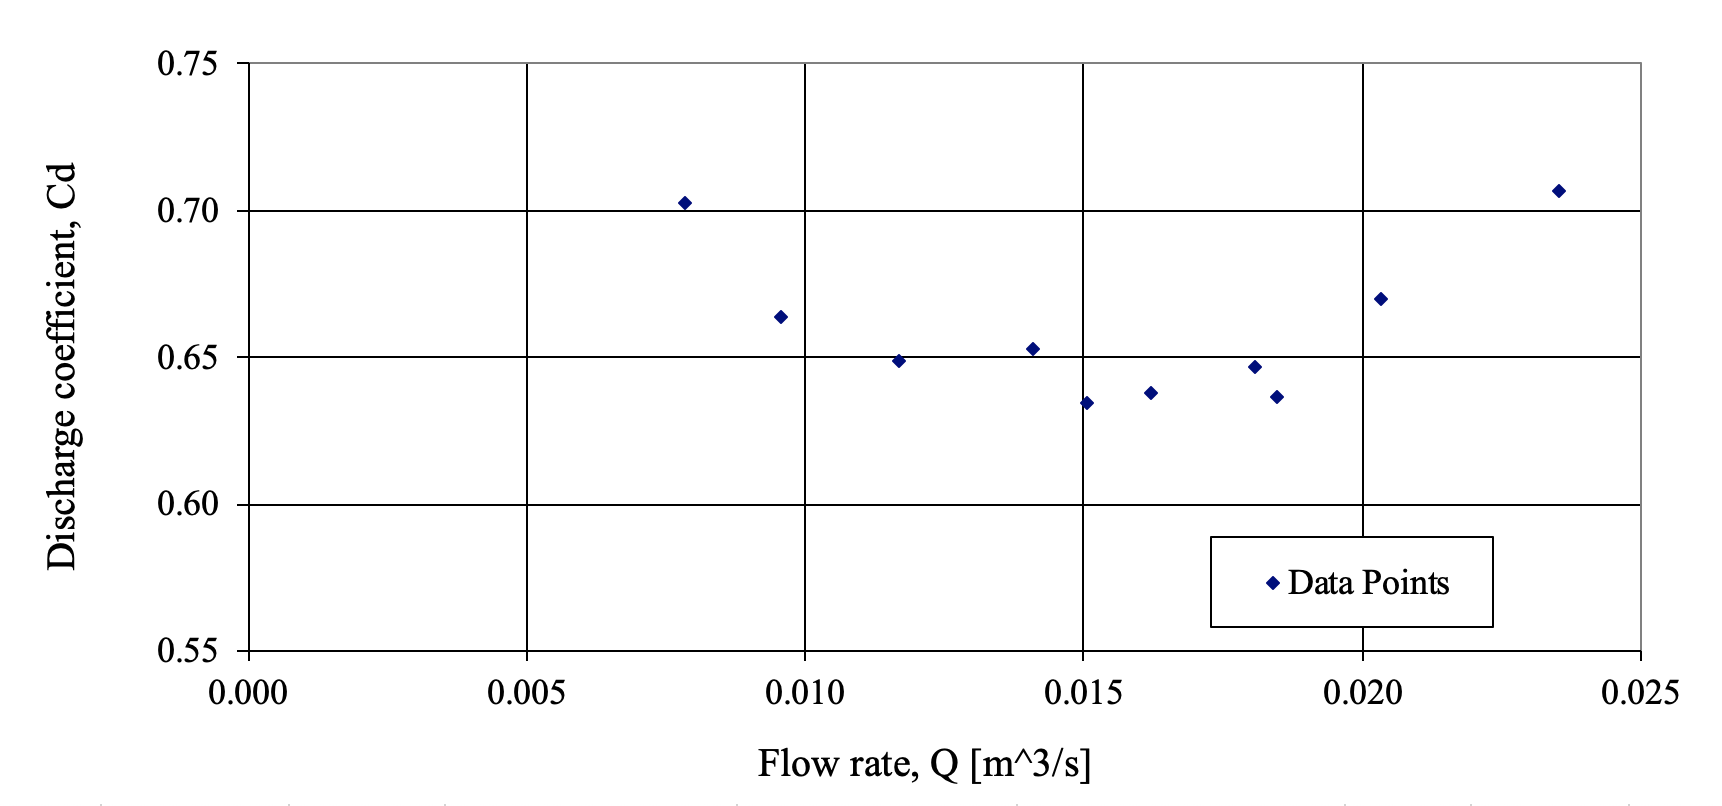
The figure clearly shows that Cd was not consistent throughout the experiments. The discharge coefficient did not even reach the unity of Cd = 1 assumption. This inaccuracy might have happened as a result of the flowmeters' physical presence in the flow. The friction created by hydraulic flowmeters, as well as the swirls created by orifice-plate flowmeters, would disrupt the flow as well as the Cd readings. The ideal circumstances for the unity assumption to arise do not account for what occurs in actuality.
It also appears that the paddlewheel was somewhat off. As previously stated, all Cd values were not constant and were not near to unity. Higher flow rates appear to have provided more consistent findings as well as higher total Cd levels. This makes sense because the paddlewheel's motion is more uneven at lower flow rates.