Calibration of a Flowmeter Partial Report
by nrohla2 in Workshop > Science
53 Views, 1 Favorites, 0 Comments
Calibration of a Flowmeter Partial Report
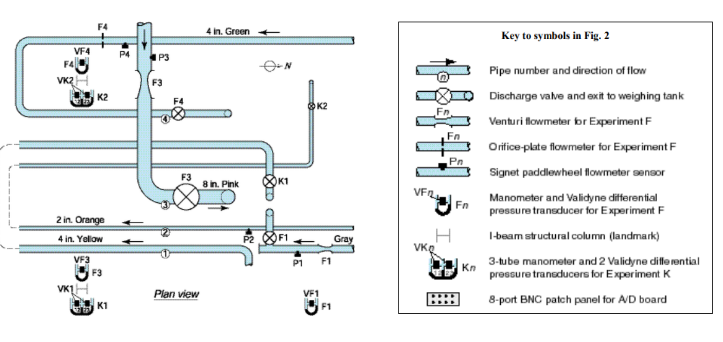
Welcome to our company. I am sorry that I will not be able to train you in person on calibrating our flowmeters, but this guide should be sufficient to get you going in the right direction.
Objective
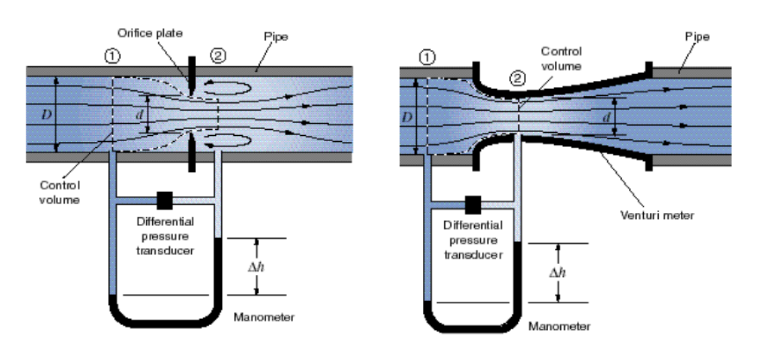
The objective of this experiment is to show how we calibrate bulk-flow sensors such as the Venturi meter, orifice-plate meter, and the paddlewheel flowmeter. We will determine their flow coefficients as functions of the flow rate in terms of the Reynolds number. These experimentally obtained coefficients will then need to be compared with the ISO published values.
Setup and Procedure
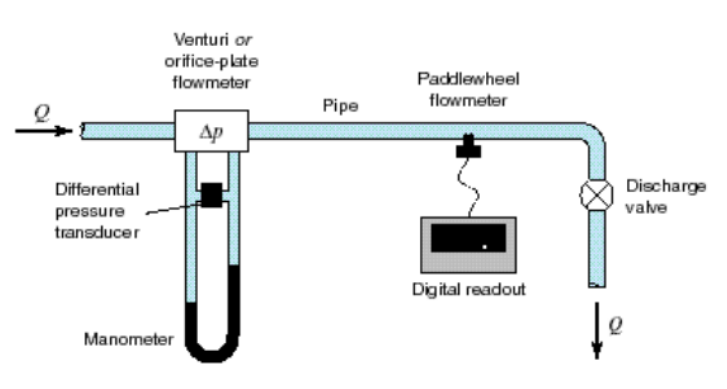
Shown above is our setup for our experiment. The first thing we need to do is calibrate our pressure transducer, which gives a voltage reading when pressure is applied to it. First, check to make sure the discharge valve is closed, then check to make sure the levels of mercury in the mercury-water manometer to make sure they are equal. If not, slowly open and close the drain valves labeled "CAL VALVE" to get rid of any trapped air.
Next, we need to zero the transducer output on the VFn interface box next to the computer. Now we want to open the manometer bleed valve labeled "CAL VALVE" to reduce the pressure in one of the manometer lines so that the pressure transducer has a voltage reading. We the CAL VALVE at 5 different positions, measure the manometer readings on the left and right side while also noting the voltage output on the VFn box. Your transducer readings should not exceed 10V. We will use this data later to create a relationship between the manometer height difference and the differential pressure transducer's voltage reading. This way we do not have to read the manometer every time we take a data point.
Next, we will acquire data using both the hydraulic flowmeter and the Signet paddlewheel flowmeter simultaneously. Use the Gain Adjust control to make sure the paddlewheel flowmeter has 6.25 turns for both P1 and P4 and 3.00 turns for P3. Then, use the Zero Adjust control to zero the paddlewheel flowmeter output. Now we want to slowly open the discharge valve until it is fully open. During this time we want to note our measurements of the pressure transducer, the paddlewheel flowmeter, and take a weight-time measurement at the constant flowrate. Then, decrease the flowrate by closing the discharge valve a little bit and taking another point of measurements. Repeat this at least 10 times and make sure that the total manometer deflections deltaH are approximately (0.9)^2 * deltaH, (0.8)^2 * deltaH, (0.7)^2 * deltaH, . . . , (0.1)^2 * deltaH. This way the flowrates are roughly 90%, 80%, . . . , 10% of the max flowrate.
Analysis of the Transducer Data
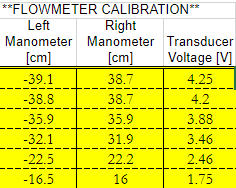
Above is the data that my group was able to collect regarding the manometer and the differential pressure transducer. Plugging that into the given excel sheet, we are given an equation that relates transducer voltage to the difference in manometer height, deltaH.
Analysis of Weight-time Measurements Along With Transducer and Paddlewheel Data

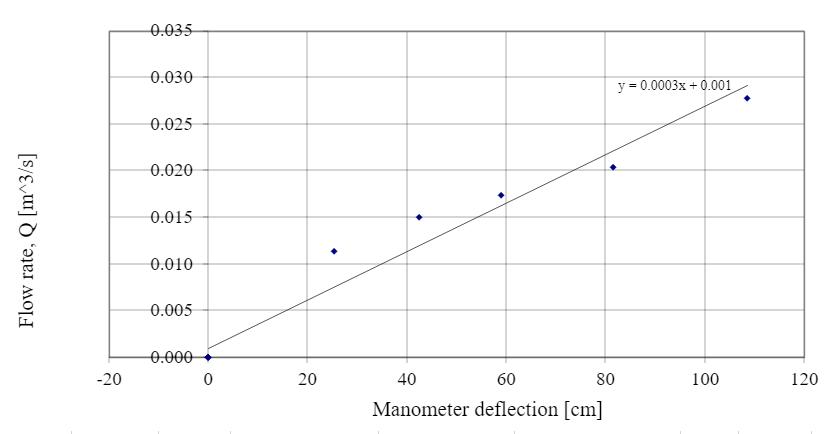
In our experiment, my lab group only collected 5 data points instead of the recommended 10 points. The weight-time measurements shown above are used to calculate the flow rate, Q, in m^3/s. The manometer deflection is calculated using the equation from the previous step that was generated relating the transducer reading to the actual deltaH of the transducer. Cd is the discharge coefficient that is calculated using the flowrate, Q, and the Manometer deflection calculations. The velocity, V is calculated using the known values of the pipes that the water is passing through along with the flowrate, Q. Finally, the Reynolds Number, Re, is calculated using the velocity, V, and the viscosity of the water.
Graph of Flow Rate, Q, As a Function of Manometer Deflection DeltaH
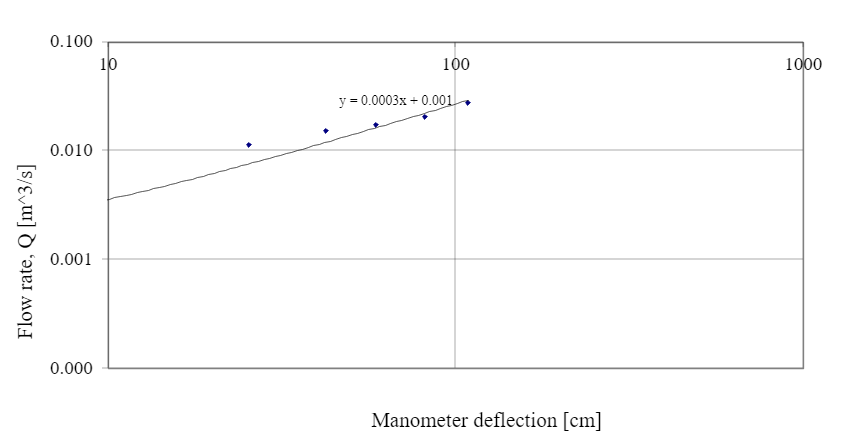
Graph of Flow Rate, Q, As a Function of Manometer Deflection DeltaH on a Logarithmic Scale
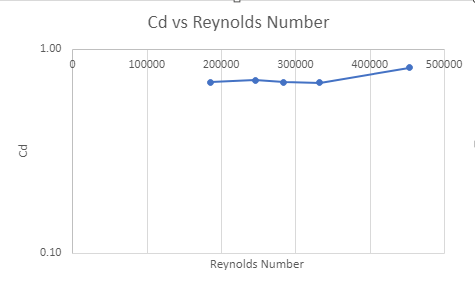
Graph of Discharge Coefficient, Cd, As a Function of Reynolds Number Re on Linear-lgo Scales
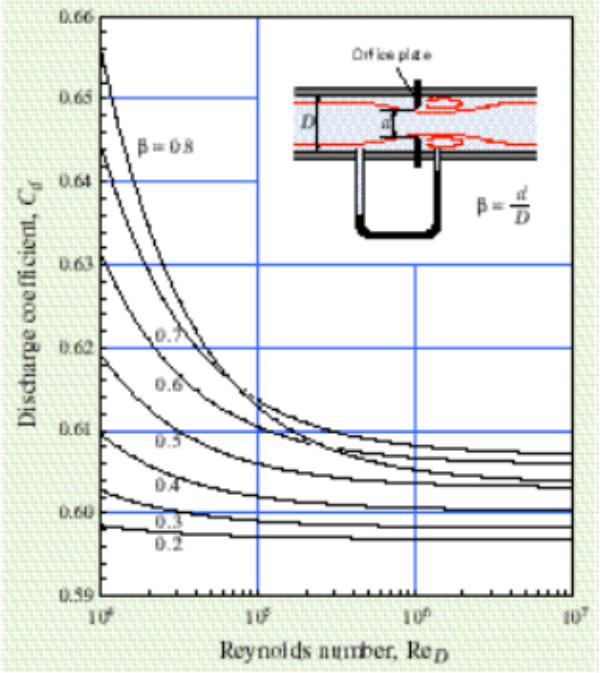
In this graph, Reynolds number is calculated using the know full diameter of the pipe, D, the velocity in the pipe V, and the viscosity, v, Using the equation
Re = (V*D)/v
Graph of Calibration Curve for the Paddlewheel Flowmeter Voltage Versus the Actual Discharge Rate Q.
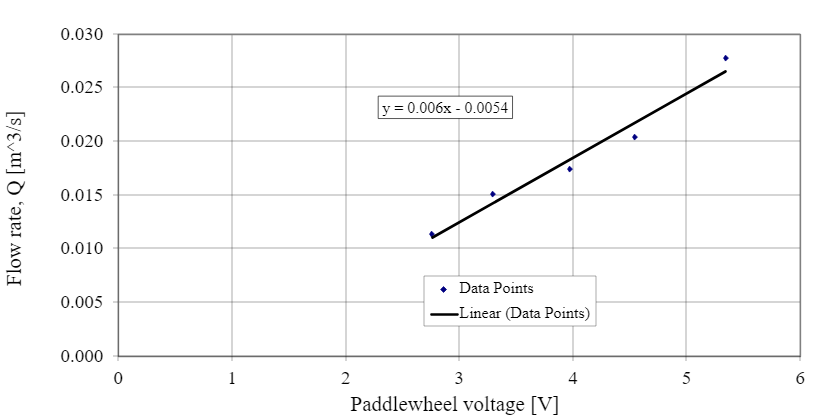
In none of our data points does the paddlewheel seem to be motionless, although at lower velocities, we would see a cutoff velocity where our paddlewheel flowmeter would no longer be able to detect the flow. Our minimum and maximum velocities achieved during the experiment were 1.790 m/s and 4.363 m/s respectively.
Questions
Some of the questions we need to ask ourselves about the experiment are listed below.
- Is the discharge coefficient Cd essentially constant over the range of Reynolds numbers tested? Are the experimentally measured values for Cd close to the ideal value of unity derived theoretically? What corrections might need to be made to the theory to obtain more realistic values for Cd?
Using the graph above, we can see that the discharge coefficients, Cd, are essentially constant over the range of Reynolds numbers tested. Although these values of Cd are not close to the ideal value of 1. This could be due to the imperfection in the flow of the water. With a Cd of 1, we would need a very low Reynolds number and laminar flow. Our setup does not provide an incredibly low Reynolds number, nor provide laminar flow.
- How reliable is the paddlewheel flowmeter? Was the reading more accurate at high or low flow rates?
The paddlewheel flowmeter was reliable with little deviations from the line of best fit. Although our data does not show it, a paddlewheel flowmeter is not as accurate at low flow rates due to the water not having enough inertia to turn the paddlewheel. This will cause a sharp drop in voltage readings, even though water is still slipping through the paddlewheel flowmeter.
Conclusion
With this guide, you should now be able to calibrate our different flowmeters and be able to obtain accurate measurements of flow rates and discharge coefficients.