Created Table in Google Sheets
Google Sheets does not have a built-in data table like Microsoft Excel does. The method below creates an alternative table in Google Sheets, replicating Microsoft Excel's features as best as possible. The table can be colored and sorted by color, value, or A-Z.
Supplies
- Laptop or device with internet access
- Google account
- Google sheets document with data
Create Data Set
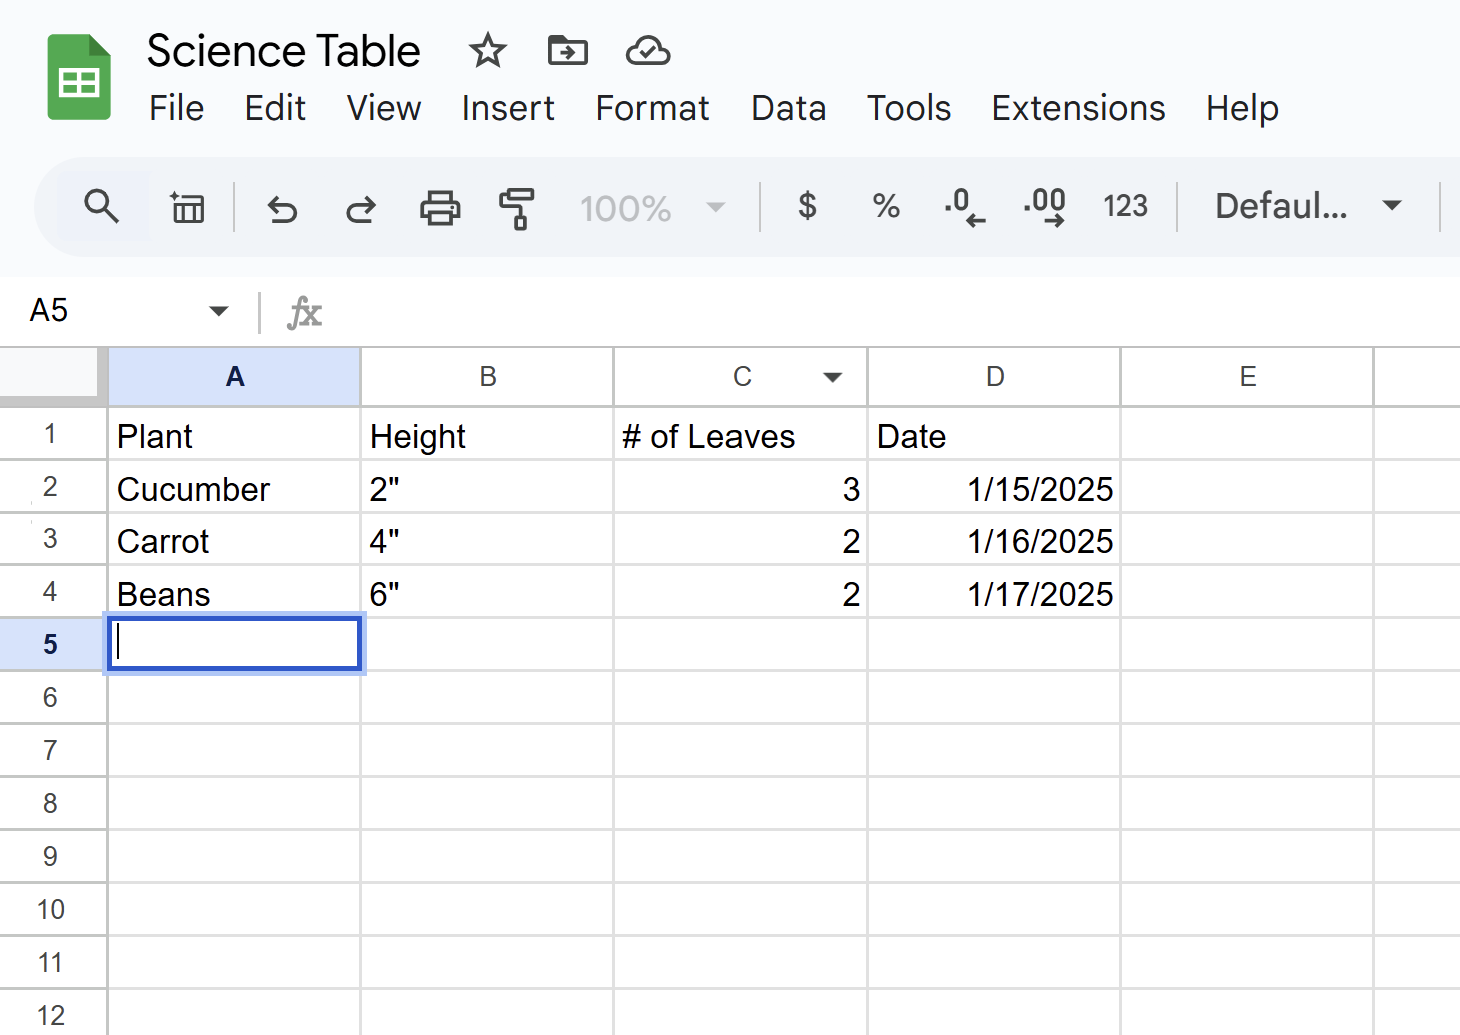
Ensure list categories are set up, as you want them, on your table. The location of the actual data is not important as it can be moved around by sorting later.
Color Data Set
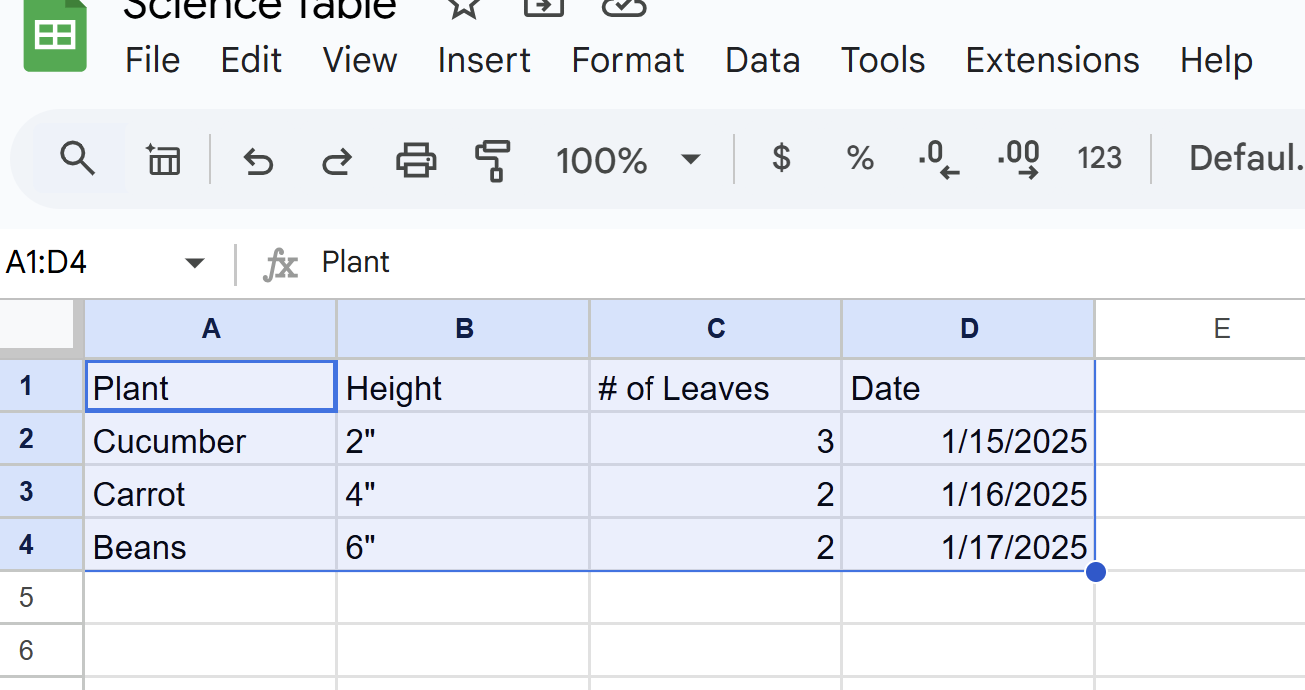

1. Highlight Data Set
2. Click “Format” in the toolbar
3. Click “Alternating Colors” in the format tab
4. Choose the Color you want for your table
Although the coloring has no intrinsic function to the table, it is aesthetically pleasing and makes the table more readable. Skipping this step won’t affect the table’s functionality.
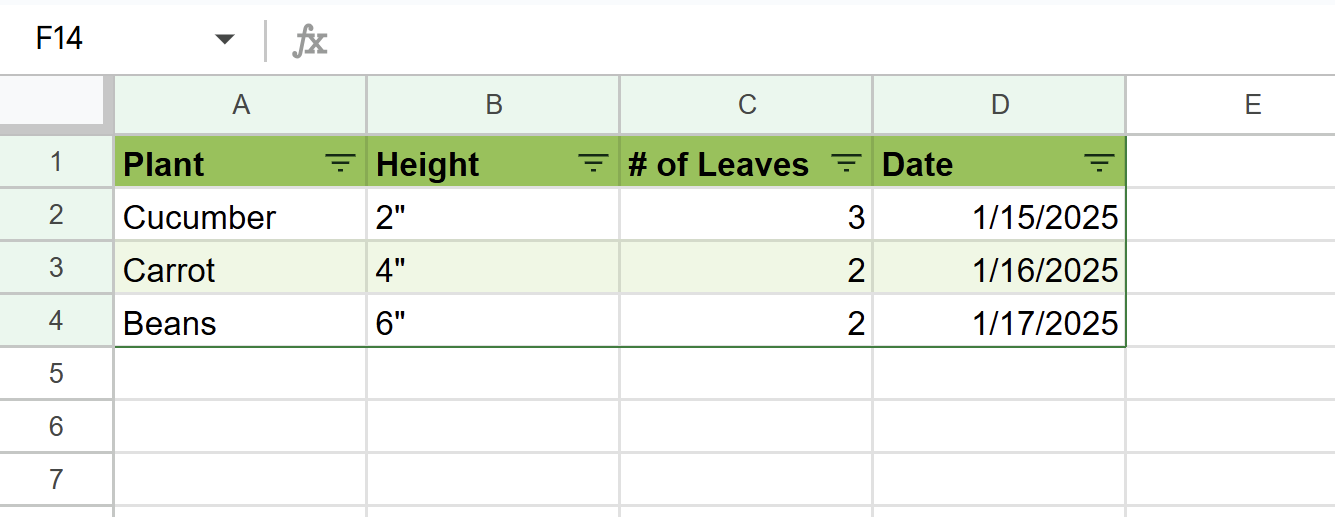
Create a Filter for Table

1. Highlight the table
2. Click “Data” in the Toolbar
3. Click “Create Filter” in the data tab
This step enables the filter feature, allowing data to be sorted in the table. To sort the data, click the dropdown icon (looks like an upside-down triangle) on the title of the category you wish to sort, and select how you want the data sorted.
Coloring Data (Optional)

Step 1. Highlight piece of data
Step 2. Click the paint bucket on the bottom toolbar
Step 3. Select the color you want to make the piece of data
By coloring the data, you can now access the “sort by color” feature on the data filter