Dirt Nerd: Know What Your Soil Needs Before You Grow
by ayushmaan45 in Outside > Backyard
1178 Views, 13 Favorites, 0 Comments
Dirt Nerd: Know What Your Soil Needs Before You Grow
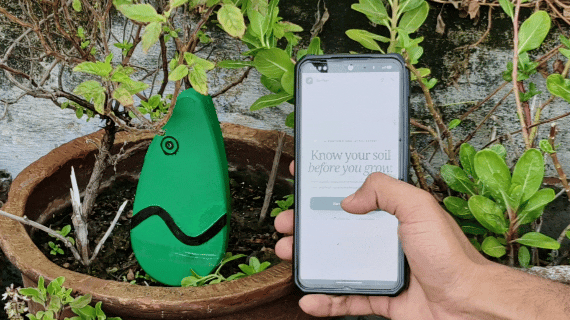
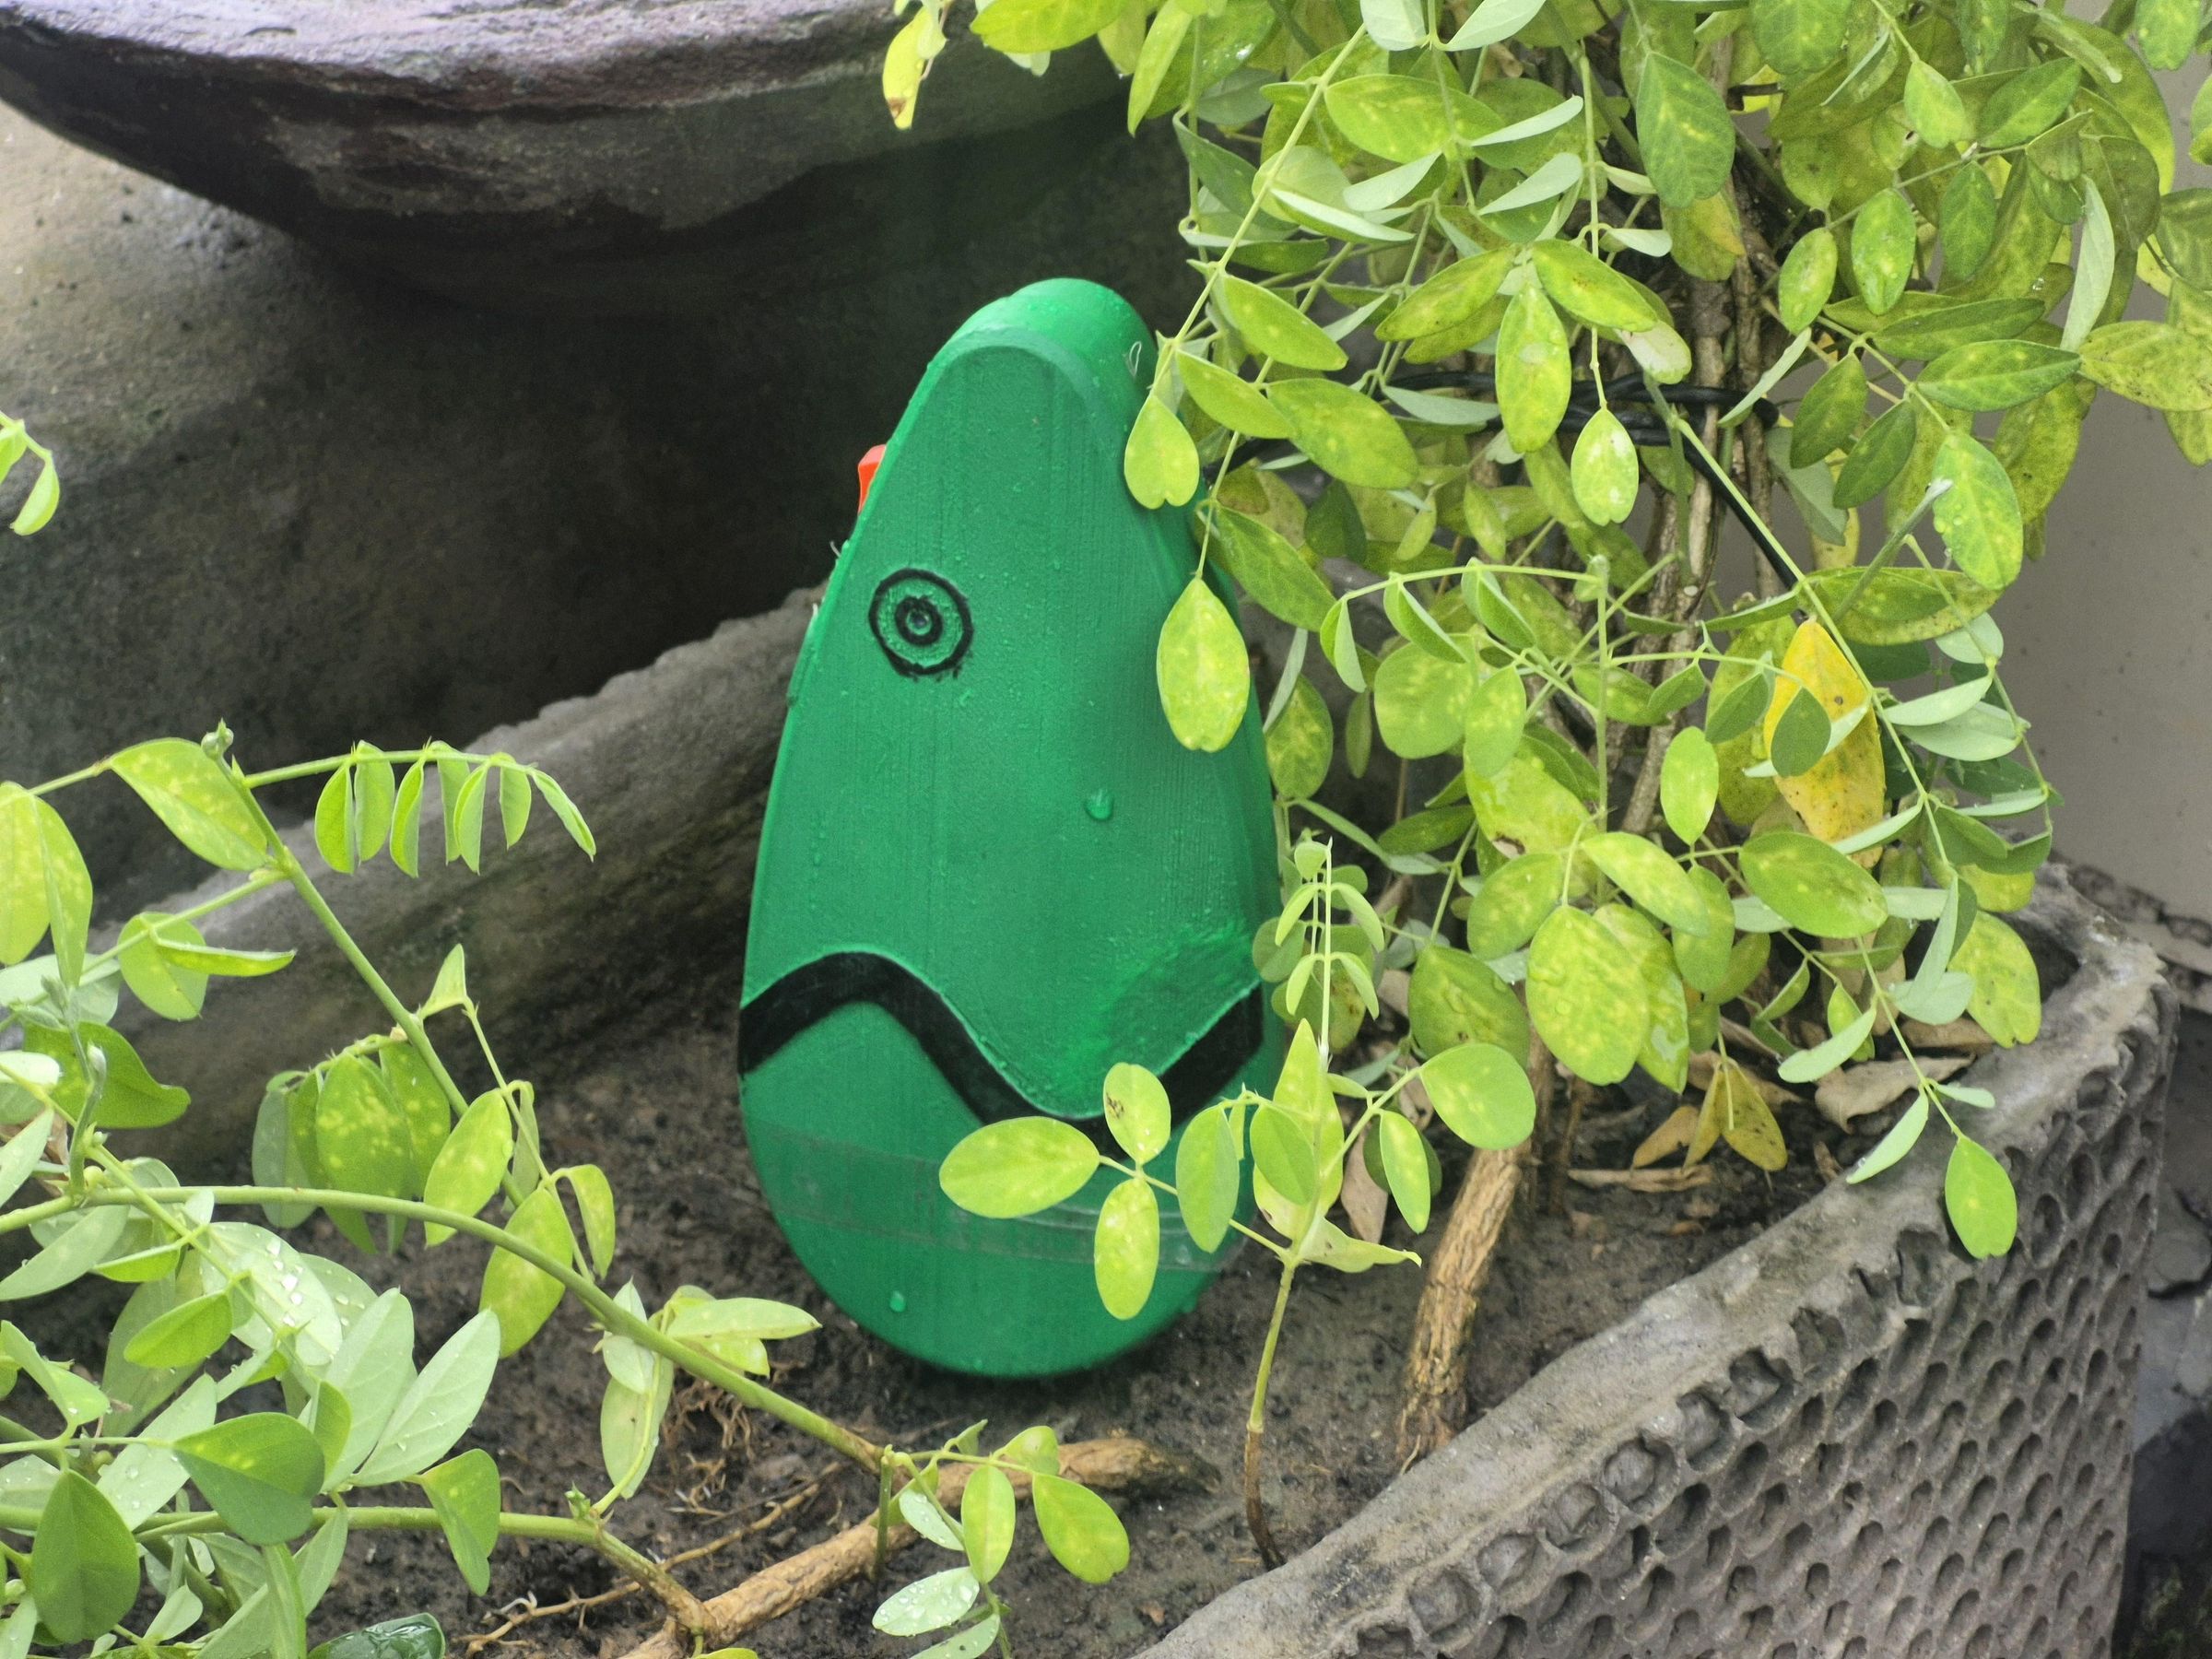
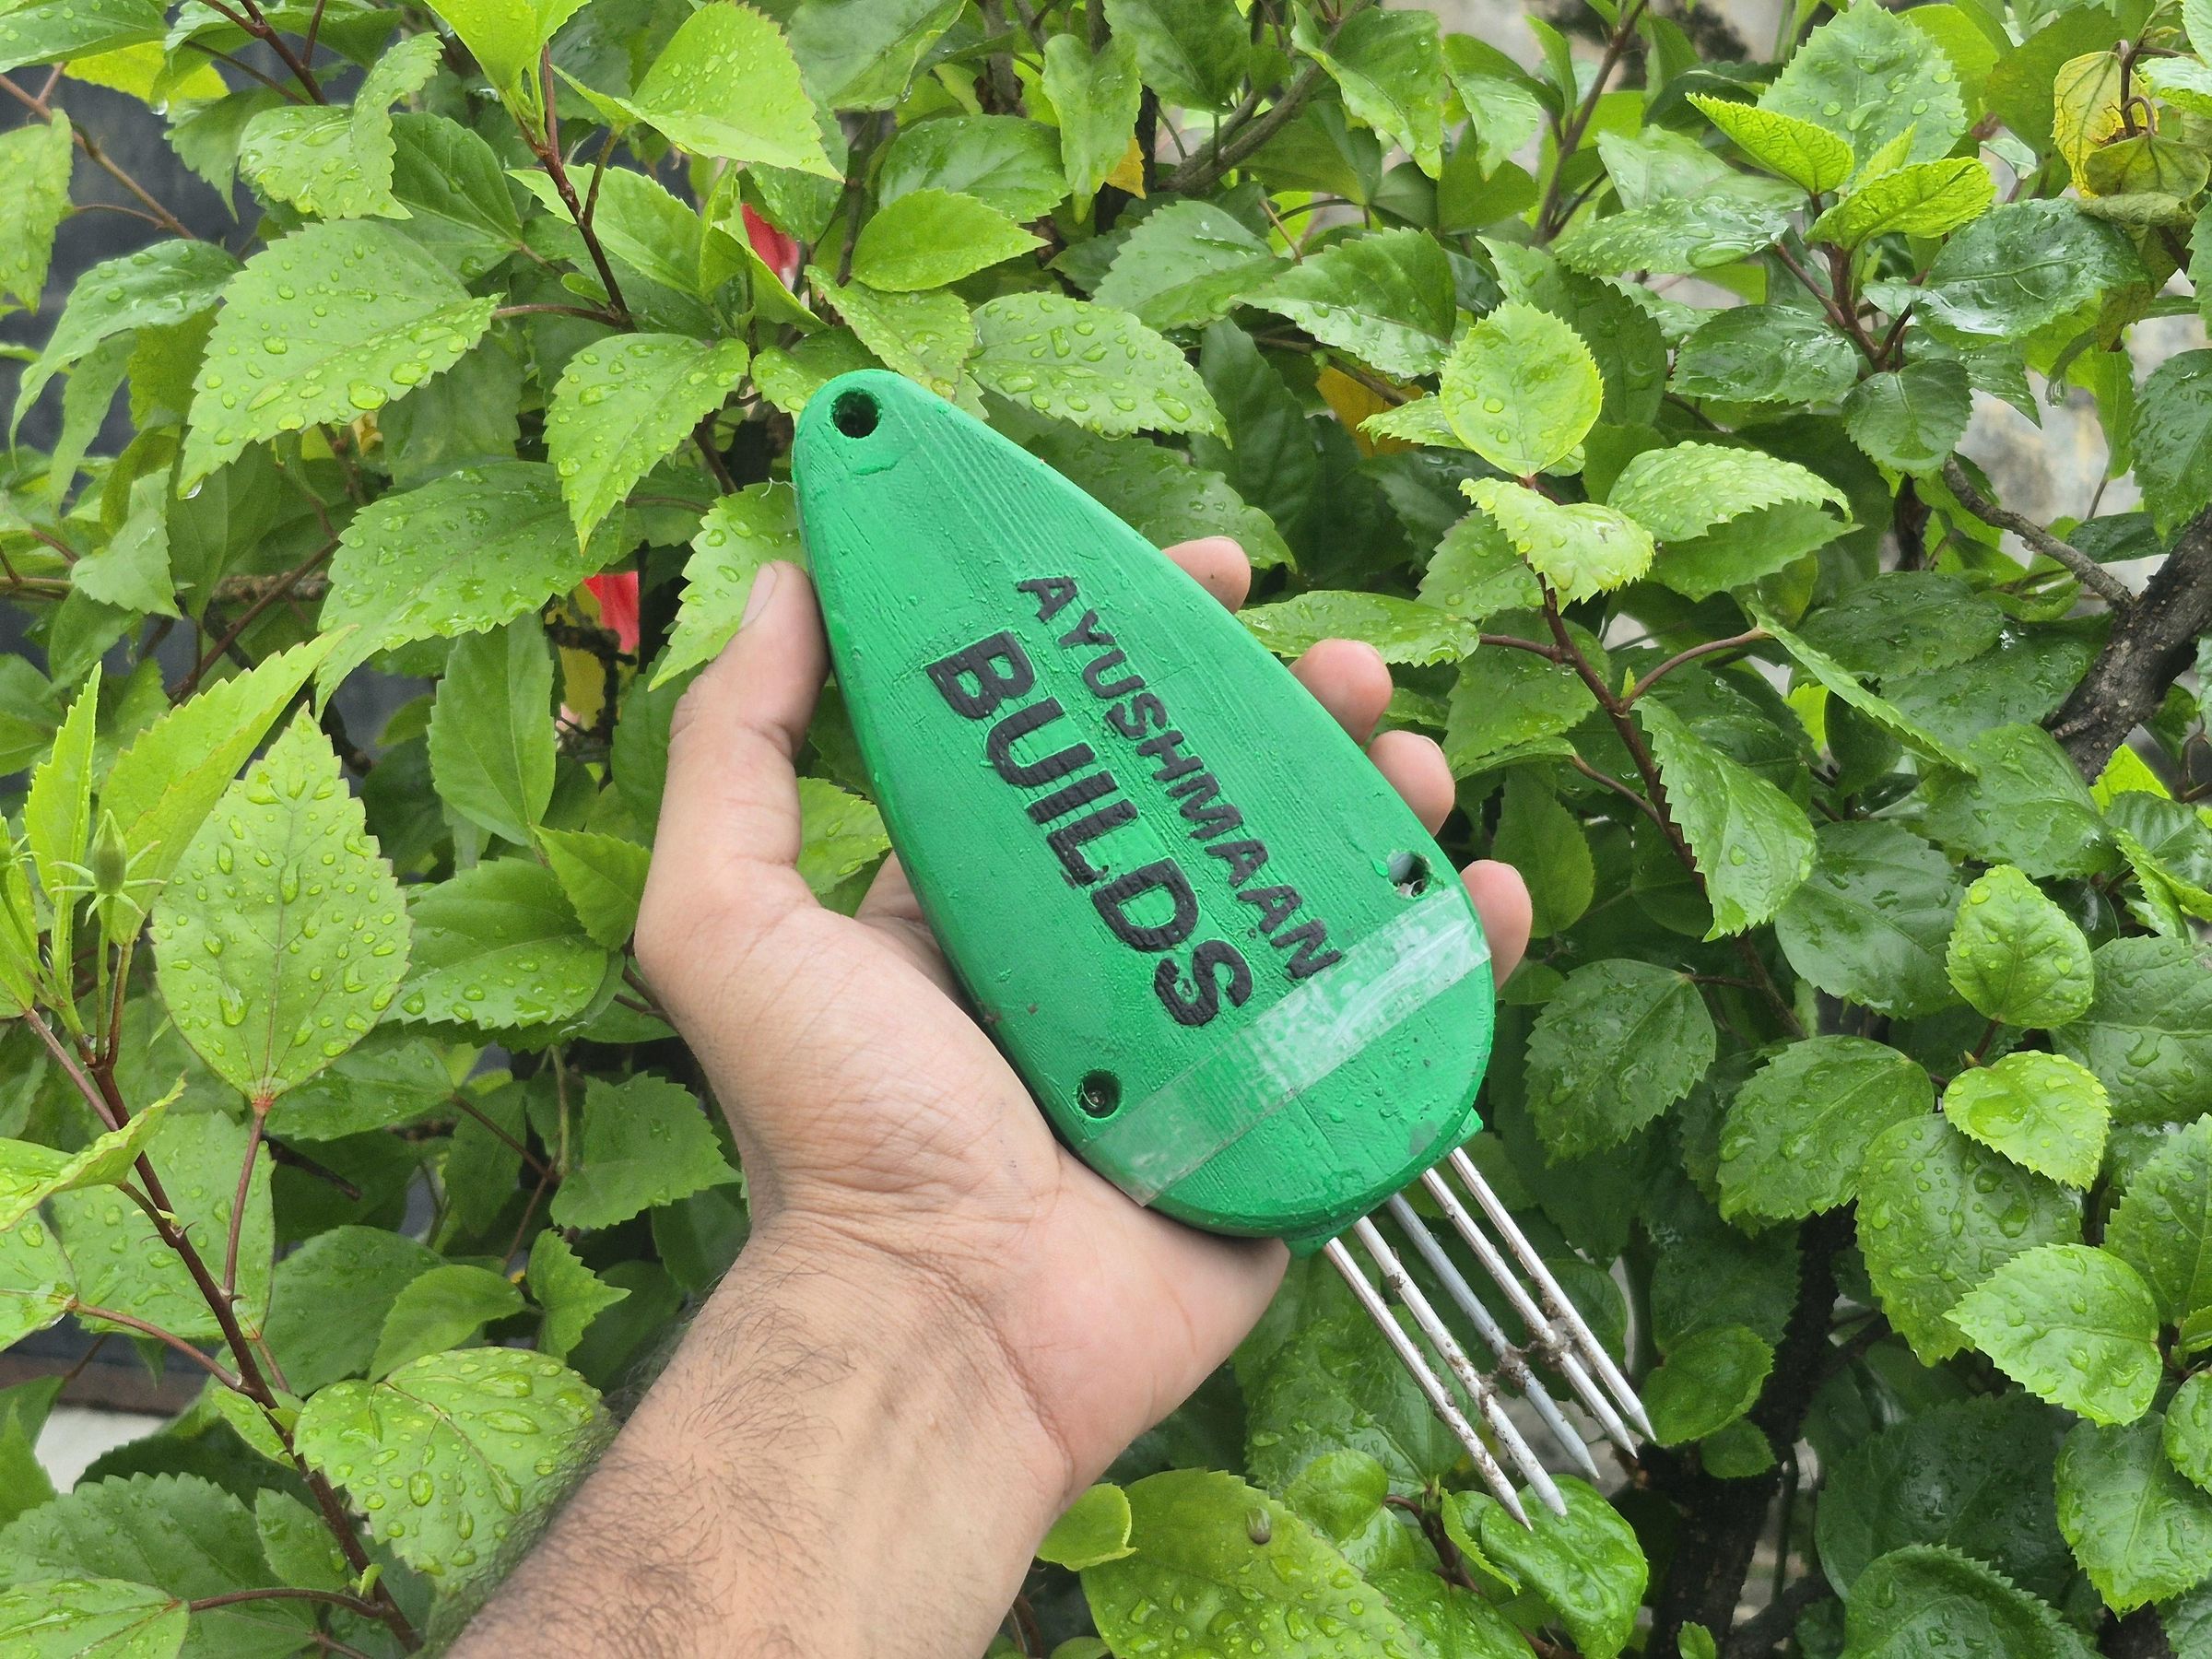
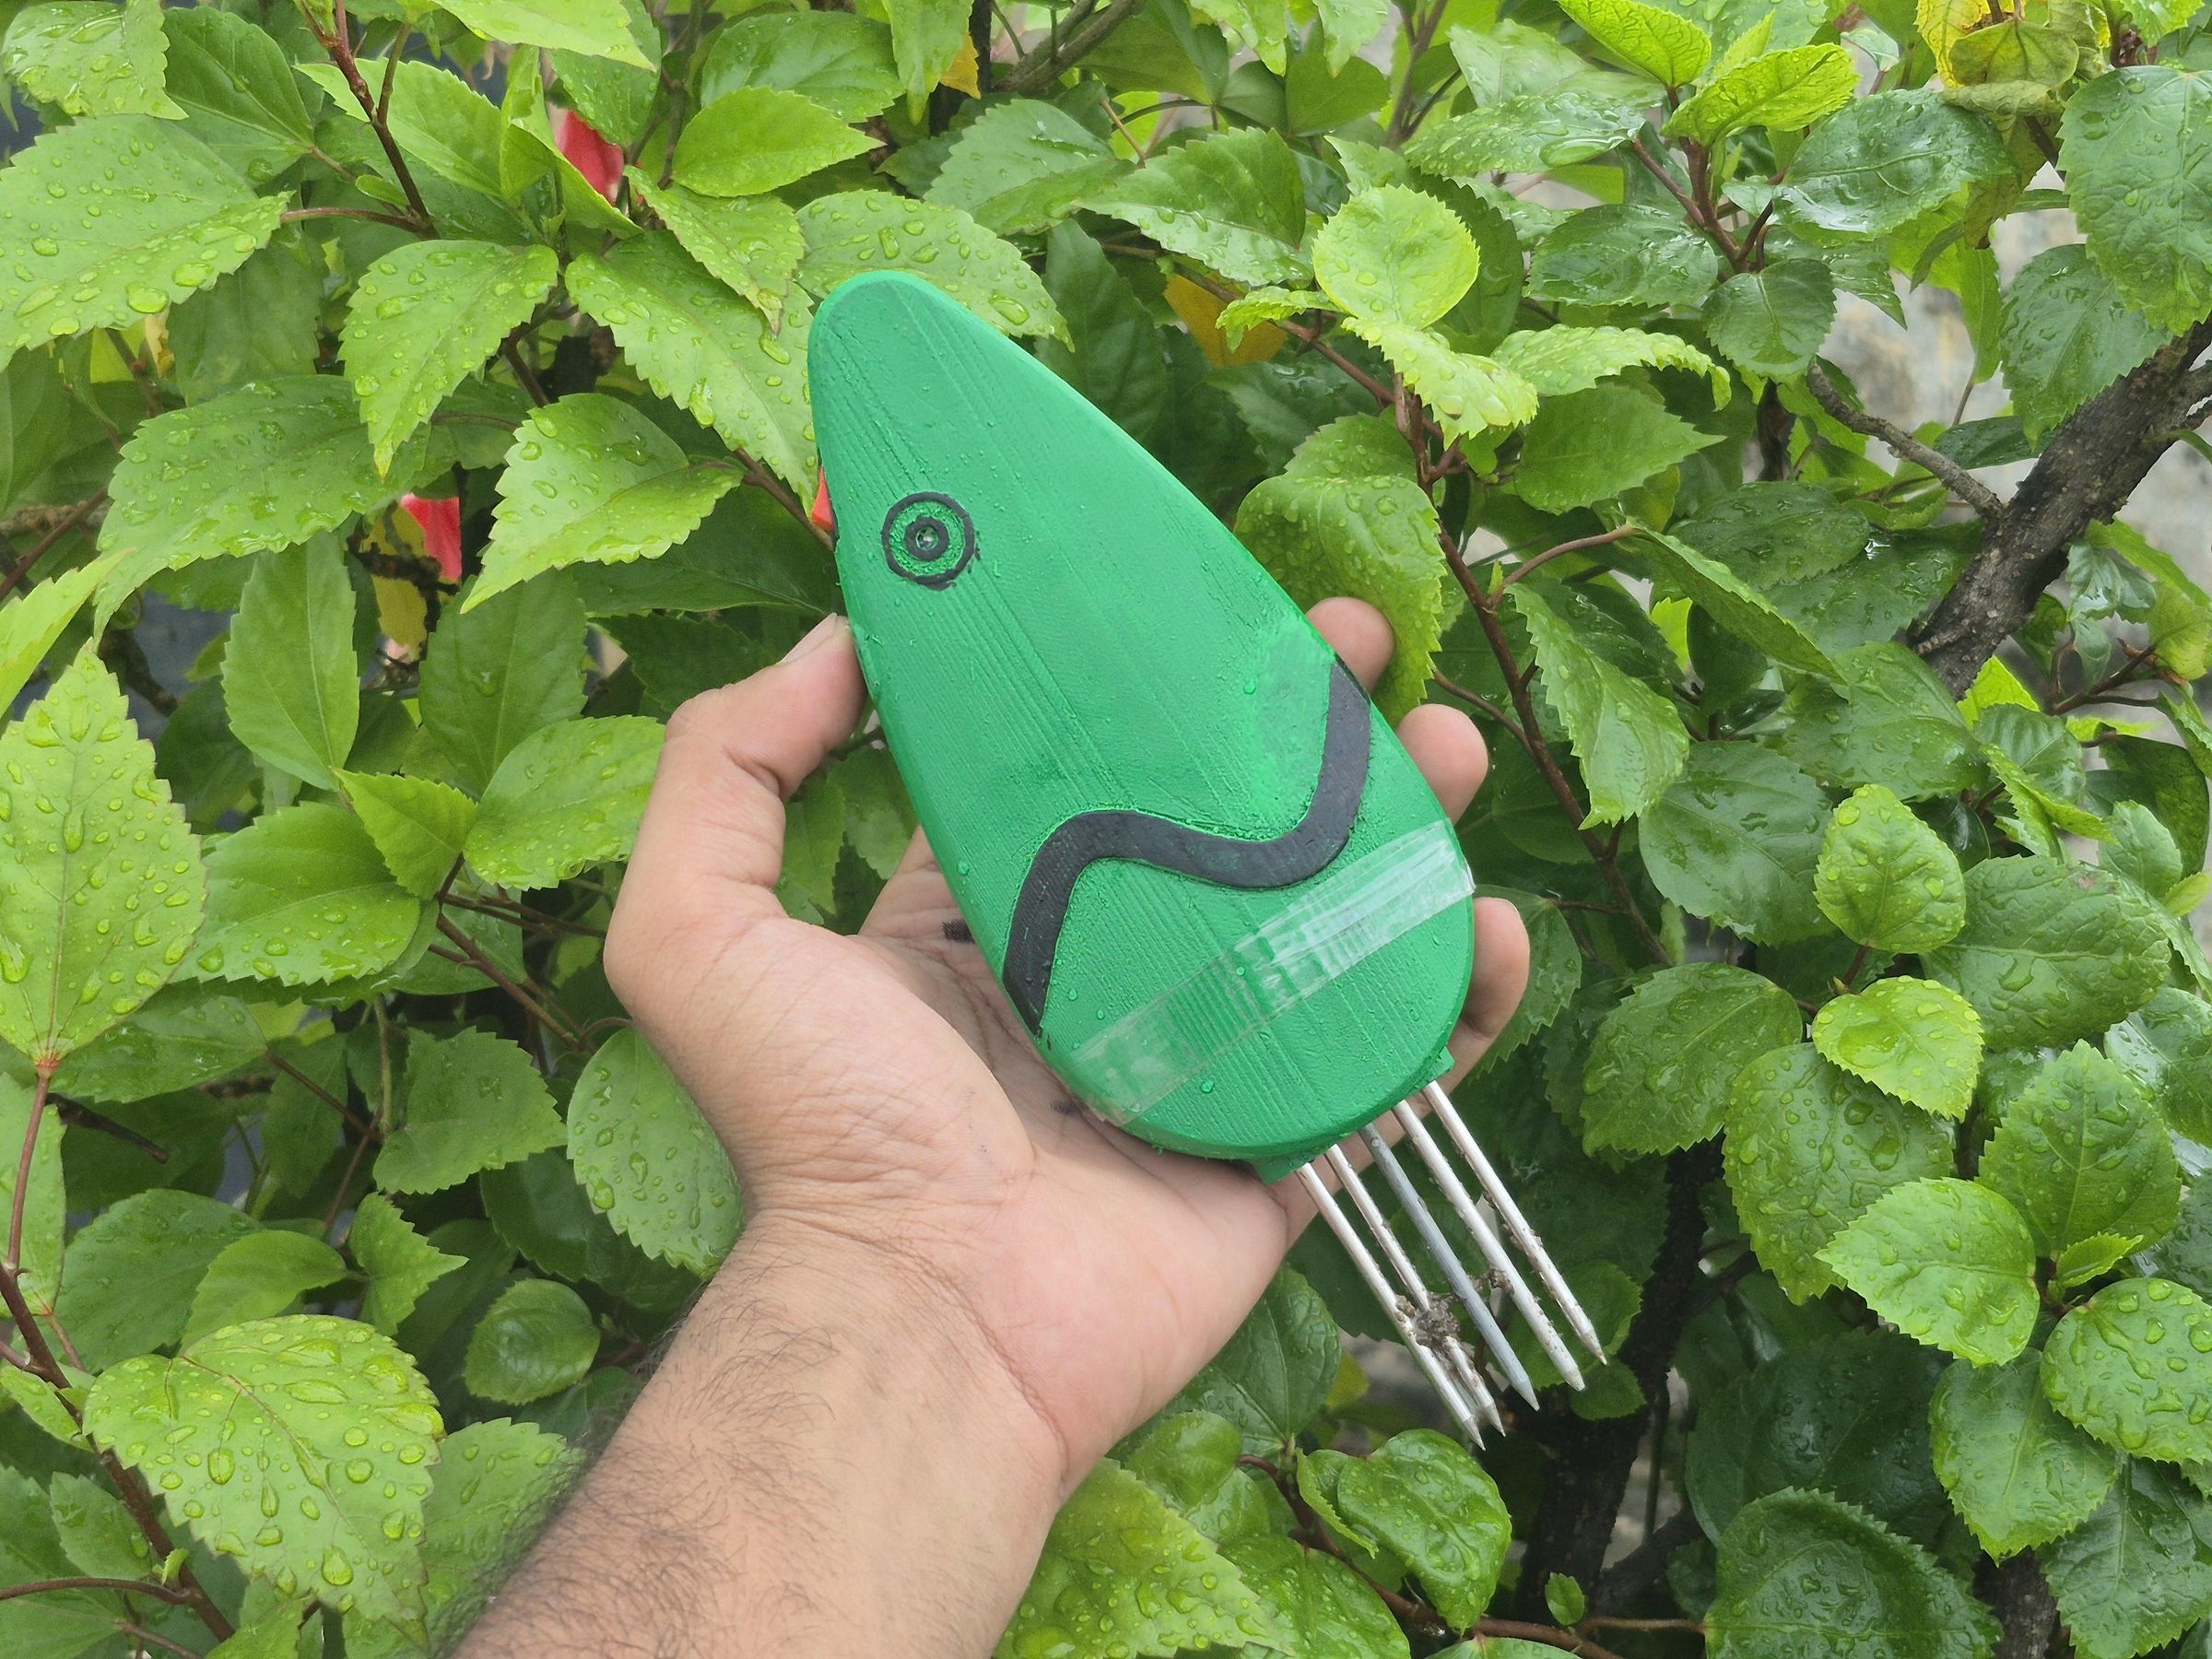
Hi! I'm Ayushmaan, a B.Tech Electrical and Electronics Engineering student who loves building things, especially projects that bring together electronics, design, and a bit of code.
For this project, I wanted to build something around a pretty simple question: if I want to grow a particular plant, how do I know whether the soil I have is actually good for it?
Most soil monitoring projects can give you readings like moisture, temperature, or pH, but those numbers alone don't mean much if you don't know what your plant actually needs. So, I decided to take this a step further and built a portable soil analyzer that not only measures the soil but also helps make sense of those readings.
The device measures different soil parameters and sends them to a web dashboard. From there, you can select the crop or plant you want to grow, and the dashboard compares the current soil conditions with what that plant prefers. It then points out what's good, what might be lacking, and what you can do to improve the soil.
I wanted the whole thing to be simple enough that you don't need to understand soil chemistry just to figure out whether your backyard is ready for some tomatoes.
So, in this Instructable, I'll take you through how I built the electronics, designed the enclosure, put together the firmware and dashboard, and eventually tested the whole thing with some actual soil.
Let's get started!
Supplies
.jpeg)
.jpeg)
Electronics
- Seeed Studio XIAO ESP32-C6
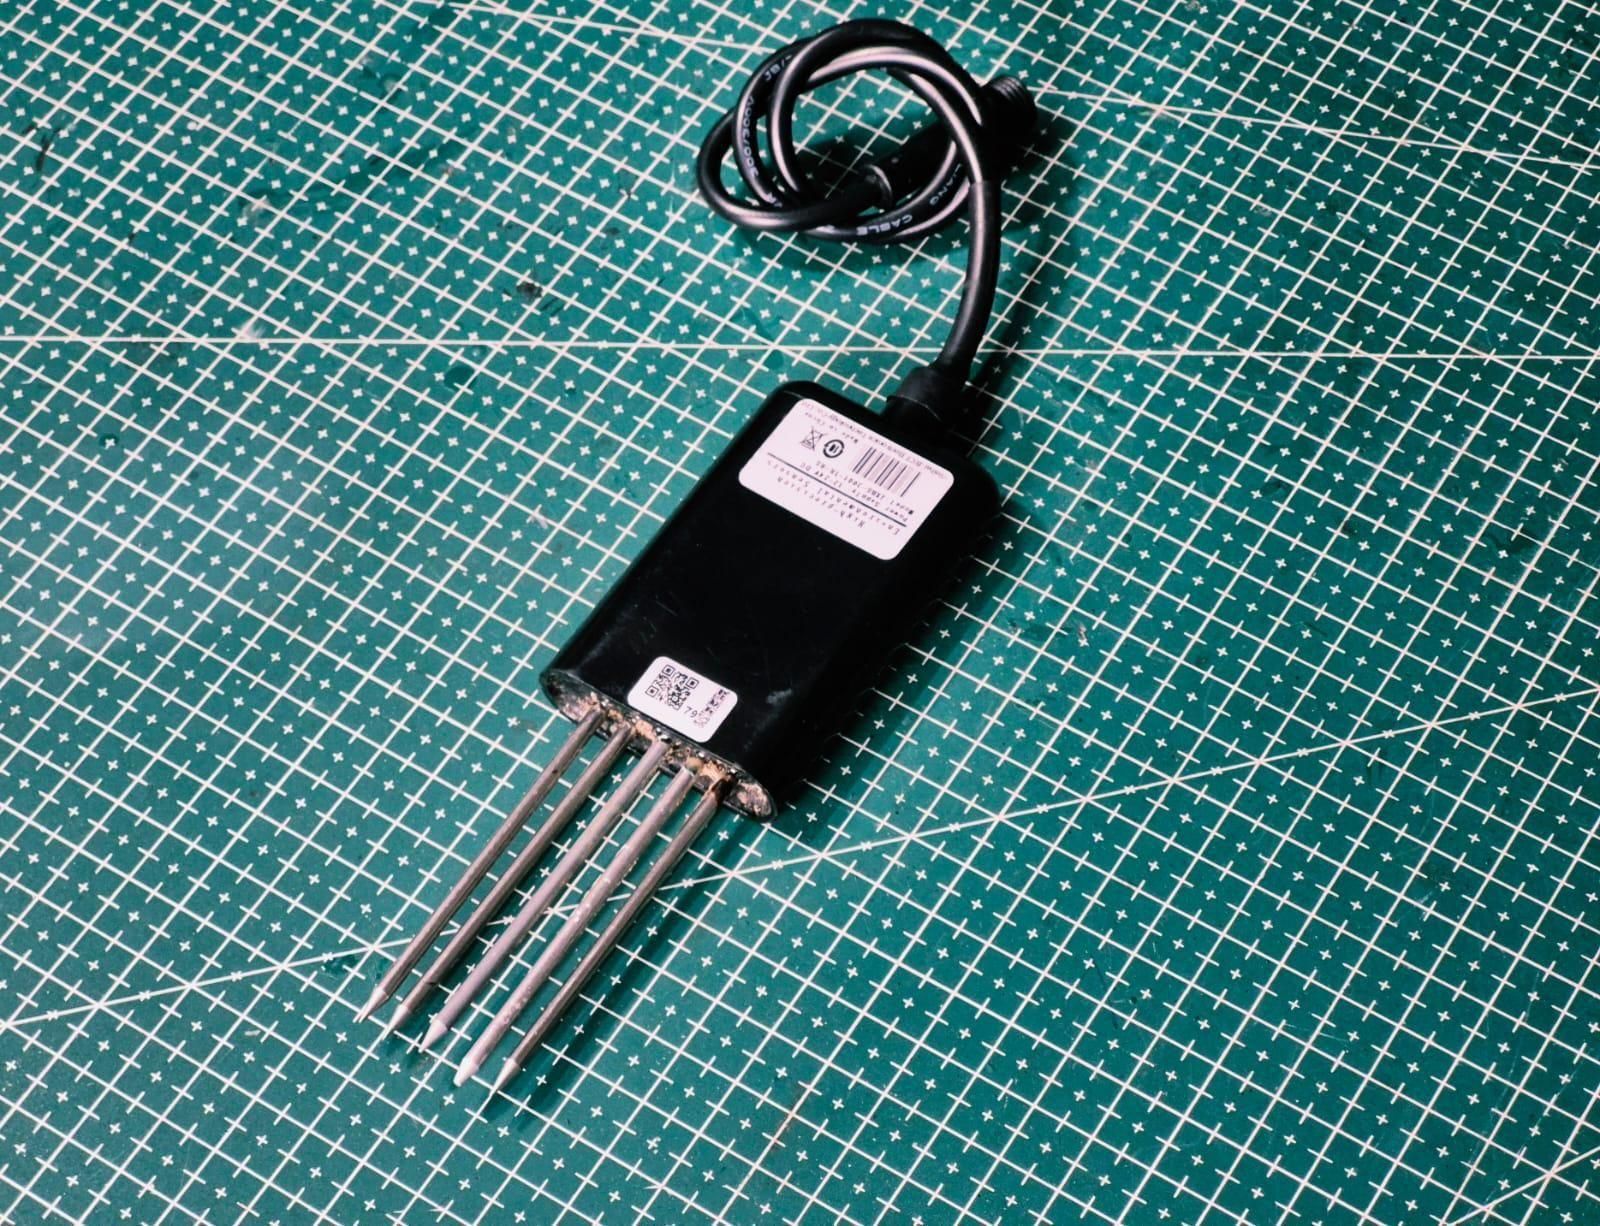
- 7-in-1 RS485 NPK soil sensor
- MAX485 RS485-to-UART module
- One WS2812 addressable RGB LED
- External power supply suitable for the soil sensor
- USB-C data cable
- Jumper wires
- Small screws for joining the enclosure
- Optional 120-ohm RS485 termination resistor
Fabrication
- Anycubic Kobra S1 3D printer
- Tri-colour PLA filament
- Sandpaper in a few grit
- Green spray paint
- Basic hand tools
Software
- Fusion 360
- Arduino IDE 2.x
- Next.js and React
- Node.js
How the Project Works
Dirt Nerd has four main parts: the soil sensor, the communication electronics, the ESP32 firmware and the web dashboard.
The 7-in-1 probe is inserted into the soil and measures moisture, temperature, pH, EC and NPK values.
It sends the measurements using RS485 Modbus communication.
The MAX485 converts that differential RS485 signal into UART signals that the XIAO ESP32-C6 can understand.
The ESP32 reads seven Modbus registers, converts the raw numbers into useful units and stores the most recent valid reading.
It then creates a small HTTP server on the local Wi-Fi network.
The website requests the readings from the ESP32 through the /data endpoint.
The complete data path is:
The addressable LED provides a simple connection indicator.
- Red means the ESP32 is not connected to Wi-Fi.
- Green means it has connected and started the local web server.
The dashboard can operate in Demo or Live mode.
Demo mode is useful for demonstrating the interface without the physical sensor. The readings can also be changed manually from Settings.
Live mode requests the latest values from the IP address shown in the ESP32 Serial Monitor.
After the readings appear, the user selects a crop. Changing the crop changes the stored ideal ranges, compatibility message and recommendations.
The current prototype stores the crop profiles locally. This keeps the interface usable without depending on an external plant database.
Designing the Enclosure
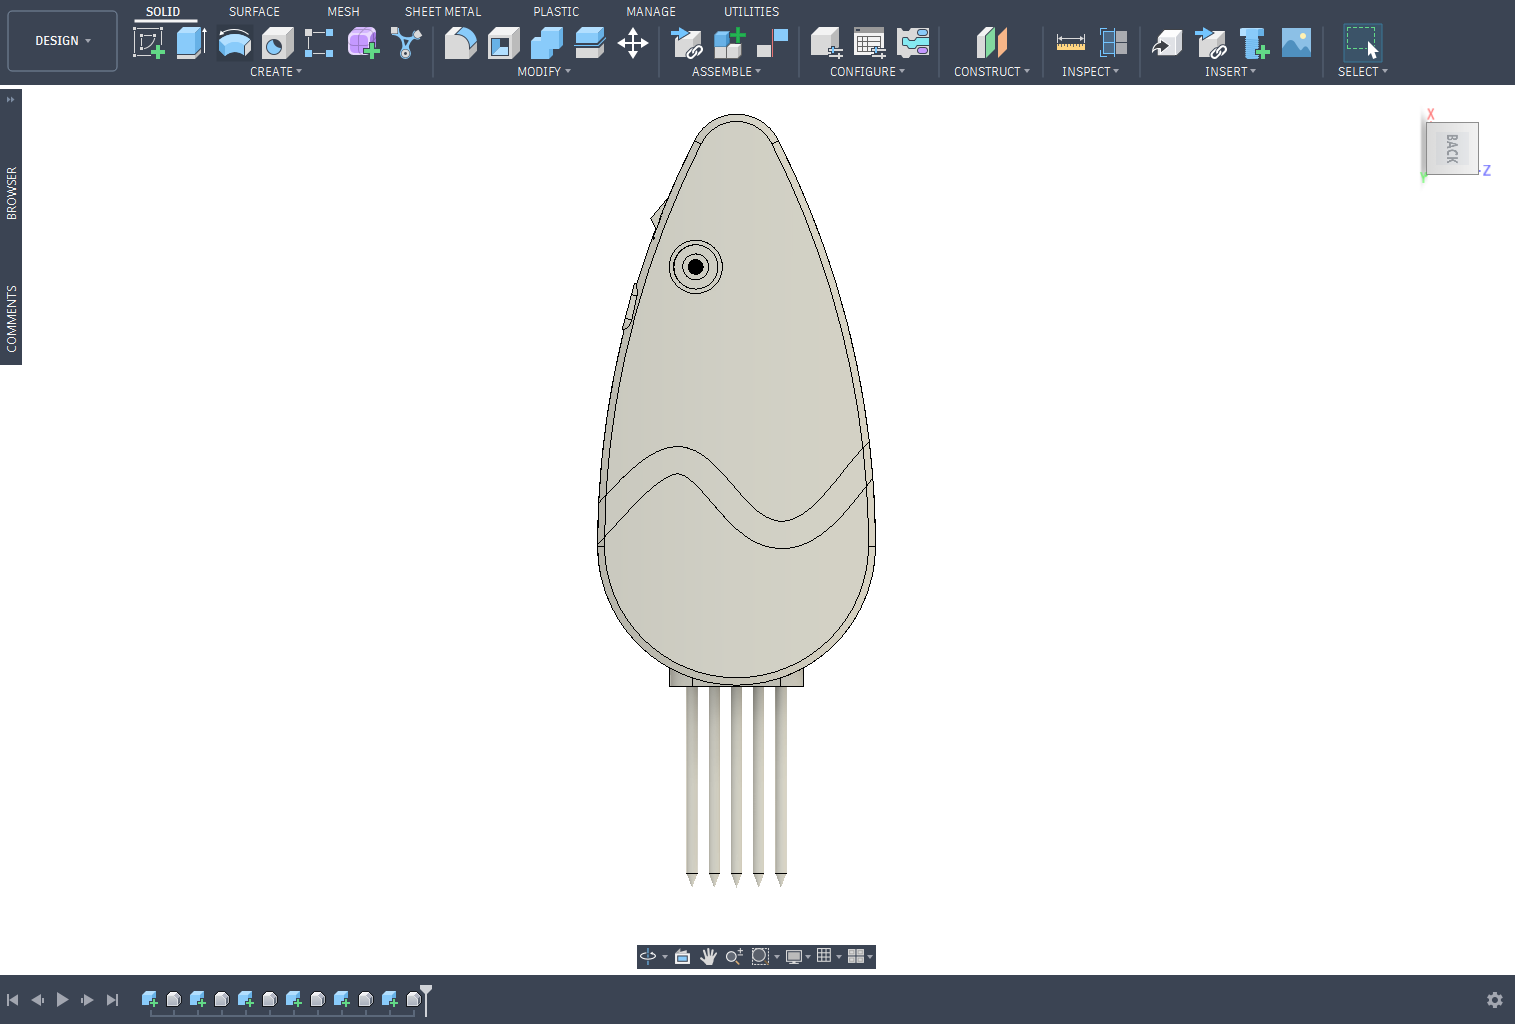
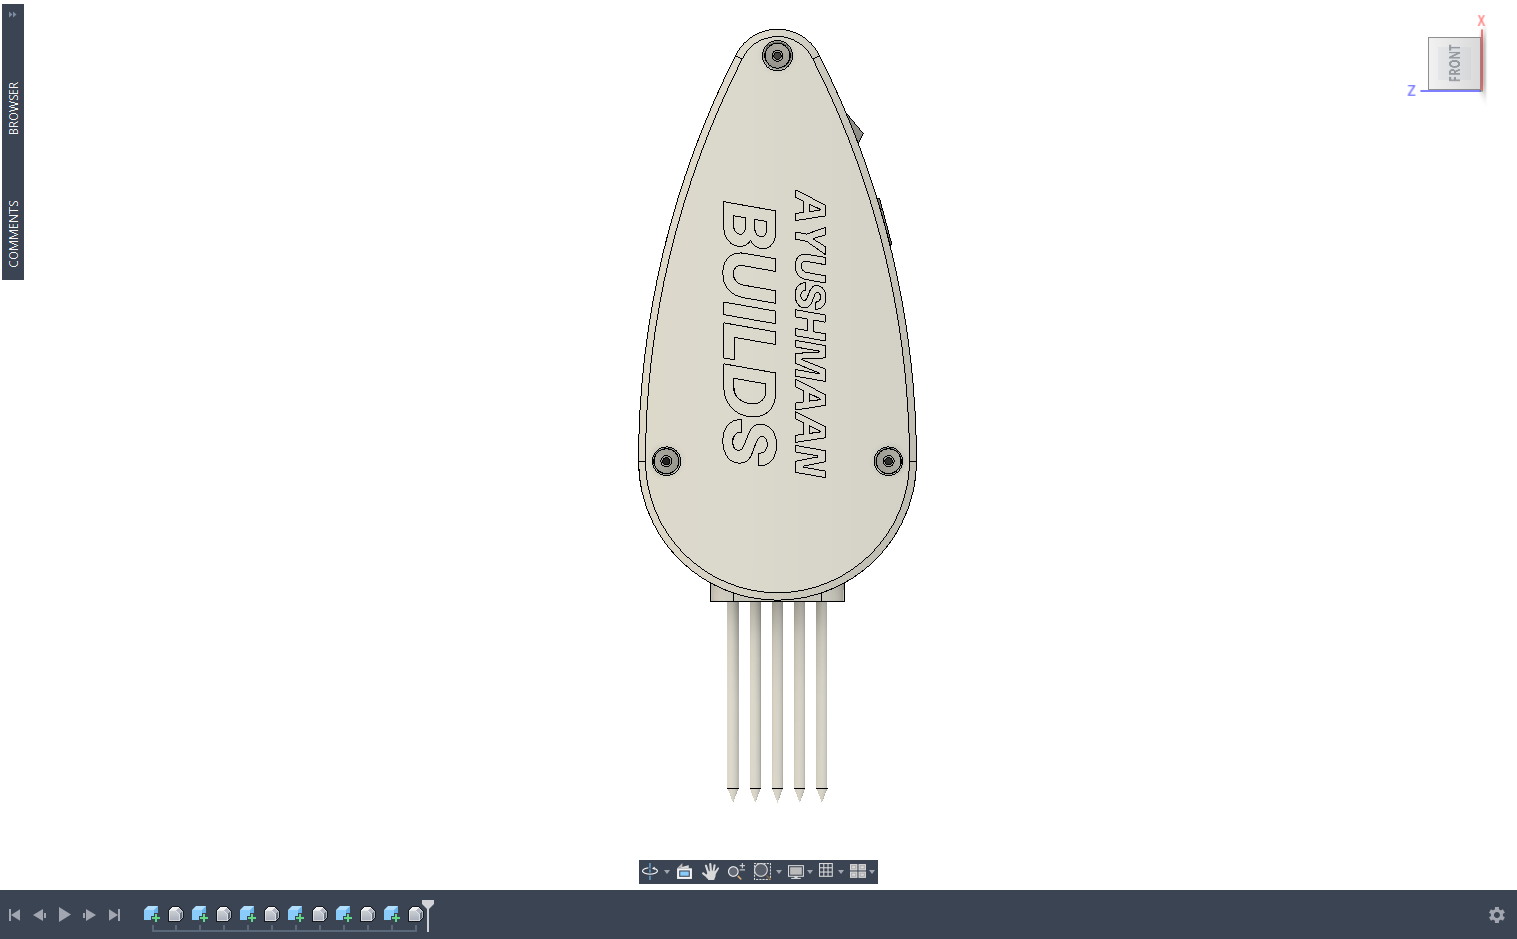
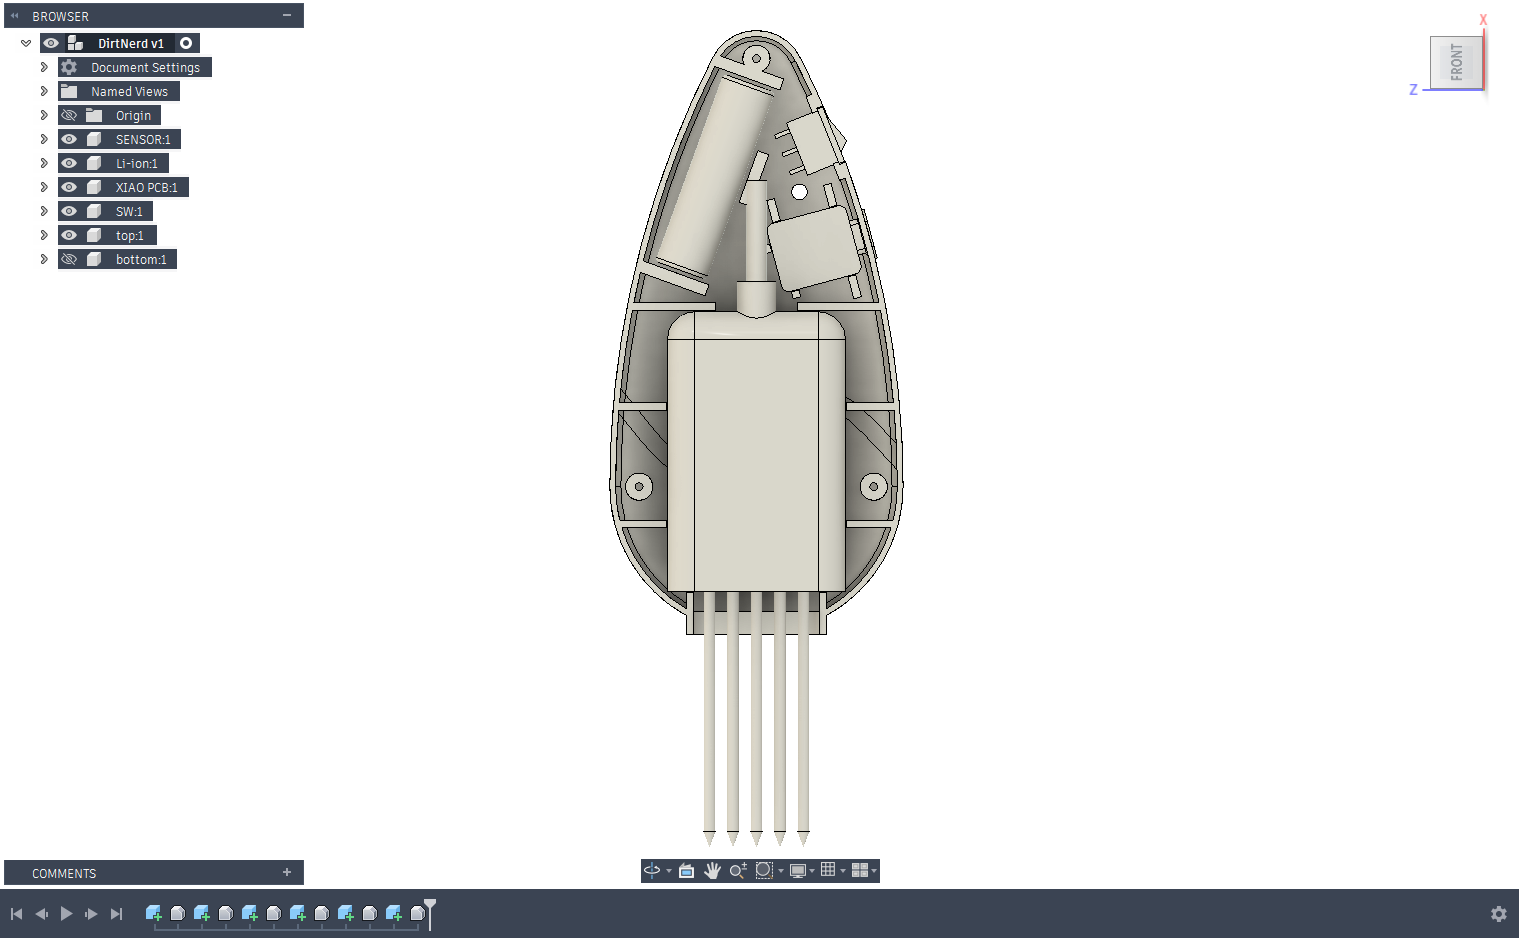
I designed the enclosure in Fusion 360.
My first idea was to make the body resemble a water droplet because the project is connected to soil, plants and water.
As I continued changing the curves and making room for the electronics, the enclosure unintentionally started looking a little like a squid.
It was not part of the original plan, but I liked that it gave the project its own character, so I kept the shape.
The case was divided into two screw-together halves.
While modelling it, I had to leave space for the XIAO ESP32-C6, MAX485 module, wiring, status LED and the sensor cable.
I also added screw points around the enclosure so the two sides could be opened again if the electronics needed adjustment.
The curved exterior made the product look friendlier, but it also meant checking internal clearance carefully. Components that fit inside a rectangular box can interfere with curved walls near the edges.
Before printing, I checked the component dimensions and used the section view in Fusion 360 to look for collisions.
3D Printing
.jpeg)
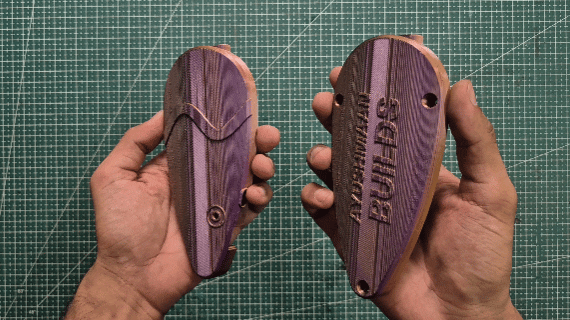
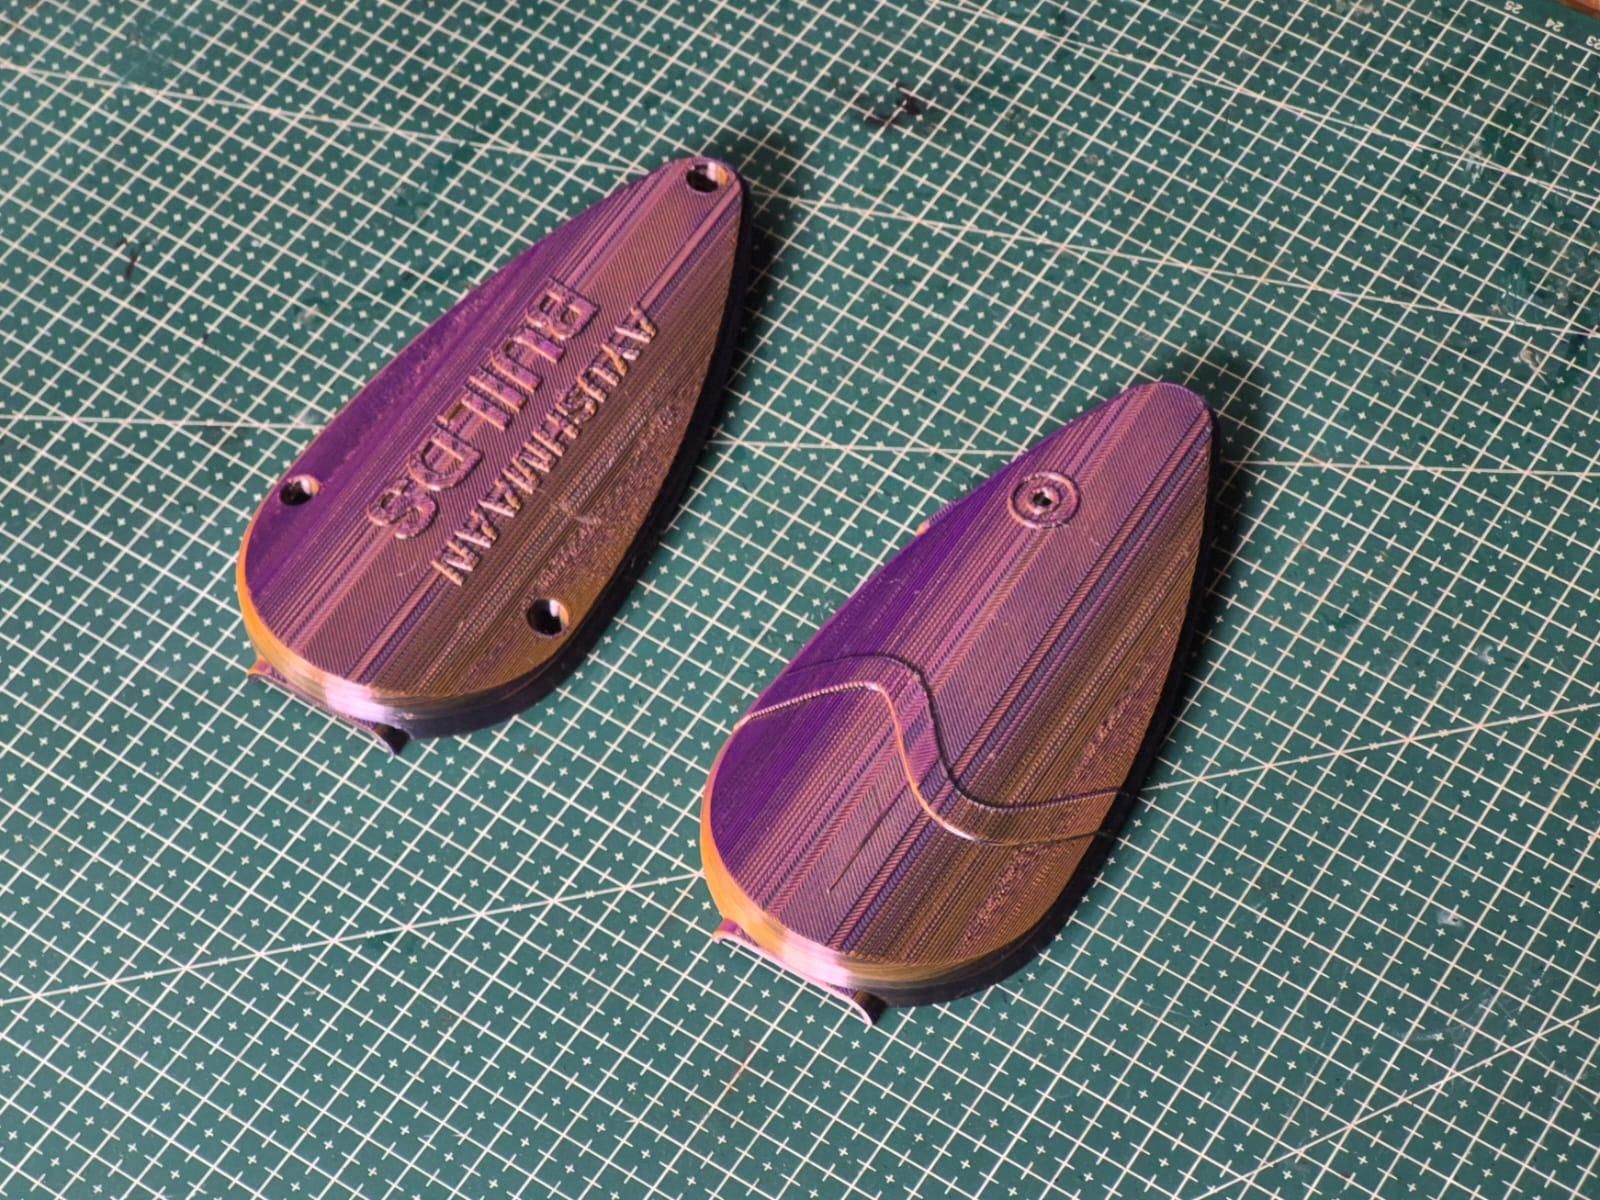
I printed the enclosure on an Anycubic Kobra S1 using tri-colour PLA.
I originally chose the filament because I expected the changing colours to make the curved enclosure look more interesting.
For a practical starting profile, I used settings suitable for a normal PLA enclosure:
- 0.20 mm layer height
- 3 wall loops
- 4 top and bottom layers
- 15% gyroid infill
- Supports only where required by the curved overhangs
- Brim for the parts with a smaller contact area
- Approximately 210°C nozzle temperature
- Approximately 60°C bed temperature
These values may need minor adjustment for a different PLA brand or slicer profile.
I oriented the two halves to keep the visible outer surfaces as clean as possible and to reduce unnecessary support material inside the component area.
The parts printed successfully, but the tri-colour effect did not look as good as I had imagined.
The colour changes distracted from the shape and made the surface appear less consistent. Instead of reprinting the complete enclosure immediately, I decided to finish the existing print with paint.
Painting and Finishing
.jpeg)
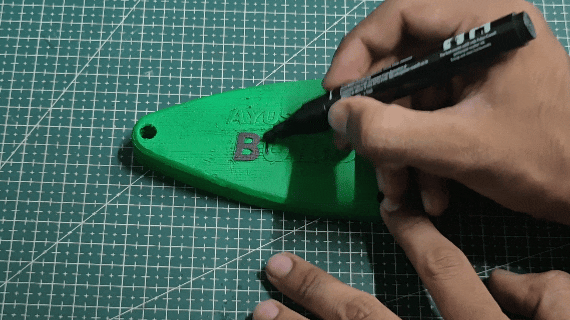
I began by removing the supports and cleaning the edges of both printed halves.
The surfaces were sanded gradually until the most visible layer lines and rough areas were reduced.
I paid extra attention to the seam where the two sides meet because any unevenness there would remain obvious after assembly.
After sanding, I removed the dust and applied a light primer suitable for plastic.
The primer helped reveal scratches and low areas that were difficult to see on the tri-colour filament.
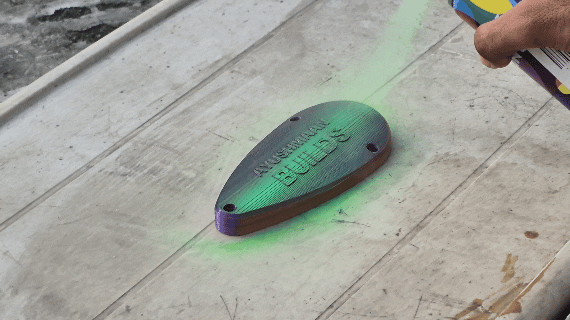
I sanded those areas again and then applied several light coats of green spray paint.
Light coats worked better than one heavy coat because they reduced runs and preserved the enclosure details.
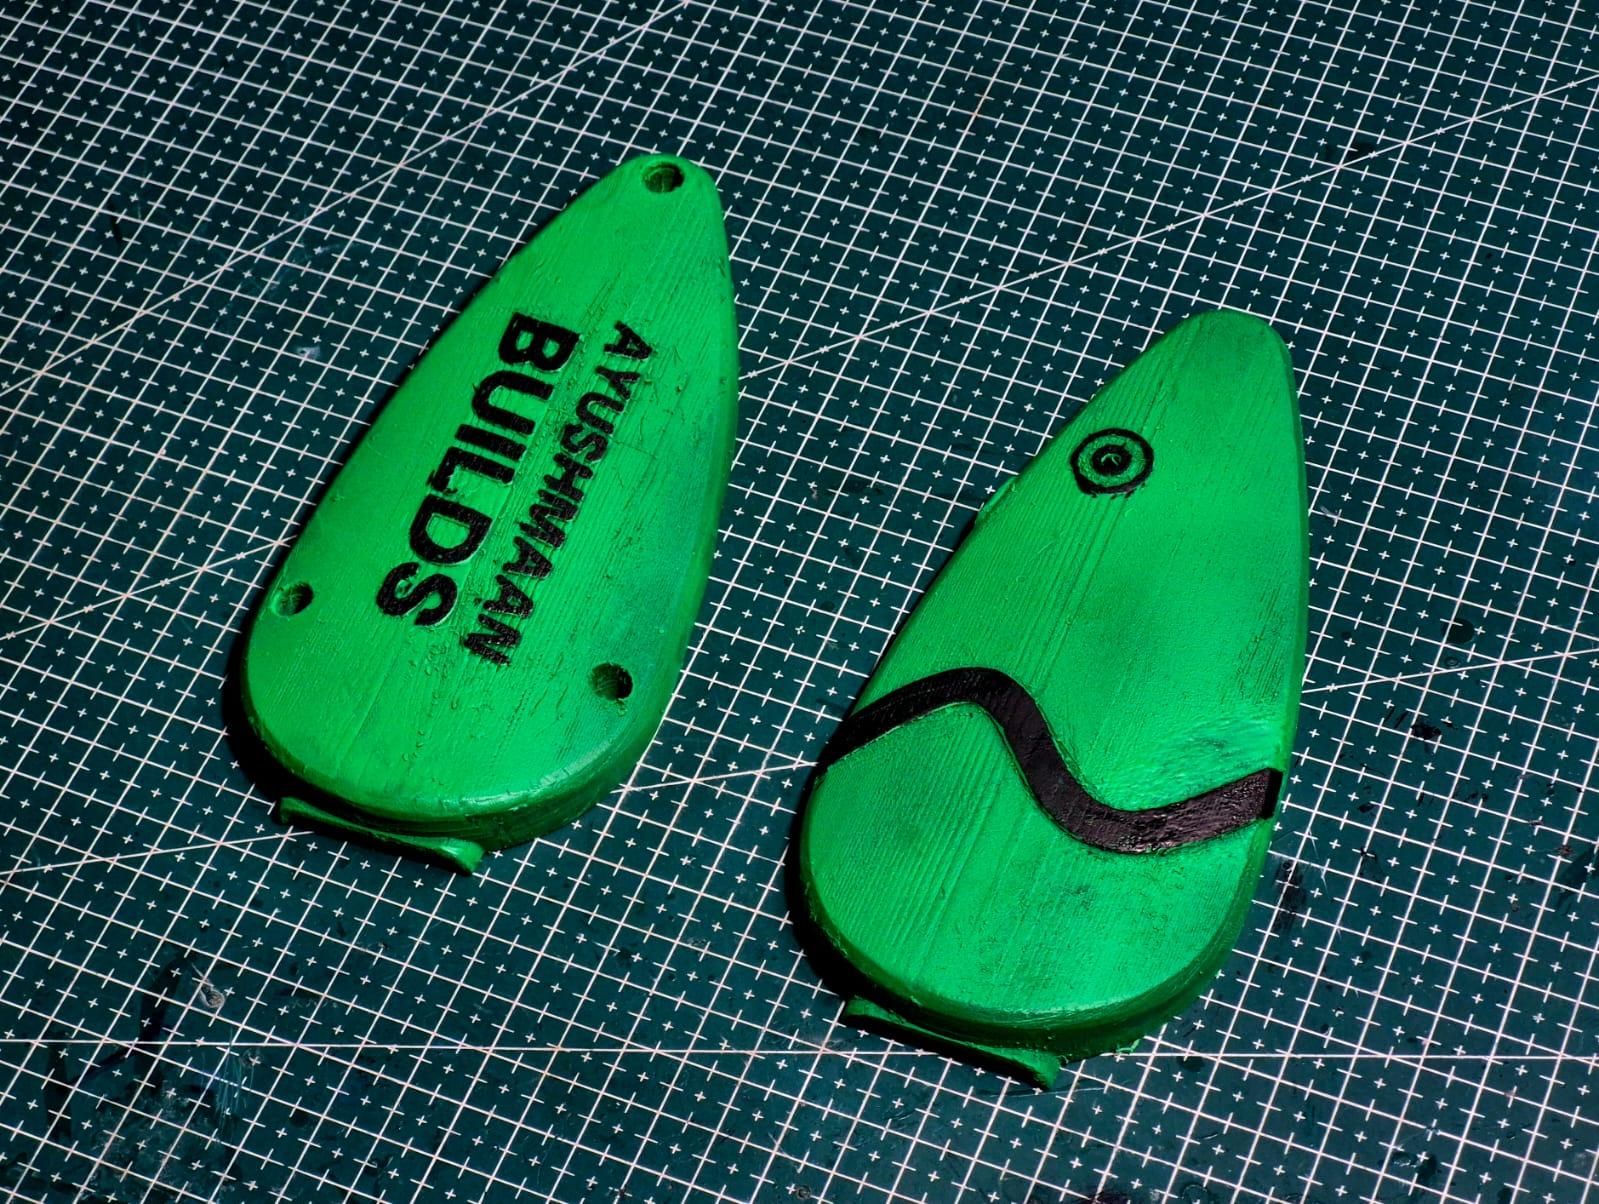
The final green finish looked much cleaner and matched the gardening theme far better than the original tri-colour surface.
I allowed the paint to cure completely before installing the electronics so the finish would not be marked during assembly.
Electronics
.jpeg)
.jpeg)
XIAO ESP32-C6
I selected the XIAO ESP32-C6 because it is compact, has built-in Wi-Fi and still provides enough pins for the RS485 interface and status LED.
Its small size also made it easier to fit everything inside the custom enclosure.
7-in-1 Soil Sensor
The soil probe combines seven measurements in one body: moisture, temperature, pH, electrical conductivity, nitrogen, phosphorus and potassium.
Using one industrial-style probe reduced the number of separate sensors and wires inside the project.
The sensor communicates over RS485 rather than producing seven separate analogue signals. This is useful for longer cables and outdoor environments, but it means the ESP32 needs an RS485 interface.
MAX485 Module
The MAX485 converts the sensor’s RS485 communication into UART serial data.
Its DE and /RE pins are tied together so one ESP32 pin can switch the module between transmitting a request and receiving the response.
A traditional MAX485 module normally runs at 5V. Its RO output should not be connected directly to a 3.3V ESP32 input.
I used level shifting between the module and XIAO. A 3.3V-compatible MAX3485 module can also be used as a cleaner alternative.
WS2812 LED
I added a single WS2812 RGB LED because it can display the device state using only one data pin.
The LED is red while Wi-Fi is disconnected and changes to green after the ESP32 connects.
Power and Ground
The soil sensor uses its own suitable external supply.
The XIAO, MAX485, sensor supply and LED must share a common ground. Without a common reference, RS485 communication can become unreliable even when the A and B wires are correct.
Circuit Diagram
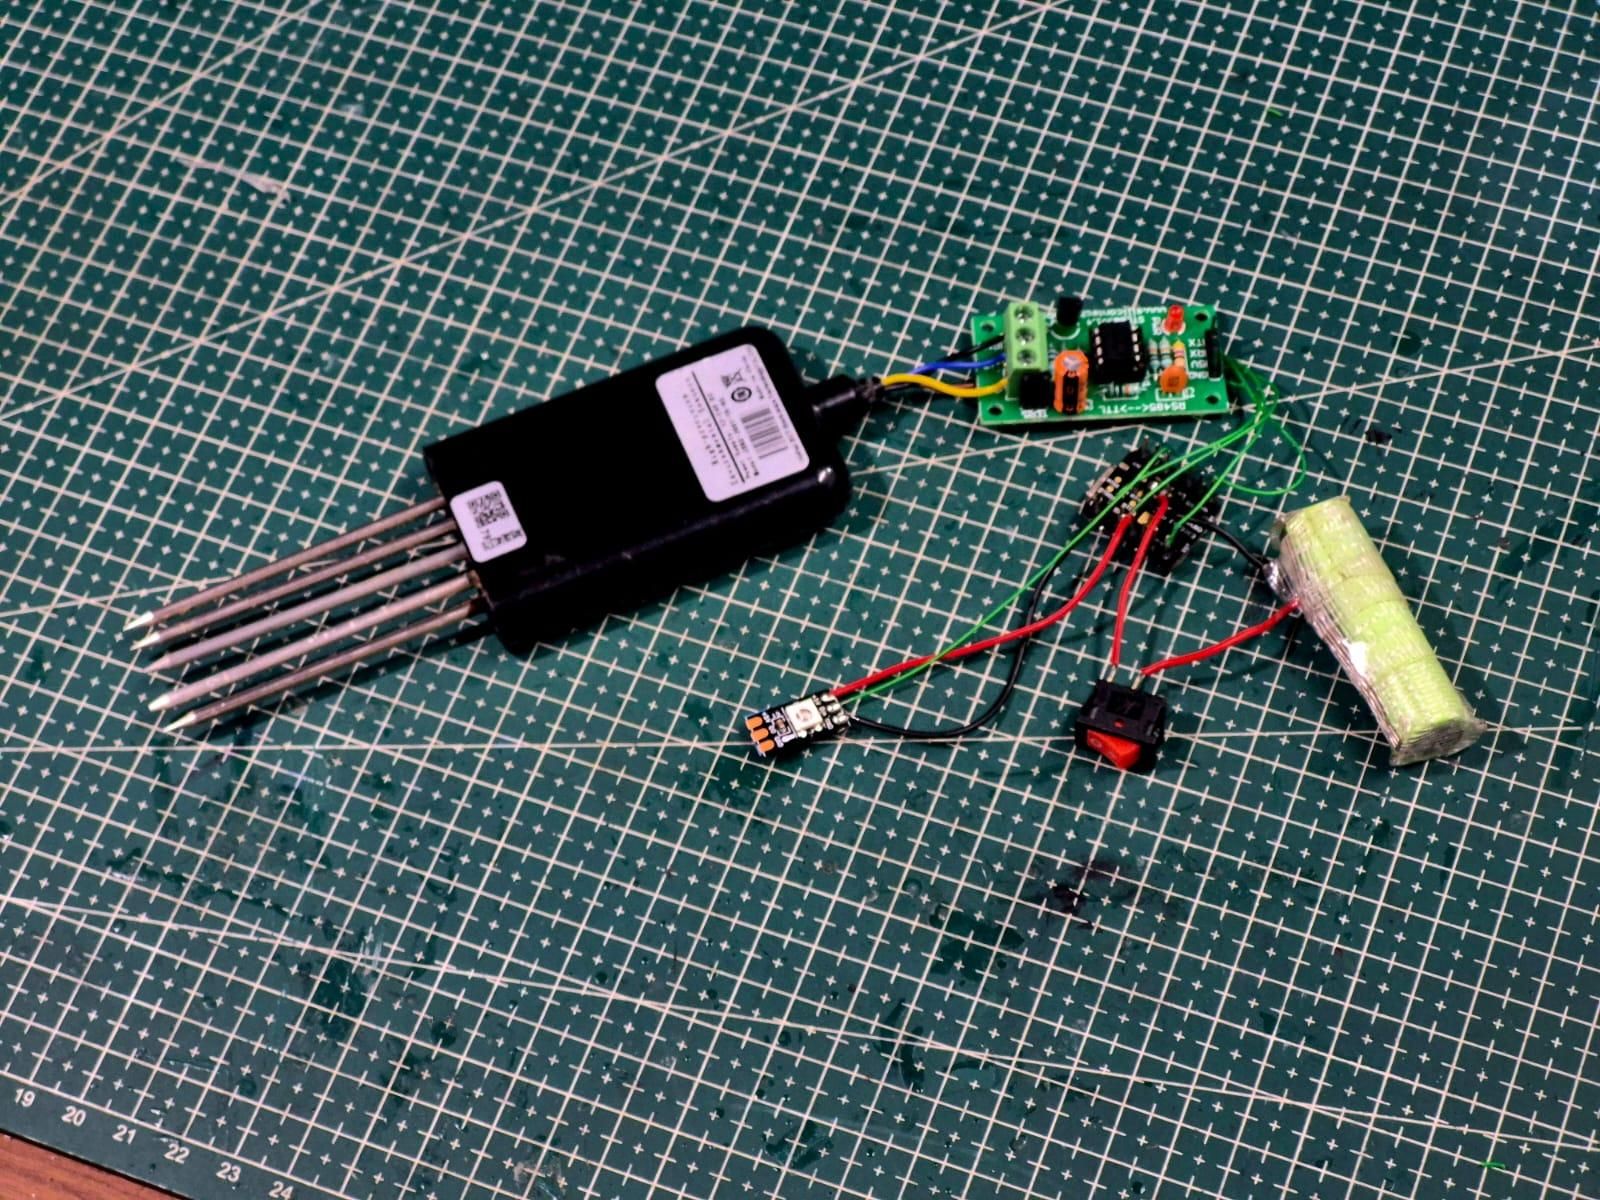
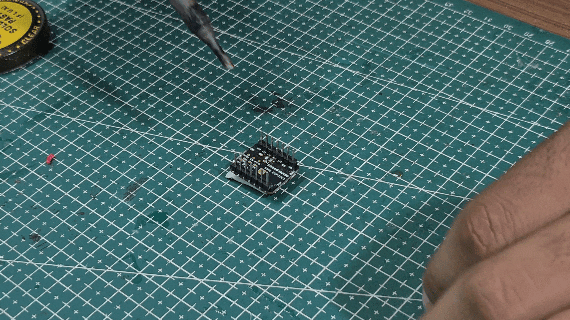
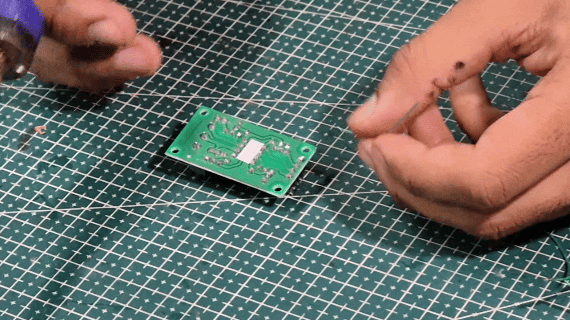
I used the following XIAO pin assignment:
XIAO to MAX485
MAX485 to Soil Sensor
If the sensor does not respond, swap A and B once. Different manufacturers occasionally label the pair in opposite ways.
WS2812 Connection
A 3.3V-to-5V logic-level converter is recommended on the WS2812 data line when the LED is powered from 5V.
Do not connect the positive output of a 9–24V sensor supply to the XIAO.
Final Assembly
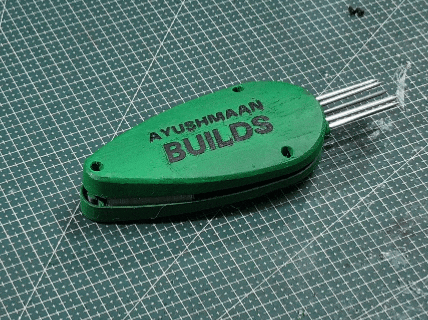
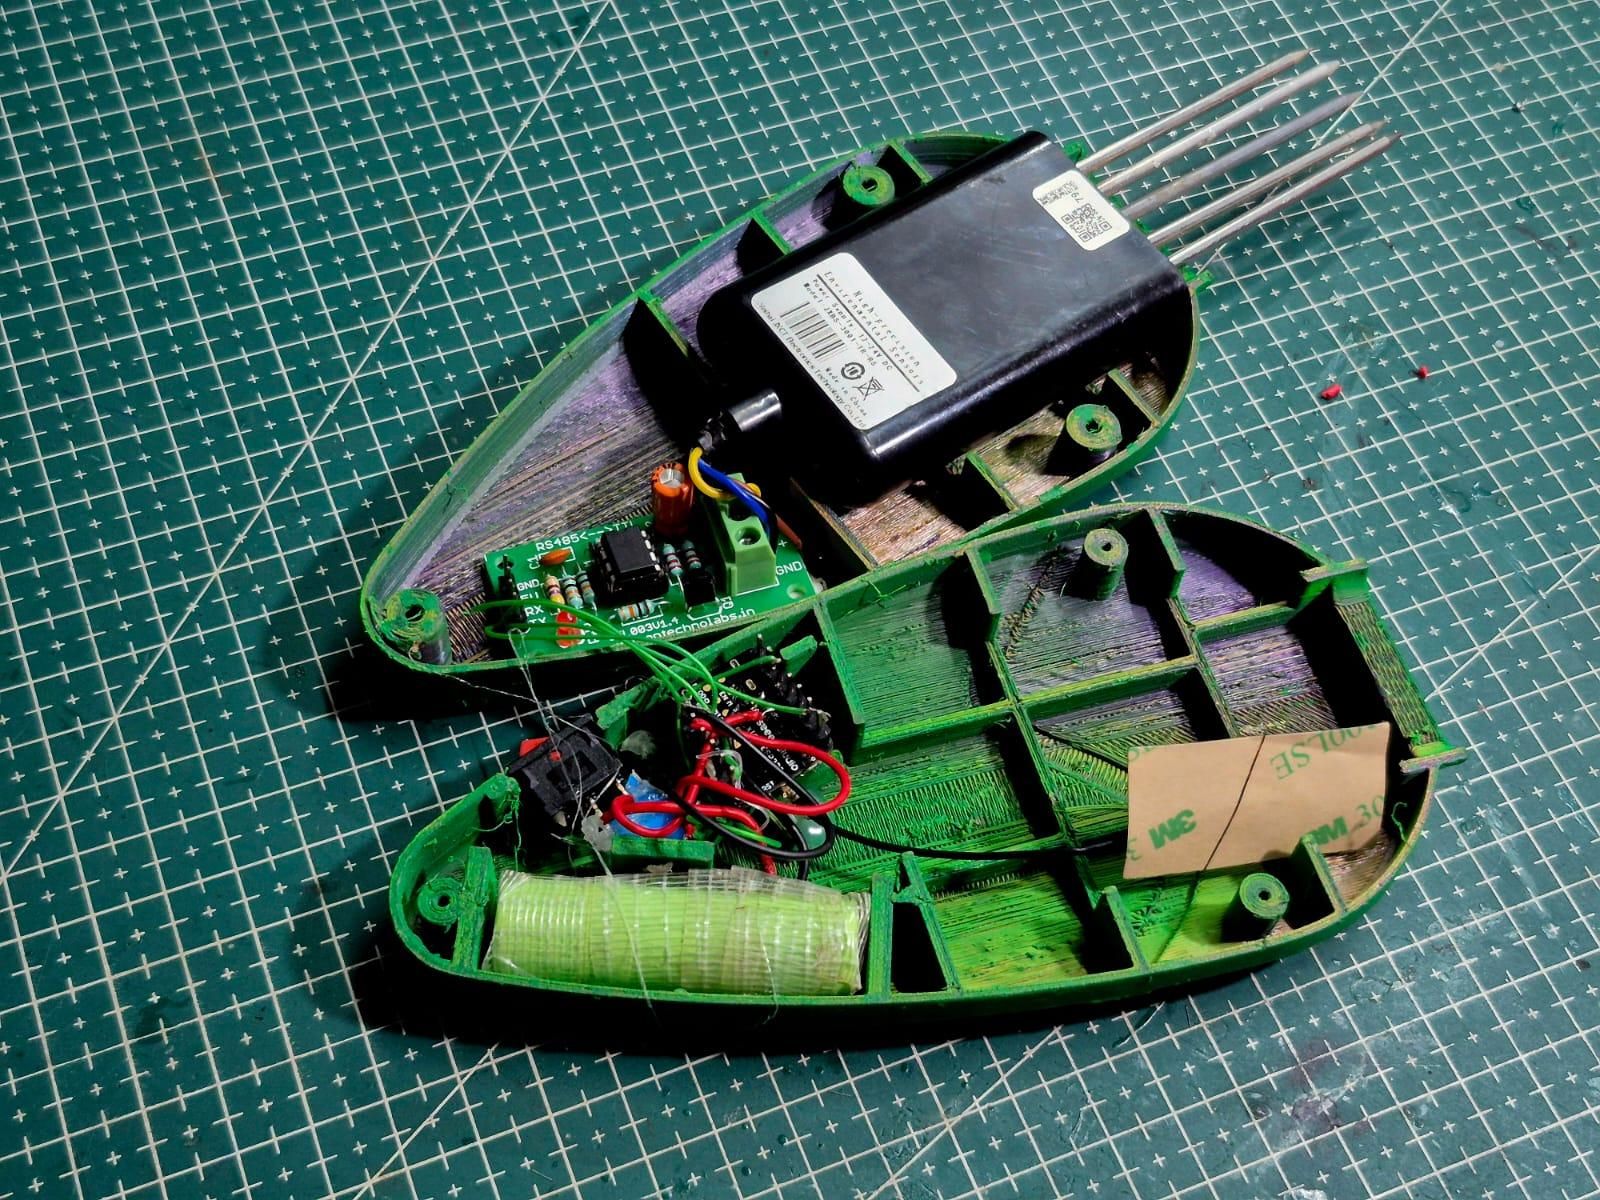
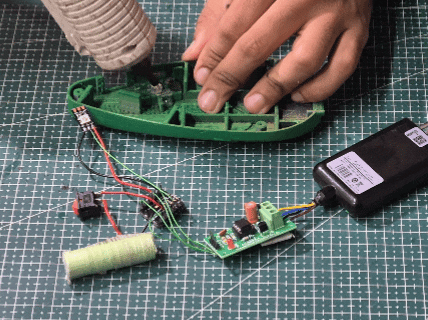
Once the painted parts were ready, I placed all the electronics inside the enclosure.
I positioned the XIAO ESP32-C6 and MAX485 so that the USB connection, sensor wiring and status LED remained accessible.
The wires were arranged away from the screw posts and the outer edges of the case.
This is important because a wire caught between the two halves can prevent the enclosure from closing properly or damage the insulation.
Before closing the case, I powered the circuit once and checked that the LED turned red and then green after Wi-Fi connected.
I also opened the ESP32 /data address in a browser to confirm that the electronics still worked after installation.
The two enclosure halves were then aligned and screwed together.
Using screws instead of glue means the case can be reopened if the sensor wiring, firmware or electronics need to be changed later.
After tightening the screws, I checked the seam around the enclosure and confirmed that no cables were being pinched.
Understanding the Dashboard
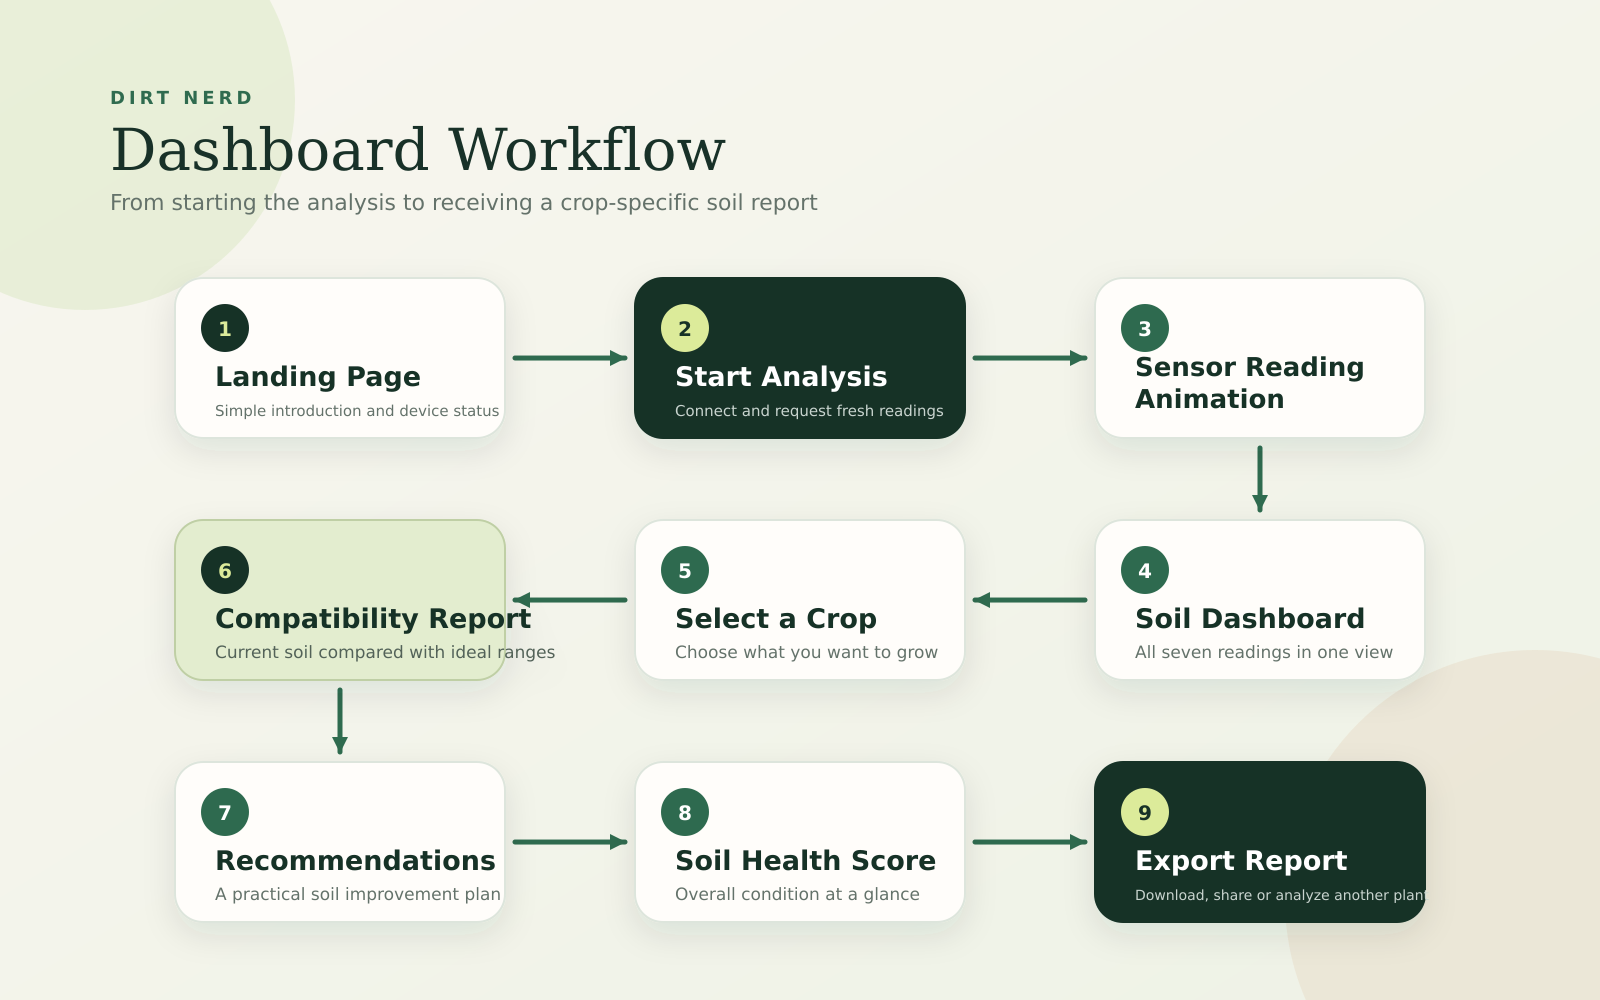
Before getting into the firmware and website code, I want to quickly walk through the dashboard from a user’s point of view.
The website is more than a page that displays sensor values. Its main job is to take the readings coming from the soil analyzer and explain whether that soil is suitable for a particular crop.
The complete interface follows this flow:
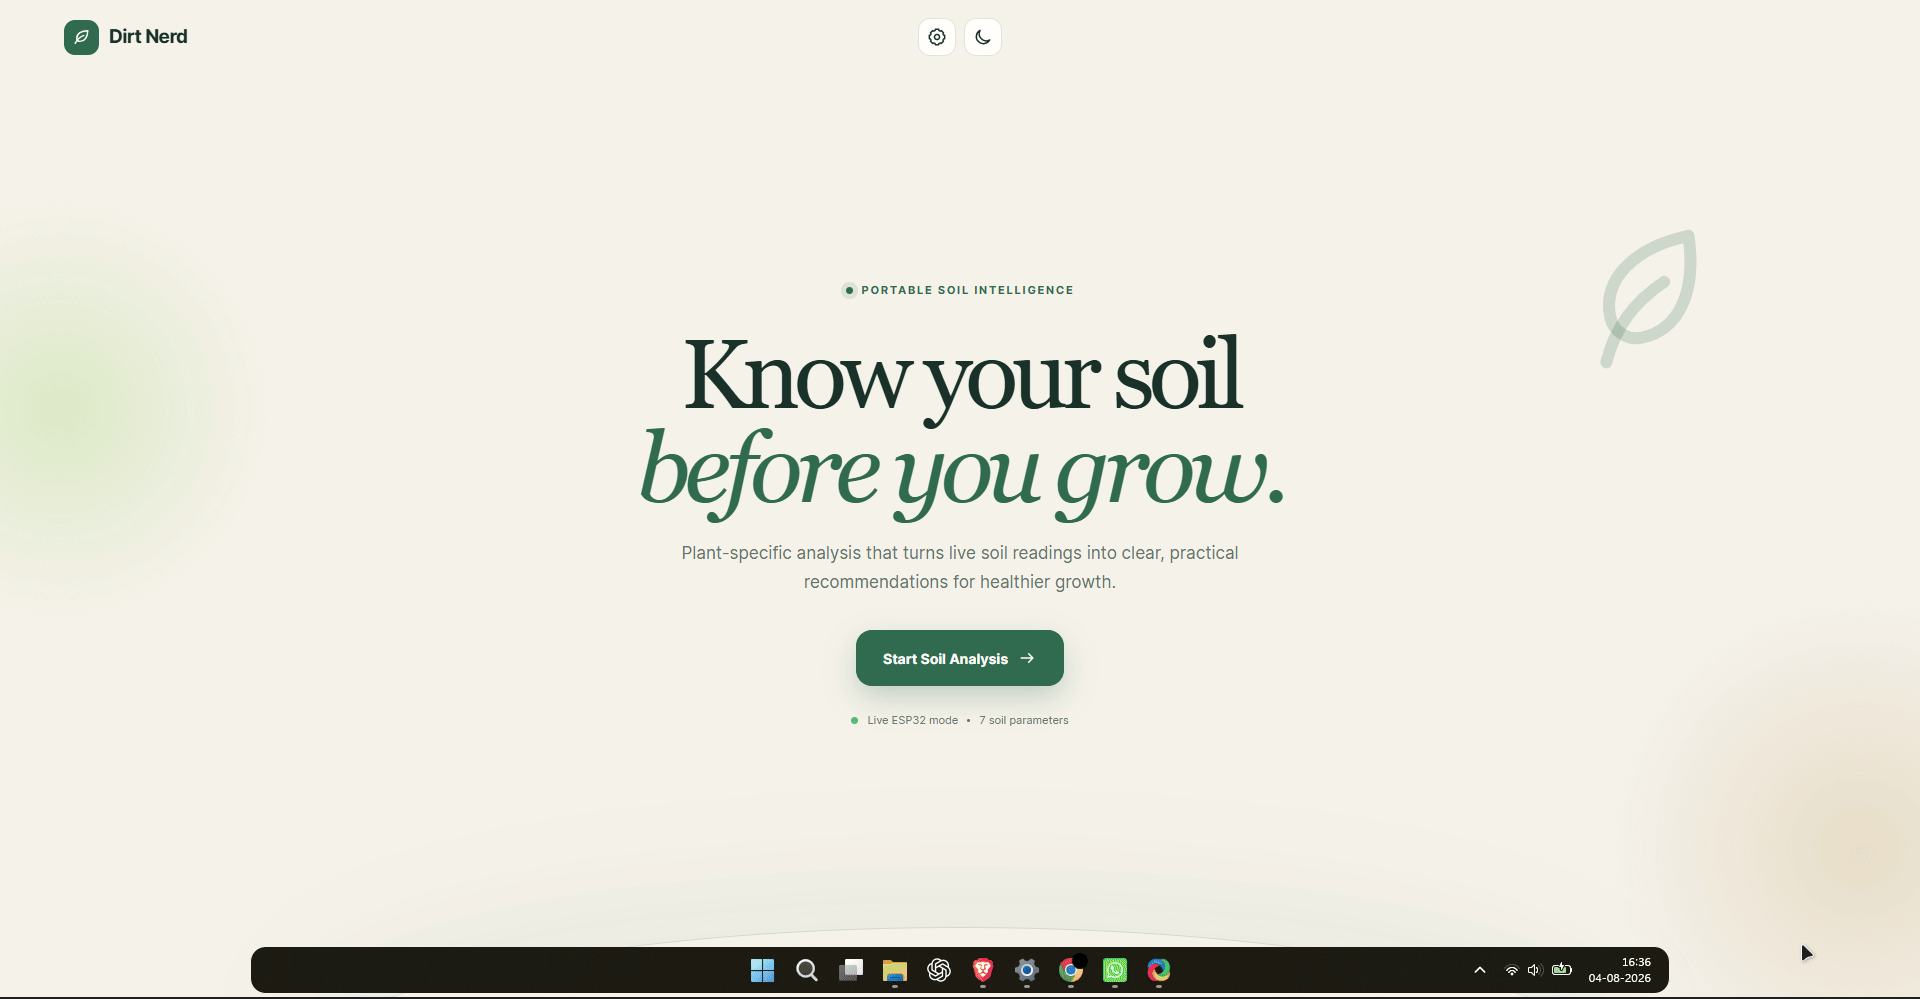
1. Landing Page
The website opens with a simple landing page containing the Dirt Nerd logo, project name and the main tagline:
Know your soil before you grow.
I deliberately kept this screen minimal. The user only sees a short description and the Start Soil Analysis button, rather than being immediately presented with a crowded dashboard.
The settings button can also be used to switch between Demo and Live modes. In Live mode, the IP address shown by the ESP32 in Serial Monitor is entered here.
2. Starting the Analysis
Pressing Start Soil Analysis begins the reading sequence.
In Live mode, the website first contacts the ESP32 using its local IP address. The ESP32 then returns the latest readings from the RS485 soil sensor.
Instead of immediately jumping to the results, I added a short analysis animation that moves through each measurement:
This makes the interaction feel closer to using an actual analyzer rather than simply opening another data page.
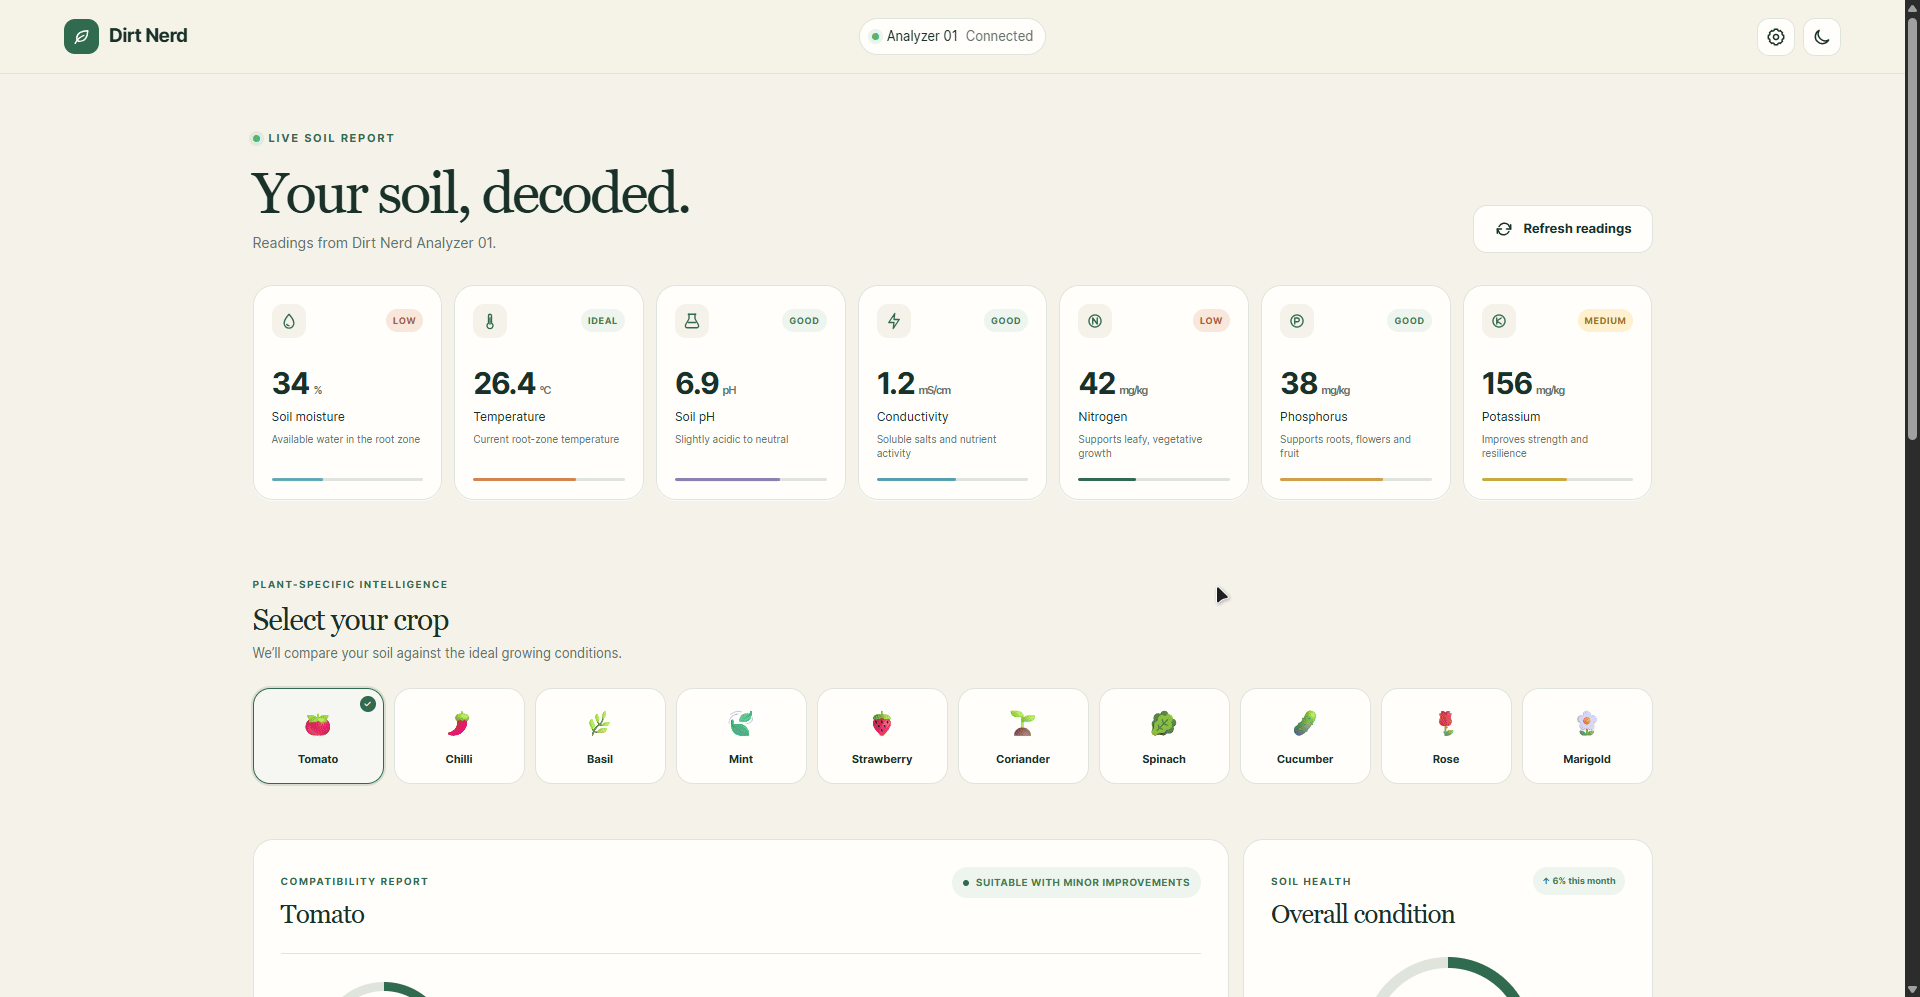
3. Sensor Dashboard
After the animation finishes, the main dashboard appears.
The first section displays all seven soil parameters:
- Soil moisture
- Soil temperature
- Soil pH
- Electrical conductivity
- Nitrogen
- Phosphorus
- Potassium
Each parameter has its own card containing the current value, unit, description and status.
For example, moisture may be marked as Low, while temperature may be shown as Ideal. This makes it possible to understand the general condition of the soil without studying every number individually.
A Refresh Readings button requests a new set of values from the ESP32.
4. Selecting a Crop
Raw soil readings do not mean much without context. A pH or moisture level that works for one plant may not be ideal for another.
Below the sensor cards, the user can select the crop they want to grow.
The available options include:
- Tomato
- Chilli
- Basil
- Mint
- Strawberry
- Coriander
- Spinach
- Cucumber
- Rose
- Marigold
Selecting a different crop updates the analysis automatically.
The sensor readings remain the same because the soil has not changed. What changes is the ideal range used to evaluate those readings.
5. Compatibility Report
The compatibility report compares the current soil against the preferred conditions of the selected crop.
It displays:
- Overall suitability percentage
- Compatibility status
- Current value for each parameter
- Ideal range for the selected crop
- Individual parameter status
A typical comparison looks like this:
This is where the dashboard starts turning sensor readings into something genuinely useful.
Instead of only telling the user that the soil contains a certain amount of nitrogen, it explains whether that amount is suitable for the plant they selected.
6. Soil Health Score
Alongside crop compatibility, the dashboard shows an overall soil health score using a circular progress indicator.
This score gives a general overview of the soil condition using factors such as:
- Soil structure
- Nutrient levels
- Water balance
- pH balance
Crop compatibility and soil health are shown separately because they answer different questions.
The compatibility score asks:
Is this soil suitable for the selected crop?
The soil health score asks:
What is the overall condition of this soil?
A soil sample can be reasonably healthy while still needing adjustments for a specific crop.
7. Recommendations
The recommendations section converts the report into a practical action plan.
Depending on the readings and selected crop, the dashboard may suggest actions such as:
- Adding compost or vermicompost
- Improving moisture consistency
- Increasing potassium before flowering
- Monitoring the pH after adding amendments
I wanted this part to be direct and easy to follow. The goal is not to overwhelm the user with agricultural data, but to explain what they can actually do with the result.
Each recommendation also includes a priority such as Priority, This Week, Before Flowering or Monitor.
8. Nutrient Visualization
The dashboard includes a bar chart for nitrogen, phosphorus, potassium and electrical conductivity.
This provides a quicker visual comparison than reading individual values from the cards.
When the selected crop changes, the rest of the analysis updates around that crop’s preferred soil conditions.
9. Saving and Sharing the Report
Once the analysis is complete, the user can:
- Export the readings as a JSON file
- Copy and share the report summary
- Download the report as a PDF
- Analyze another plant
The exported JSON is useful if the readings need to be stored or used in another project. The PDF option creates a more readable report that can be saved or printed.
10. Demo and Live Modes
The dashboard includes two data modes.
Demo Mode uses sample readings and is useful for exploring the interface without connecting the physical device.
Live Mode requests actual readings from the ESP32. The user enters the IP address displayed in Serial Monitor, tests the connection and then starts the analysis.
This made it possible to continue working on the website even when the complete sensor hardware was not connected, while keeping the same interface for the final device.
The dashboard is also responsive, so the same workflow can be used from a phone, tablet or computer connected to the same local network as the ESP32.
Now that the complete interface is clear, the next step is programming the XIAO ESP32-C6 to read the sensor and provide the data required by this dashboard.
Programming the ESP32
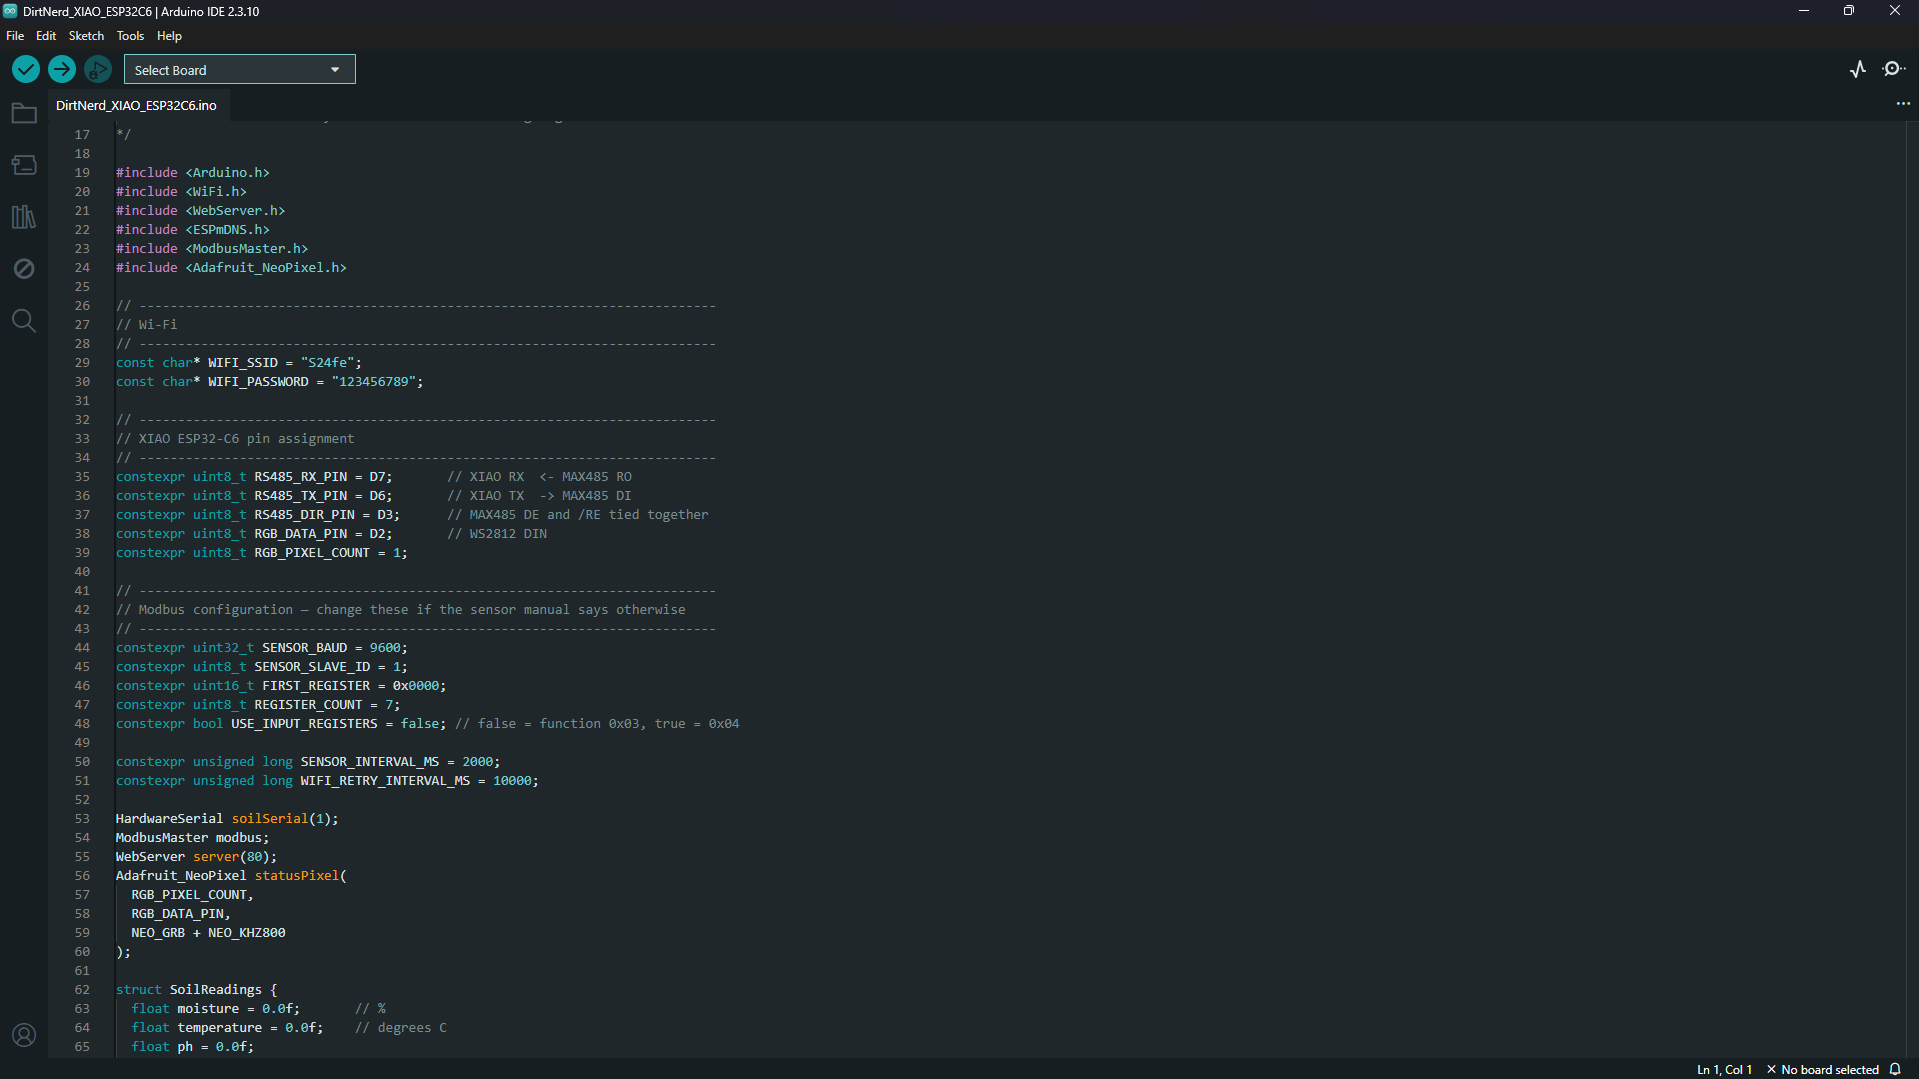
With the electronics assembled, the next step was programming the XIAO ESP32-C6.
The firmware has four main jobs:
- Read all seven soil parameters through Modbus RTU.
- Connect the device to Wi-Fi.
- Provide the readings as JSON through a local web server.
- Use the WS2812 LED to show the Wi-Fi status.
The complete firmware is attached with the project files, but I’ve broken down the important sections below.
1. Installing the Required Libraries
Before compiling the code, install these libraries through the Arduino IDE Library Manager:
- ModbusMaster by Doc Walker
- Adafruit NeoPixel by Adafruit
The Wi-Fi, WebServer and mDNS libraries are included with the ESP32 board package.
I used the following includes:
In Arduino IDE, select:
I used Serial Monitor at 115200 baud.
2. Wi-Fi and Pin Configuration
The Wi-Fi credentials are stored at the beginning of the sketch.
I have replaced mine with placeholders here, so enter the credentials of the network you want to use:
For the hardware connections, I used D6 and D7 as the UART pins, D3 to control the MAX485 direction and D2 for the WS2812.
The MAX485 DE and /RE pins are connected together and controlled using D3.
3. Modbus Configuration
My sensor uses Modbus RTU to send all seven readings.
The configuration is kept in one place so it can easily be changed if a different sensor uses another baud rate, slave address or register layout.
Setting USE_INPUT_REGISTERS to false makes the firmware use Modbus function 0x03, which reads holding registers.
If your sensor manual specifies function 0x04, change it to:
4. Creating the Main Objects
Next, I created separate objects for UART communication, Modbus, the web server and the WS2812.
The web server runs on port 80, so the readings can be accessed using the ESP32’s IP address without adding a separate port number.
5. Storing the Sensor Readings
Instead of keeping seven unrelated global variables, I stored everything inside one structure.
The valid value tells the web dashboard whether the sensor is responding, while modbusResult helps with debugging communication errors.
6. Wi-Fi Status LED
I wanted the device status to be understandable without opening Serial Monitor.
The RGB LED remains red while the ESP32 is disconnected and turns green after it connects to Wi-Fi.
I kept the brightness fairly low because the LED only needs to work as an indicator.
7. Controlling the MAX485
RS485 is half-duplex, which means the MAX485 cannot transmit and receive at the same time.
Before sending a Modbus request, the firmware enables transmission. As soon as the request is sent, it switches the module back into receive mode.
These functions are registered with the Modbus library during setup:
Without this direction control, the ESP32 may send the request correctly but never receive the sensor’s response.
8. Reading the Seven Soil Parameters
The firmware requests seven consecutive registers beginning at address 0x0000.
If the request fails, I mark the data as invalid and print the Modbus result in Serial Monitor.
If the request succeeds, the response buffer contains all seven measurements.
The raw values then have to be converted into their actual units.
The register order used here is:
Finally, I print the values to Serial Monitor. This made it easier to test the electronics before involving the website.
Different versions of these sensors sometimes use different registers or scaling. If the sensor responds but the readings appear in the wrong order, this is the section that needs to be adjusted according to its Modbus manual.
9. Converting the Readings to JSON
The website needs a predictable format, so I convert the readings into a JSON object.
A normal response looks like this:
The website mainly uses the first seven values. The remaining fields are useful for checking the device and diagnosing connection problems.
10. Allowing the Website to Request Data
Because the website runs on the computer while the API runs on the ESP32, the browser treats them as separate origins.
I added CORS headers so the localhost dashboard is allowed to request the sensor data.
The no-store header prevents the browser from showing an older cached reading.
11. Creating the /data Endpoint
The main endpoint used by Dirt Nerd is /data.
I also added a smaller /health endpoint for checking whether the ESP32 and sensor are responding.
The endpoints are registered when the server starts:
I also included a small diagnostic page at /. This lets me open the ESP32’s IP directly in a browser and check the sensor without starting the full Dirt Nerd dashboard.
12. Connecting to Wi-Fi
During startup, the RGB LED remains red while the ESP32 tries to connect.
After connecting, the LED turns green and the IP address is printed in Serial Monitor.
The numeric IP is the address entered into the Dirt Nerd website.
13. Automatic Wi-Fi Reconnection
I didn’t want the device to require a reset whenever the router or hotspot temporarily disconnected.
This function also keeps the RGB status accurate after startup.
14. Setup
The setup() function initializes the status LED, MAX485, UART, Modbus connection, Wi-Fi and web server.
15. Main Loop
The main loop stays fairly small.
The ESP32 reads the sensor every two seconds while also responding to browser requests and monitoring the Wi-Fi connection.
Once the firmware is uploaded, open Serial Monitor at 115200 baud. After the RGB LED turns green, copy the IP address shown in the terminal.
The sensor data should then be available at:
At this point, the hardware is producing structured data over the local network. In the website step, I’ll show how Dirt Nerd requests this endpoint and turns those raw readings into the dashboard, crop comparison and recommendations.
Making the Webpage

I built the Dirt Nerd website using Next.js, React, TypeScript and CSS. My main goal was to keep the interface simple enough to use beside a plant while still displaying all the information collected by the sensor.
The website supports two operating modes:
- Demo mode uses editable sample readings.
- Live mode requests actual readings from the ESP32.
The main project files are:
The complete website is attached to this step as a ZIP file. The following sections explain the most important parts of the code.
Storing the Sensor Data
I kept the sensor readings in a separate sensor-data.ts file. This allows the same dashboard components to work with both sample values and data received from the ESP32.
When the website receives live data, it only replaces the values inside this object. The rest of the interface does not need to know whether the readings came from Demo mode or the physical sensor.
Managing the Website State
The main page keeps track of the current screen, selected crop, operating mode, ESP32 address and sensor readings.
The screen value switches the interface between the landing page, analysis animation and final dashboard.
Saving the Device Settings
The selected operating mode and ESP32 address are stored in the browser. This prevents the user from having to enter the address again after every refresh.
The settings are saved using:
Adding Custom Demo Readings
Demo mode includes input fields for all seven soil parameters. These were especially useful while designing the dashboard because I could test different values without connecting the physical sensor every time.
The following function updates one reading while keeping the remaining data unchanged:
These custom fields are only displayed in Demo mode. In Live mode, the values come directly from the ESP32.
Preparing the ESP32 Address
The user only needs to enter the numeric address displayed in the Serial Monitor.
For example:
The website automatically converts it into:
This is handled using the following function:
This also prevents /data from being added twice if the complete endpoint has already been entered.
Receiving Data From the ESP32
In Live mode, the website sends an HTTP request to the ESP32 and waits for a JSON response.
The ESP32 returns data in the following format:
The website uses the first seven fields for the dashboard. The connection fields are mainly useful while testing and diagnosing the device.
Starting the Analysis
The same analysis button works in both modes.
In Demo mode, the website immediately begins the animation using the custom values. In Live mode, it first checks the ESP32 connection and downloads a fresh set of readings.
Creating the Reading Animation
The animation follows the actual measurements performed by the soil sensor.
A timer moves through the list before opening the dashboard:
This animation does not delay the actual sensor communication. In Live mode, the data is requested first, and the animation then provides clear feedback while the report is being prepared.
Updating the Crop Report
The selected crop is stored in a state variable:
When a crop button is pressed, the website changes that value:
The compatibility percentage, ideal ranges, status message and recommendations all read from the selected crop object. React then updates the report automatically without reloading the page.
For the current prototype, the crop profiles are stored locally. This keeps the website usable without an external plant database or internet connection.
Exporting the Data
The Export Data button creates a JSON file containing the operating mode, readings and selected crop.
For the PDF button, I used the browser’s print dialog:
The user can select Save as PDF from the print window. A separate print stylesheet hides navigation buttons and other unnecessary controls.
Mobile Optimization
The desktop version displays all seven readings across the page. On tablets, the layout changes to four columns.
On phones, each reading becomes a compact horizontal card:
The crop selector becomes horizontally scrollable:
The settings panel also becomes a bottom sheet, which is easier to use with one hand:
Running the Website
After extracting the attached website ZIP, open a terminal inside the project folder and install the dependencies:
Start the local development server:
The website will normally open at:
To use Live mode, the computer and ESP32 must be connected to the same Wi-Fi network. Open Settings, select Live mode, enter the numeric ESP32 address and press Test.
I currently run the interface through localhost when connecting directly to the analyzer. A Vercel deployment uses HTTPS, while the ESP32 provides a local HTTP endpoint, and some browsers block that combination. Localhost avoids this problem and is the most reliable setup for the current version.
Problems Faced
Understanding the Sensor Registers
The biggest electronics challenge was that 7-in-1 RS485 sensors do not all use exactly the same register order or scaling.
A sensor may return a valid Modbus response while still placing pH, EC or NPK values in different registers from the layout used in the code.
The solution was to keep the register addresses and scaling in one function so they could be changed after checking the sensor manual.
RS485 A and B Labelling
RS485 A and B labels are not always consistent between manufacturers.
If the wiring and settings look correct but the sensor does not respond, swapping A and B once is a useful test.
Logic-Level Difference
The XIAO uses 3.3V GPIO, while a traditional MAX485 module normally operates at 5V.
Connecting its RO output directly to the ESP32 could damage the input. I accounted for this with level shifting instead of assuming the modules were electrically compatible.
Changing IP Address
The ESP32’s local IP can change when the router reconnects.
This means an address saved in the website may eventually stop working even though the device is connected.
The Test button helps identify this quickly. A DHCP reservation in the router can also keep the address fixed.
Local HTTP and Vercel HTTPS
The website works well on Vercel as a demo, but direct ESP32 communication is more complicated.
Vercel uses HTTPS while the ESP32 serves an HTTP address inside the local network. Browsers may block an HTTPS page from requesting that insecure local endpoint.
For the current build, running the website on localhost is the most reliable solution.
Mobile Dashboard Layout
The original desktop-style cards became too narrow on a phone.
Instead of only reducing the font size, I changed the sensor cards into compact horizontal rows and made the crop selector horizontally scrollable.
This preserved readability and made the controls easier to use outdoors.
Enclosure Clearance
The curved enclosure left less room near the edges than expected.
I had to pay attention to the screw posts, USB connector and cable bends while arranging the electronics.
Tri-Colour PLA Finish
The tri-colour filament did not produce the appearance I expected.
Rather than discarding the print, I sanded and painted it. The green finish ended up matching the project much better.
Testing the Device
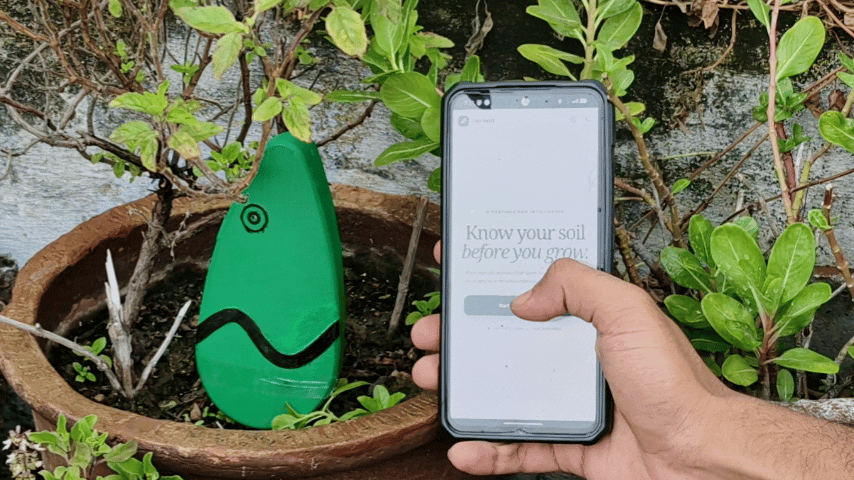
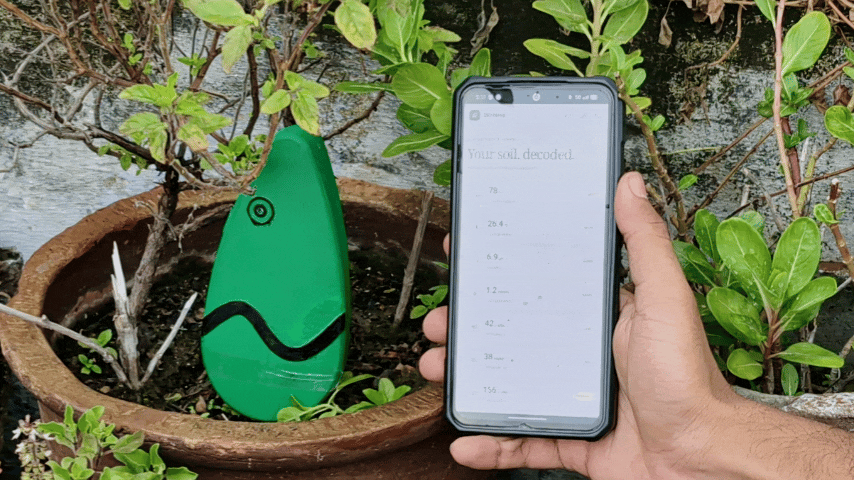
I divided testing into communication, sensor response and website testing.
First, I powered the device without opening the dashboard.
The WS2812 started red and changed to green after the ESP32 connected to Wi-Fi.
I opened Serial Monitor at 115200 baud and confirmed that the board printed its local IP address.
I then opened the following address in a browser:
This confirmed that the ESP32 was returning JSON and that all seven measurement fields were present.
Next, I placed the probe into soil and watched whether the readings changed in a sensible direction when the soil condition changed.
The main purpose of this stage was to find obviously incorrect register mapping, scaling or communication errors rather than to claim laboratory accuracy.
I then started the website on localhost, selected Live mode and entered the same IP address.
The Test button confirmed the connection, and starting an analysis transferred the readings to the dashboard cards.
I changed between the available crops to check that the compatibility message, comparison table and recommendations updated without reloading the page.
I also tested the interface at desktop and phone widths.
The sensor cards changed into mobile rows, the crop options became horizontally scrollable and the Settings window opened as a bottom sheet.
Finally, I tested the Export Data, Share Report and Download PDF controls.
The soil sensor still needs to be calibrated according to its manufacturer’s procedure before the values should be treated as agronomically accurate.
For a more formal comparison, the next stage would be to test several documented soil samples and compare Dirt Nerd’s readings with calibrated reference instruments or laboratory results.
Final Thoughts
.jpg)
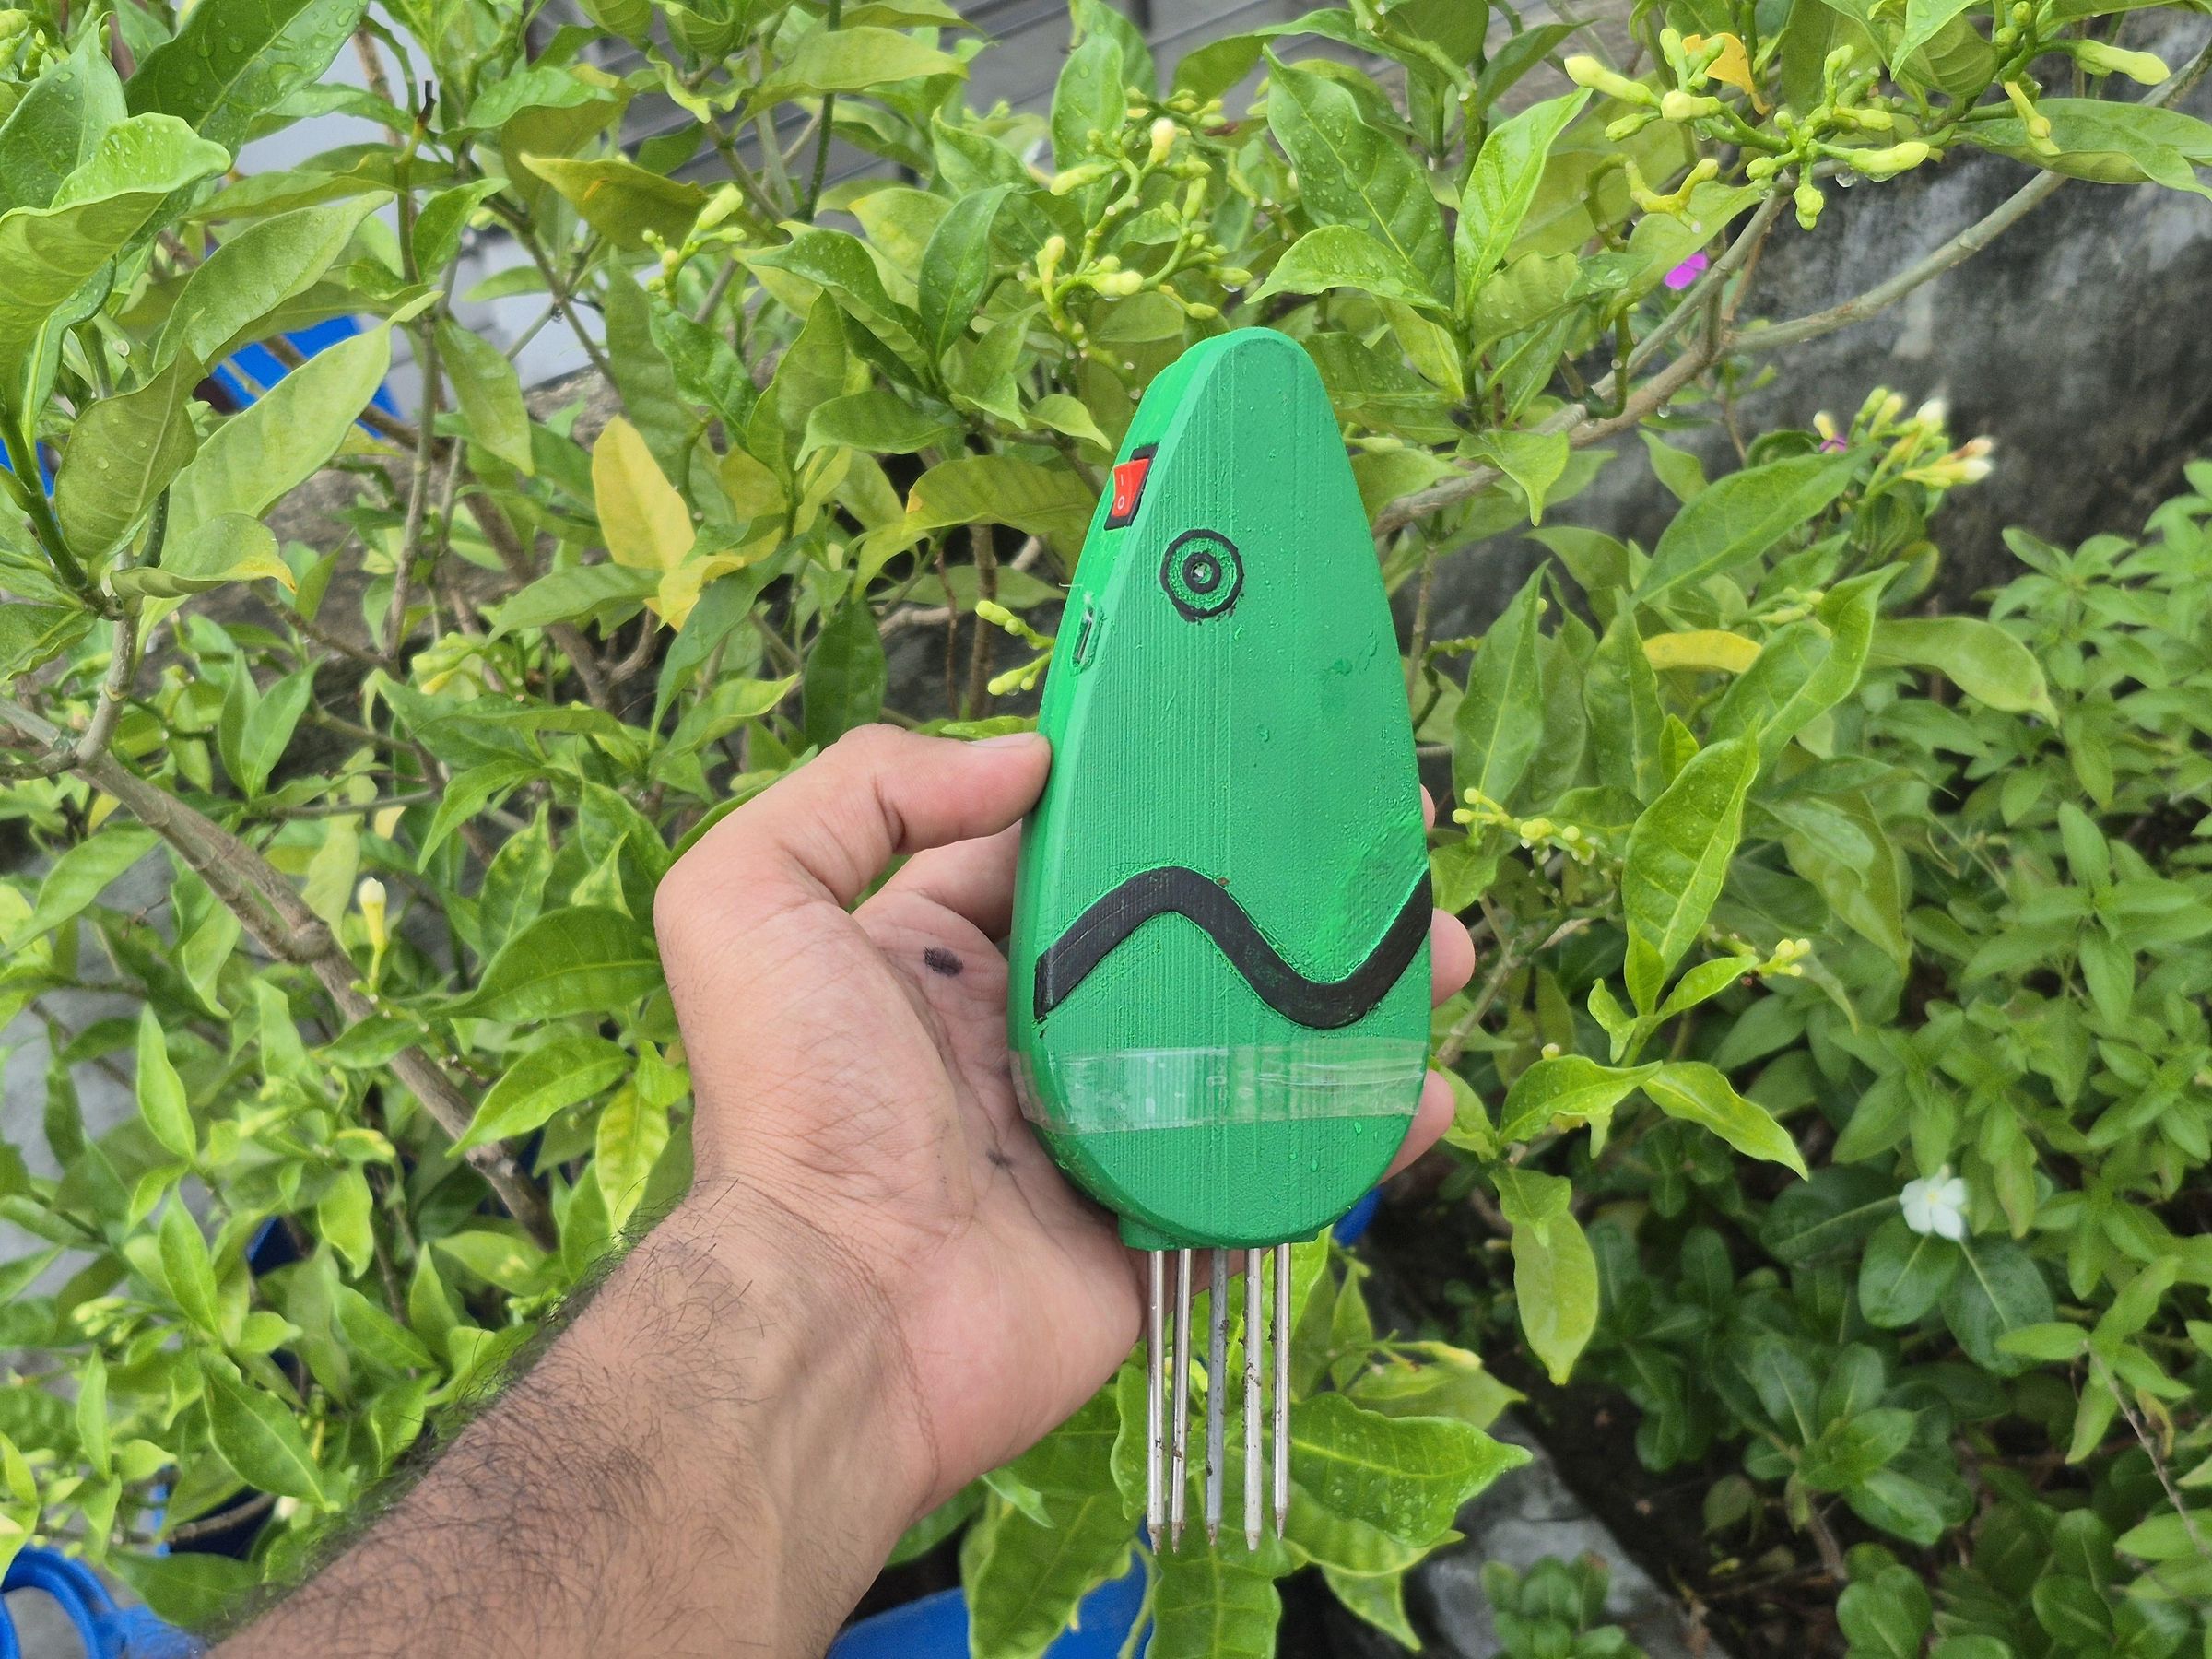
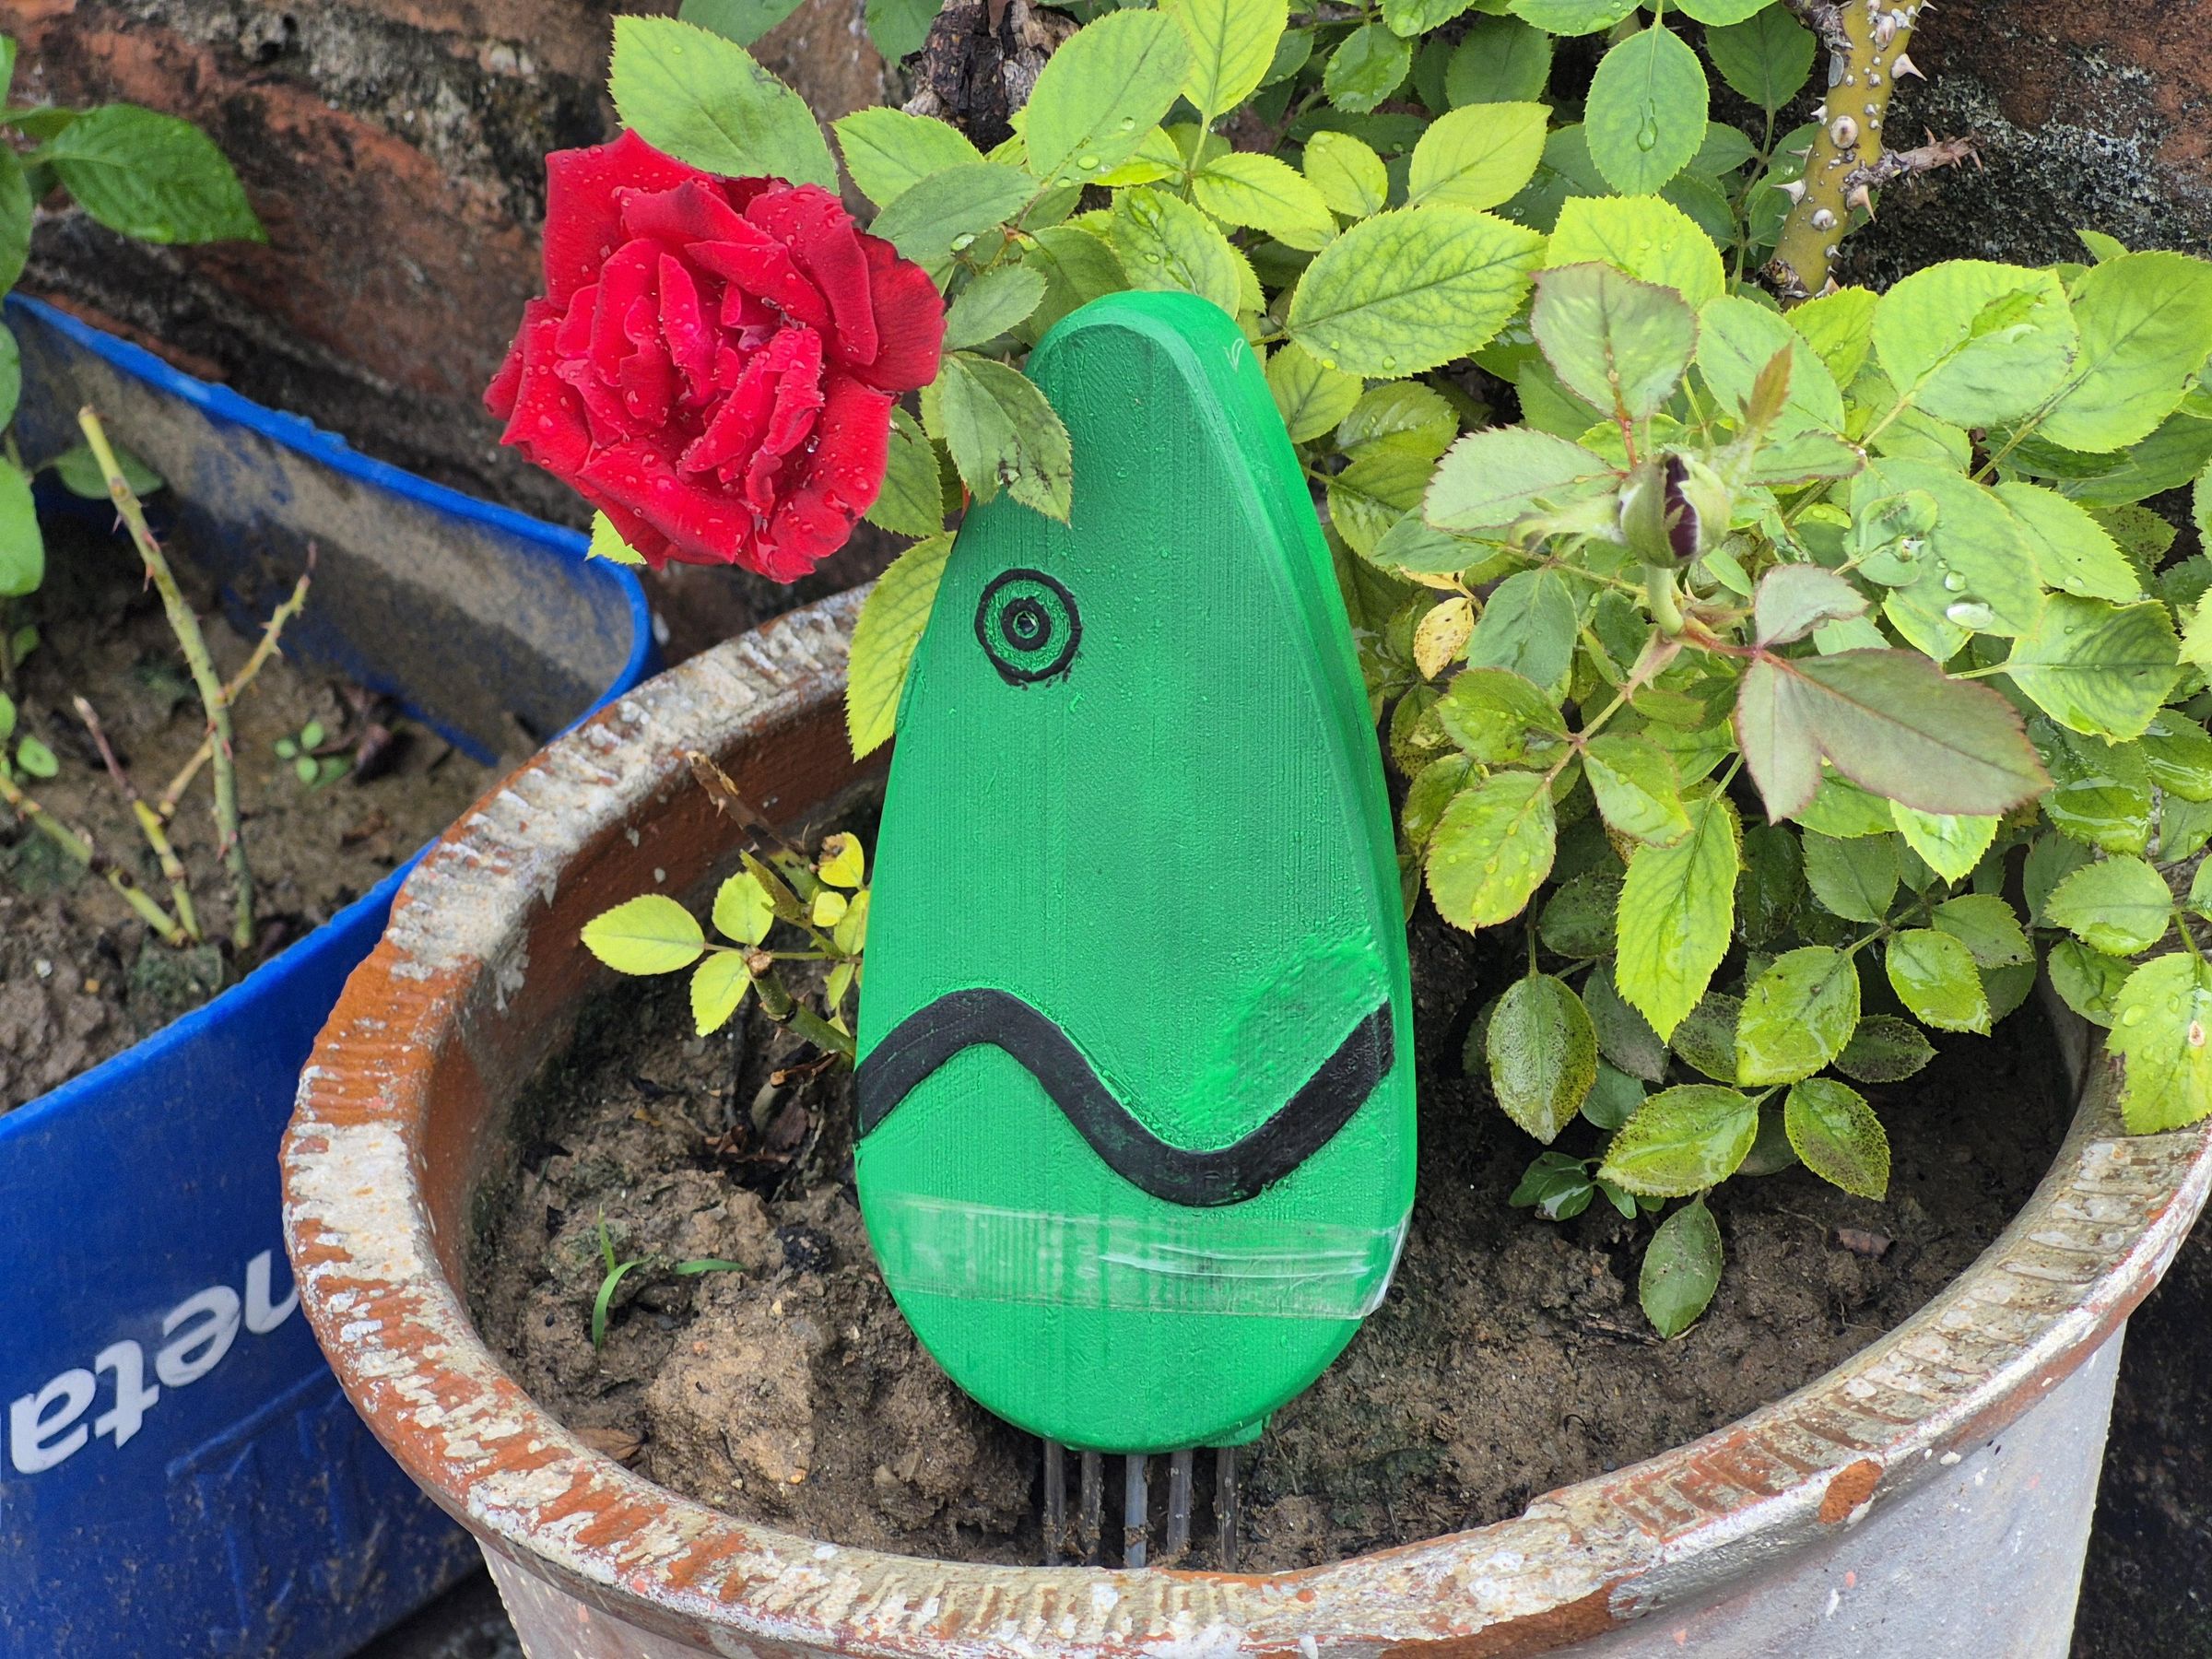
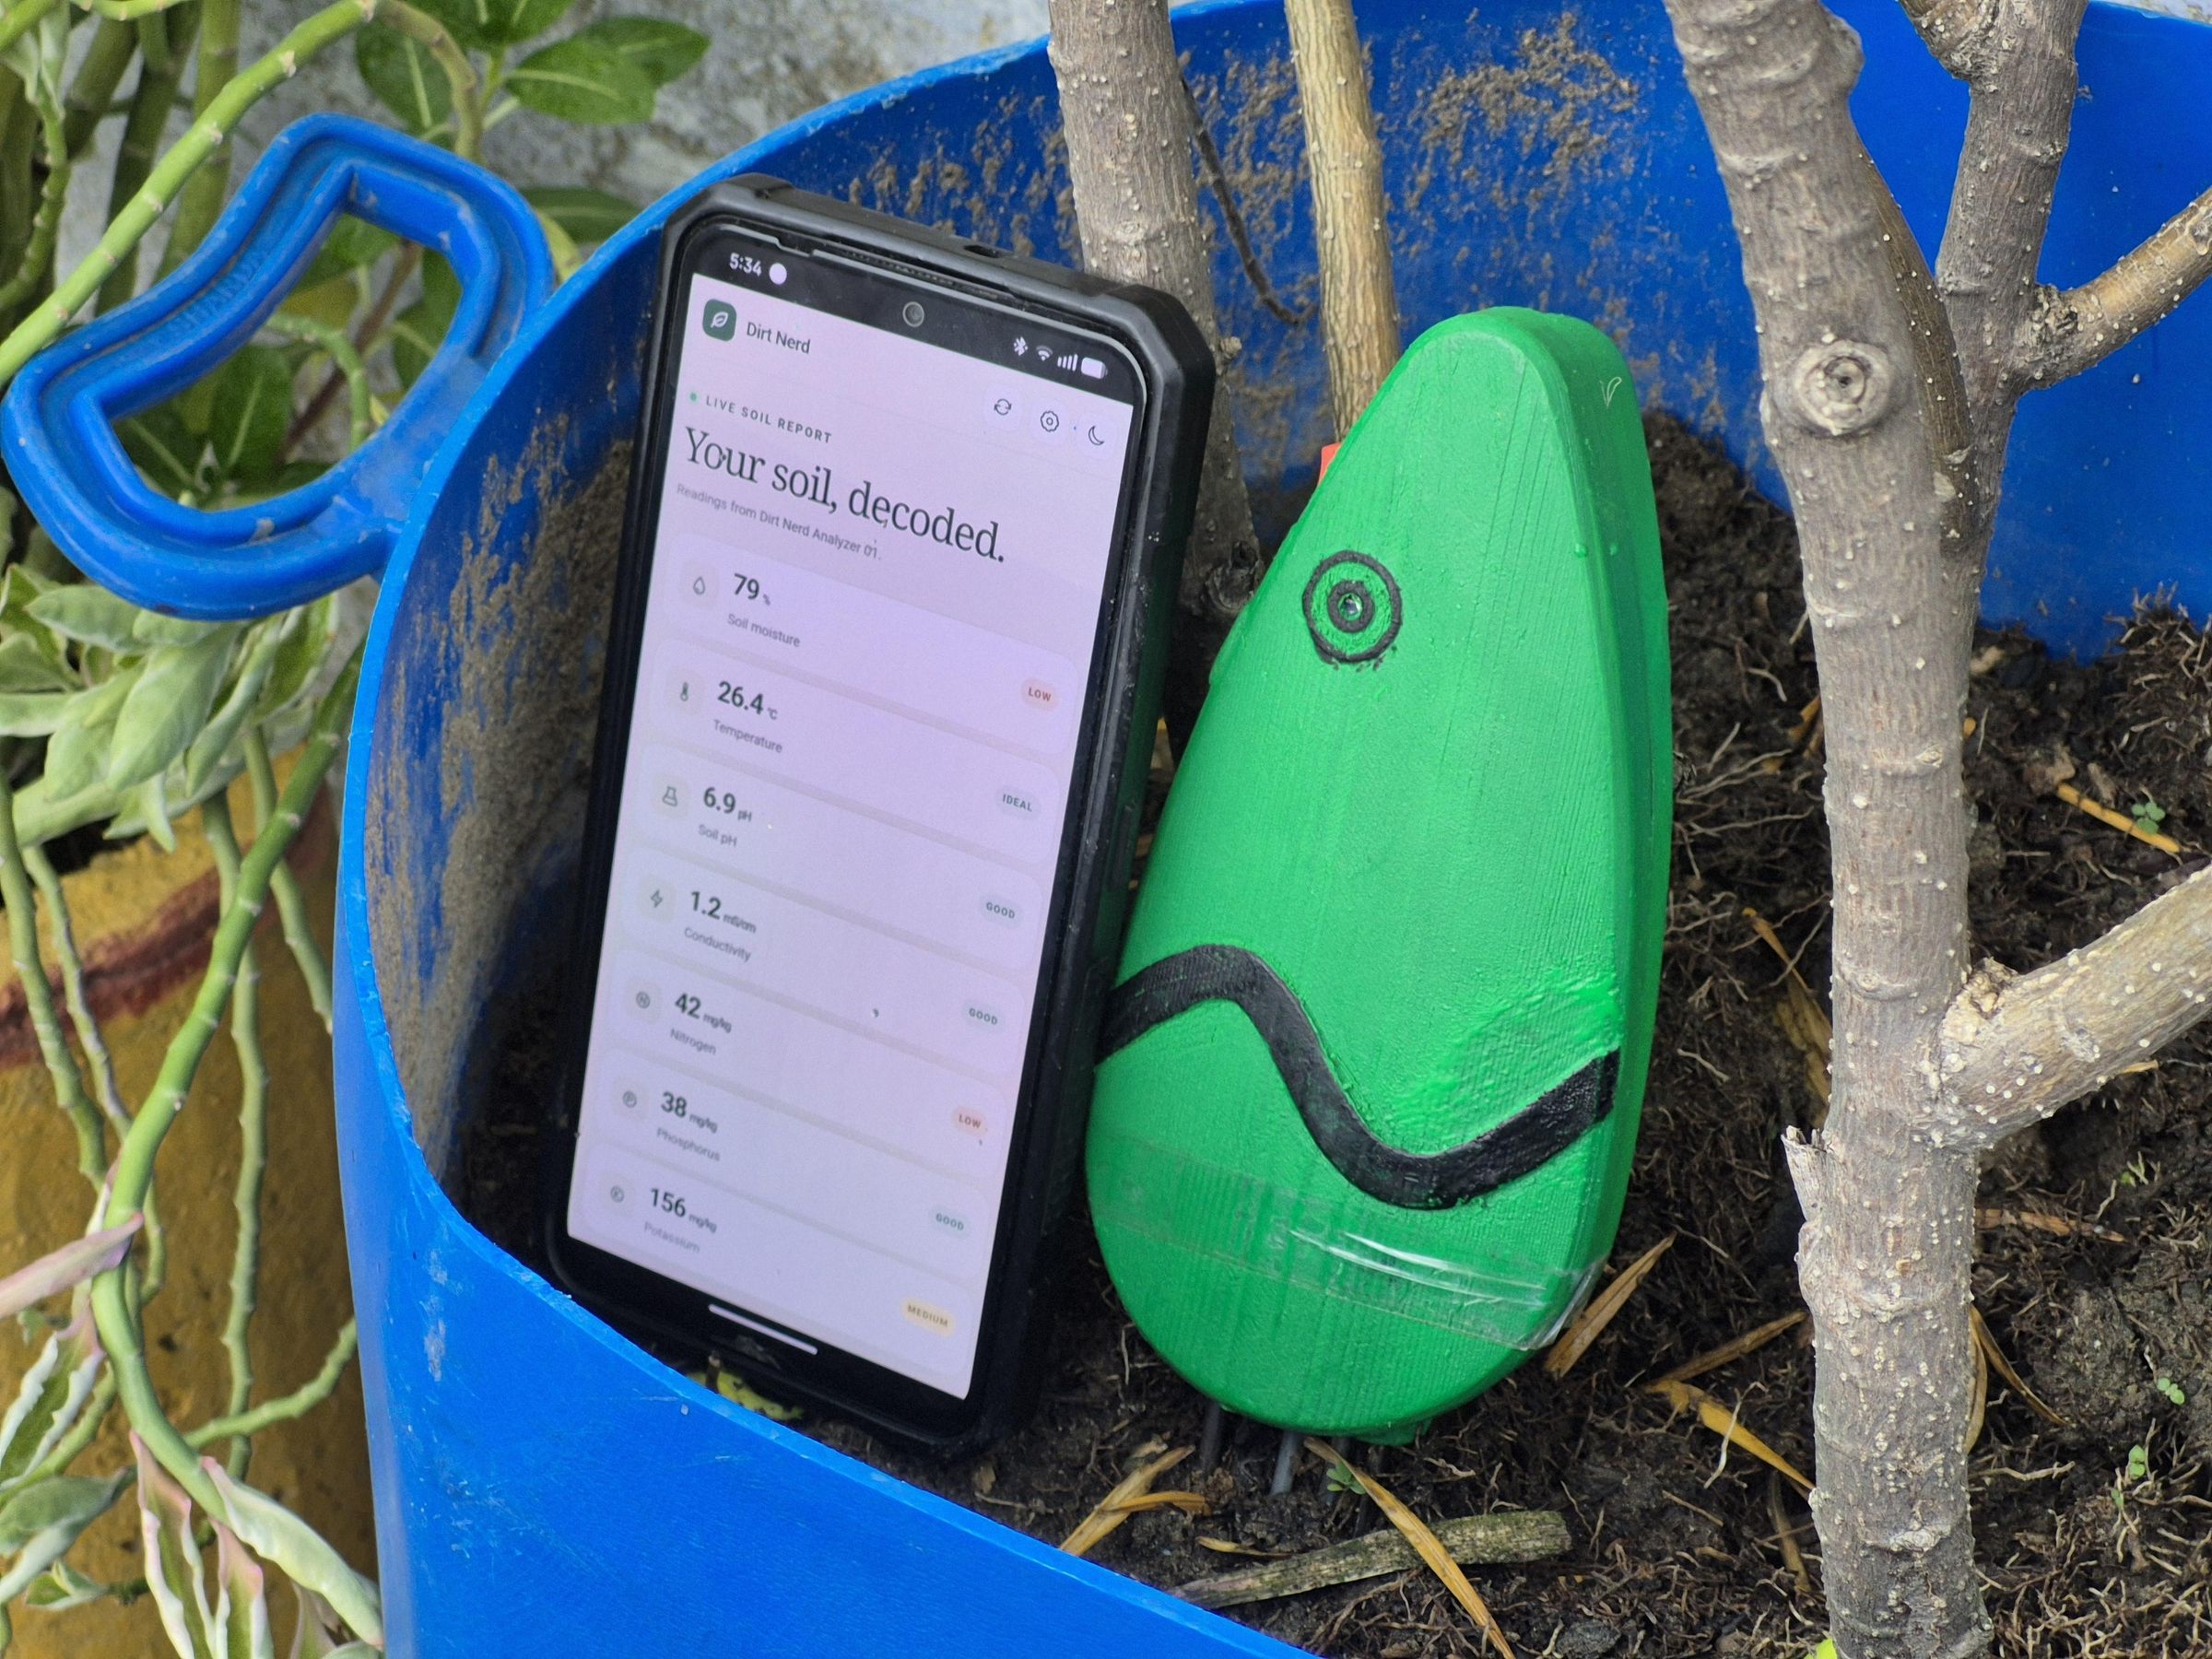
Dirt Nerd ended up being much more than a sensor connected to an ESP32.
The part I enjoyed most was bringing the electronics, firmware, interface and enclosure together into one product-like prototype.
The project also taught me that displaying a measurement is only half the job. The information becomes much more useful when the user can understand what it means for the plant they want to grow.
I learned a lot about RS485 communication, Modbus registers, voltage-level differences, local HTTP APIs and responsive interface design.
The enclosure also went through its own unexpected design journey. It did not remain the clean water-droplet shape I first imagined, but the slightly squid-like final form made the project more recognisable.
There are several things I would improve in a future version.
I would calibrate the sensor against reliable reference measurements, expand the crop database, calculate every comparison directly from live readings and add a better method for Wi-Fi setup without storing credentials in the firmware.
For remote access, I would also replace the direct local HTTP connection with a secure MQTT or cloud-based data path.
I would like to make the internal electronics mounting more organised and possibly add a rechargeable battery so the analyzer can be used without a separate power cable.
For now, Dirt Nerd works as a complete prototype that can measure soil, display the results and turn them into a more understandable plant-specific report.
If you build your own version, check the manual for your exact soil sensor, keep the voltage levels safe and treat the first set of readings as the beginning of calibration rather than the final answer.
Thanks for reading, and I hope this project gives you a useful starting point for building your own connected soil analyzer.