HYDR8: a Wearable That Knows When It's Time to Hydrate
by ayushmaan45 in Circuits > Wearables
718 Views, 5 Favorites, 0 Comments
HYDR8: a Wearable That Knows When It's Time to Hydrate
Hi, I'm Ayushmaan. I'm an Electrical and Electronics Engineering student, and most of my free time goes into building things that probably didn't need to exist.
This one started with a stupid problem. I'd sit down to work, get into it, and look up four hours later with a headache and a full water bottle right next to me. Untouched. Same thing on my cycle. Same thing standing outside in May, when Haridwar reminds everyone what it's capable of.
I tried the obvious fix. Phone reminder, every 30 minutes. It lasted two days before I started swiping it away without reading it, because it was wrong most of the time. Buzzing at me in a fan-cooled room is annoying. On the days it actually mattered, 30 minutes was far too long anyway.
The reminder had no idea what I was doing. Sitting still or climbing a hill, 22°C or 40°C, heart at 70 or 130 — it only knew that 30 minutes had passed. Which is the one piece of information that matters least.
And this isn't a small problem here. In 2024, India's warmest year on record since 1901, the NCDC logged nearly 48,000 heatstroke cases and 159 confirmed deaths. A separate analysis by the non-profit HeatWatch counted 733 heatstroke deaths that year from news reports alone, and different government agencies report wildly different totals for the same period. Nobody really knows the number. Everyone agrees it's higher than what gets counted, and that most of it was preventable. deccanherald
So I started wondering: what if a wearable looked at what was happening to your body and the air around you, instead of just counting minutes?
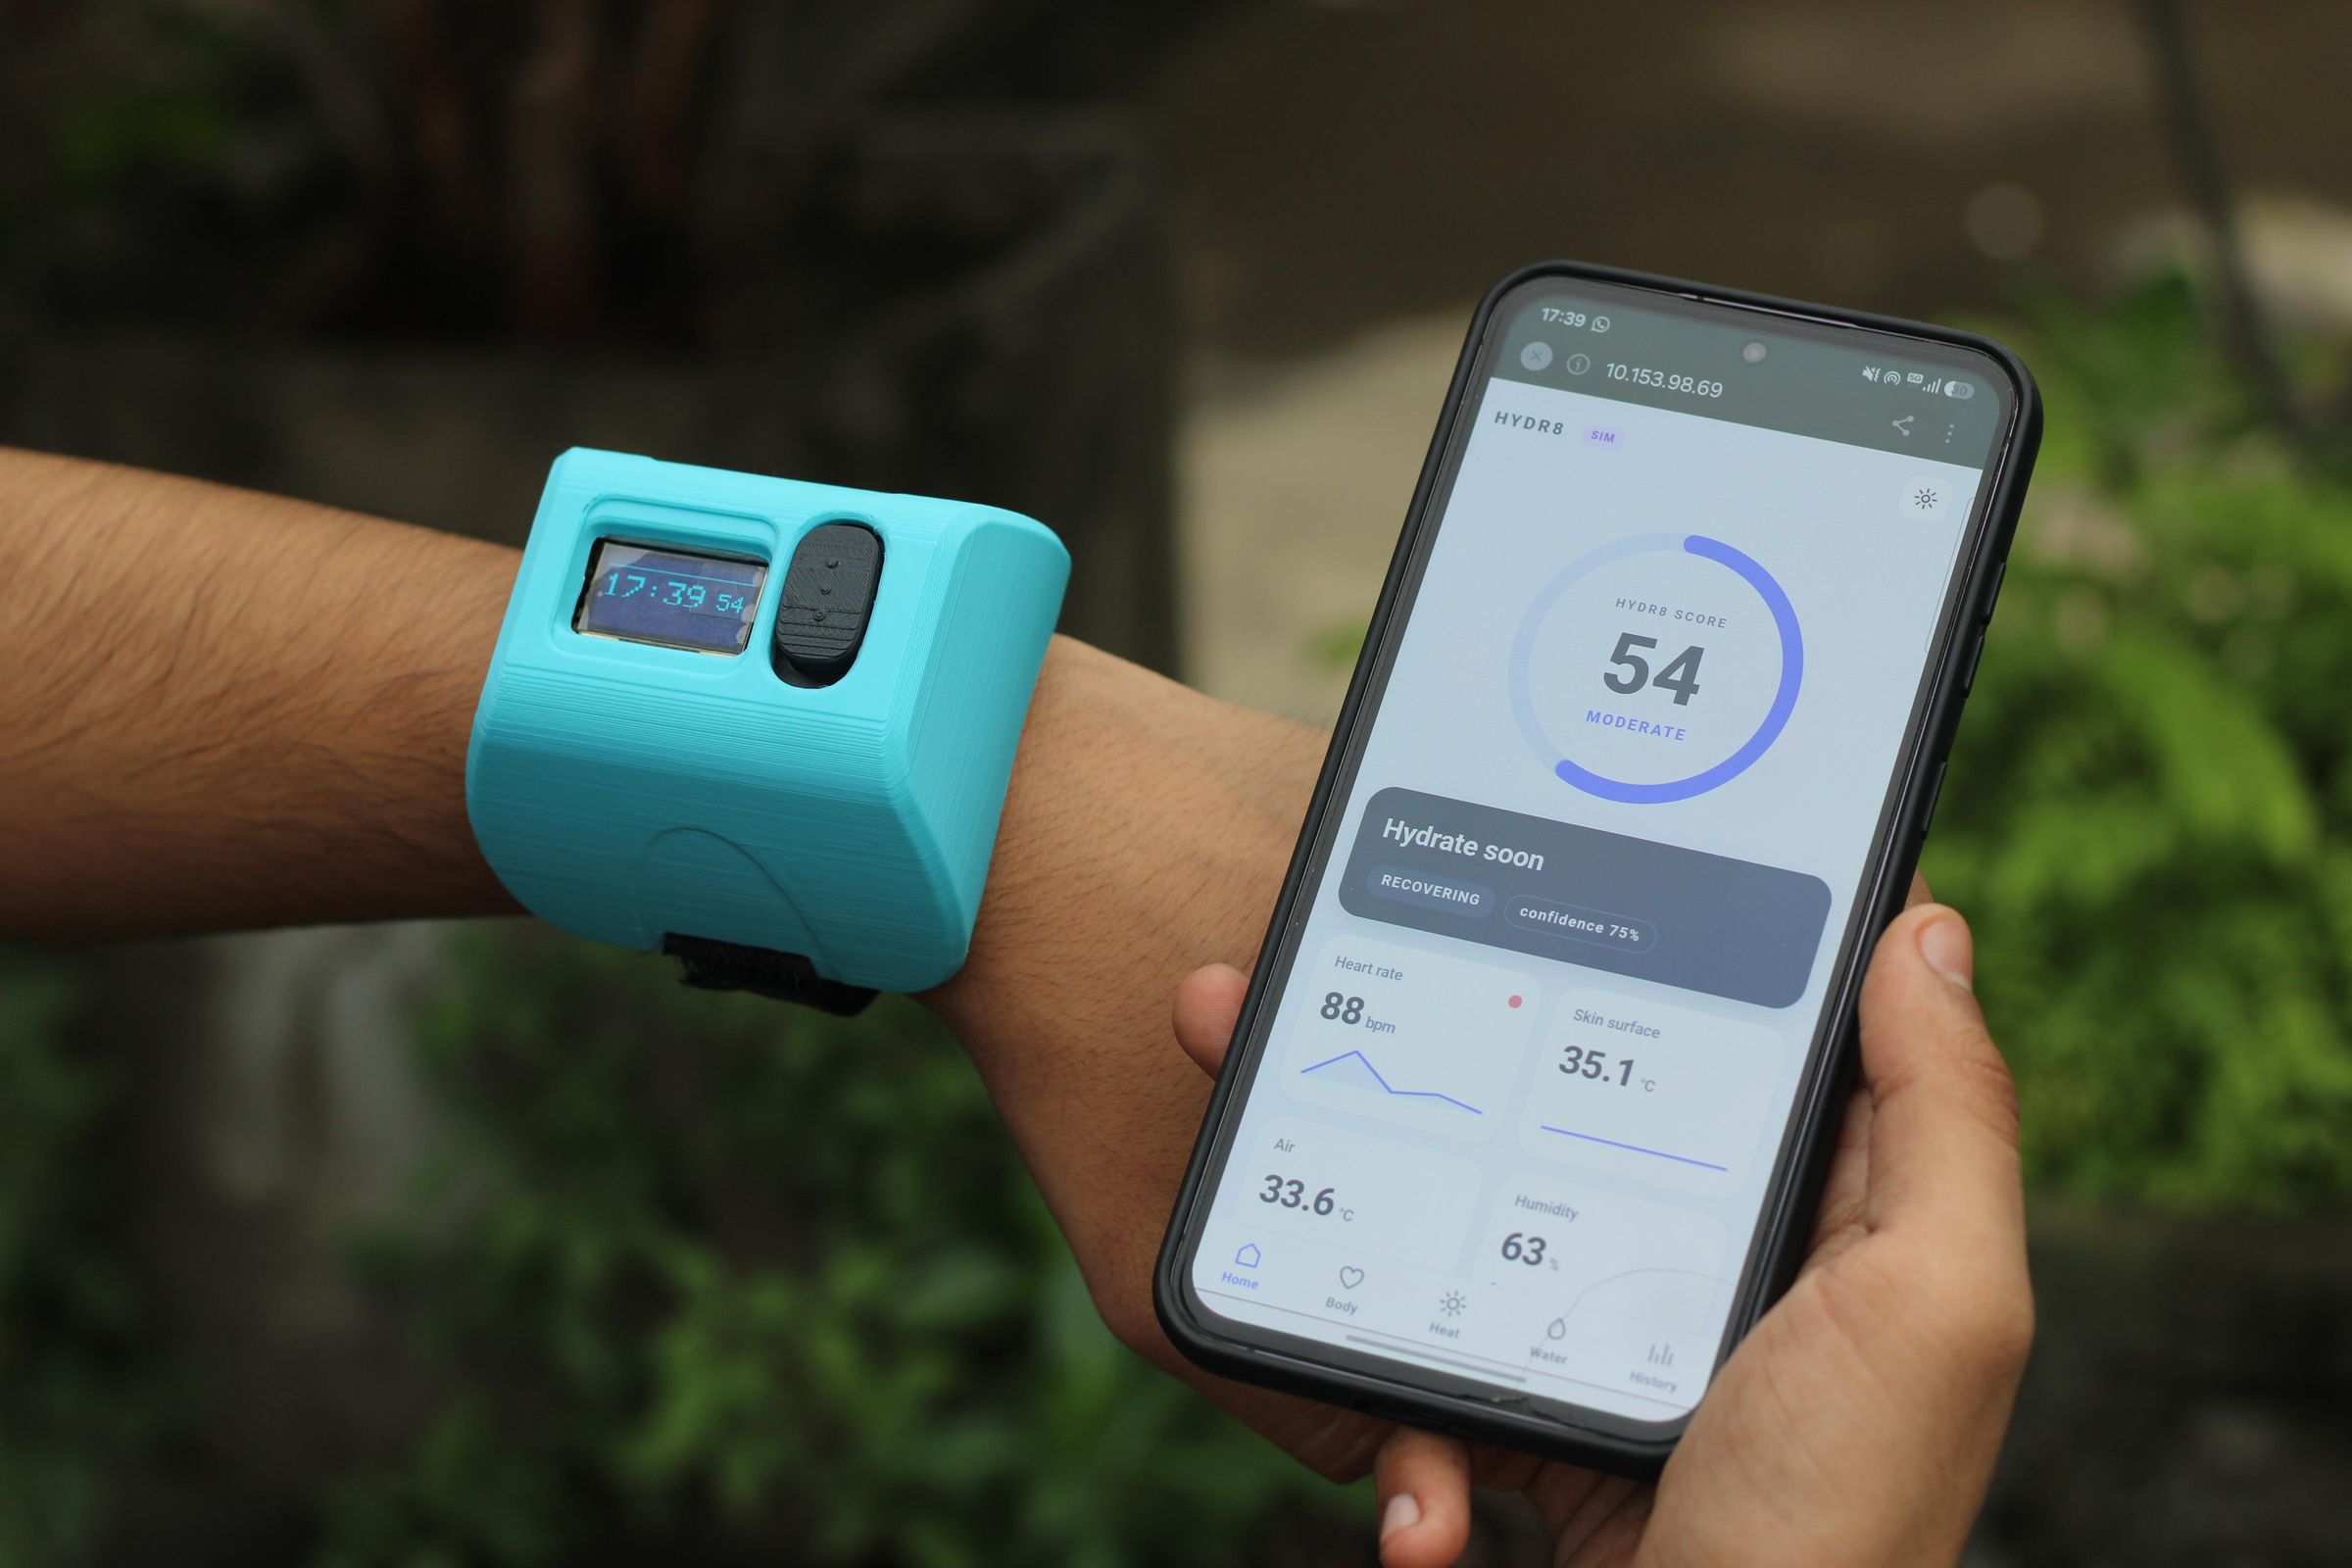
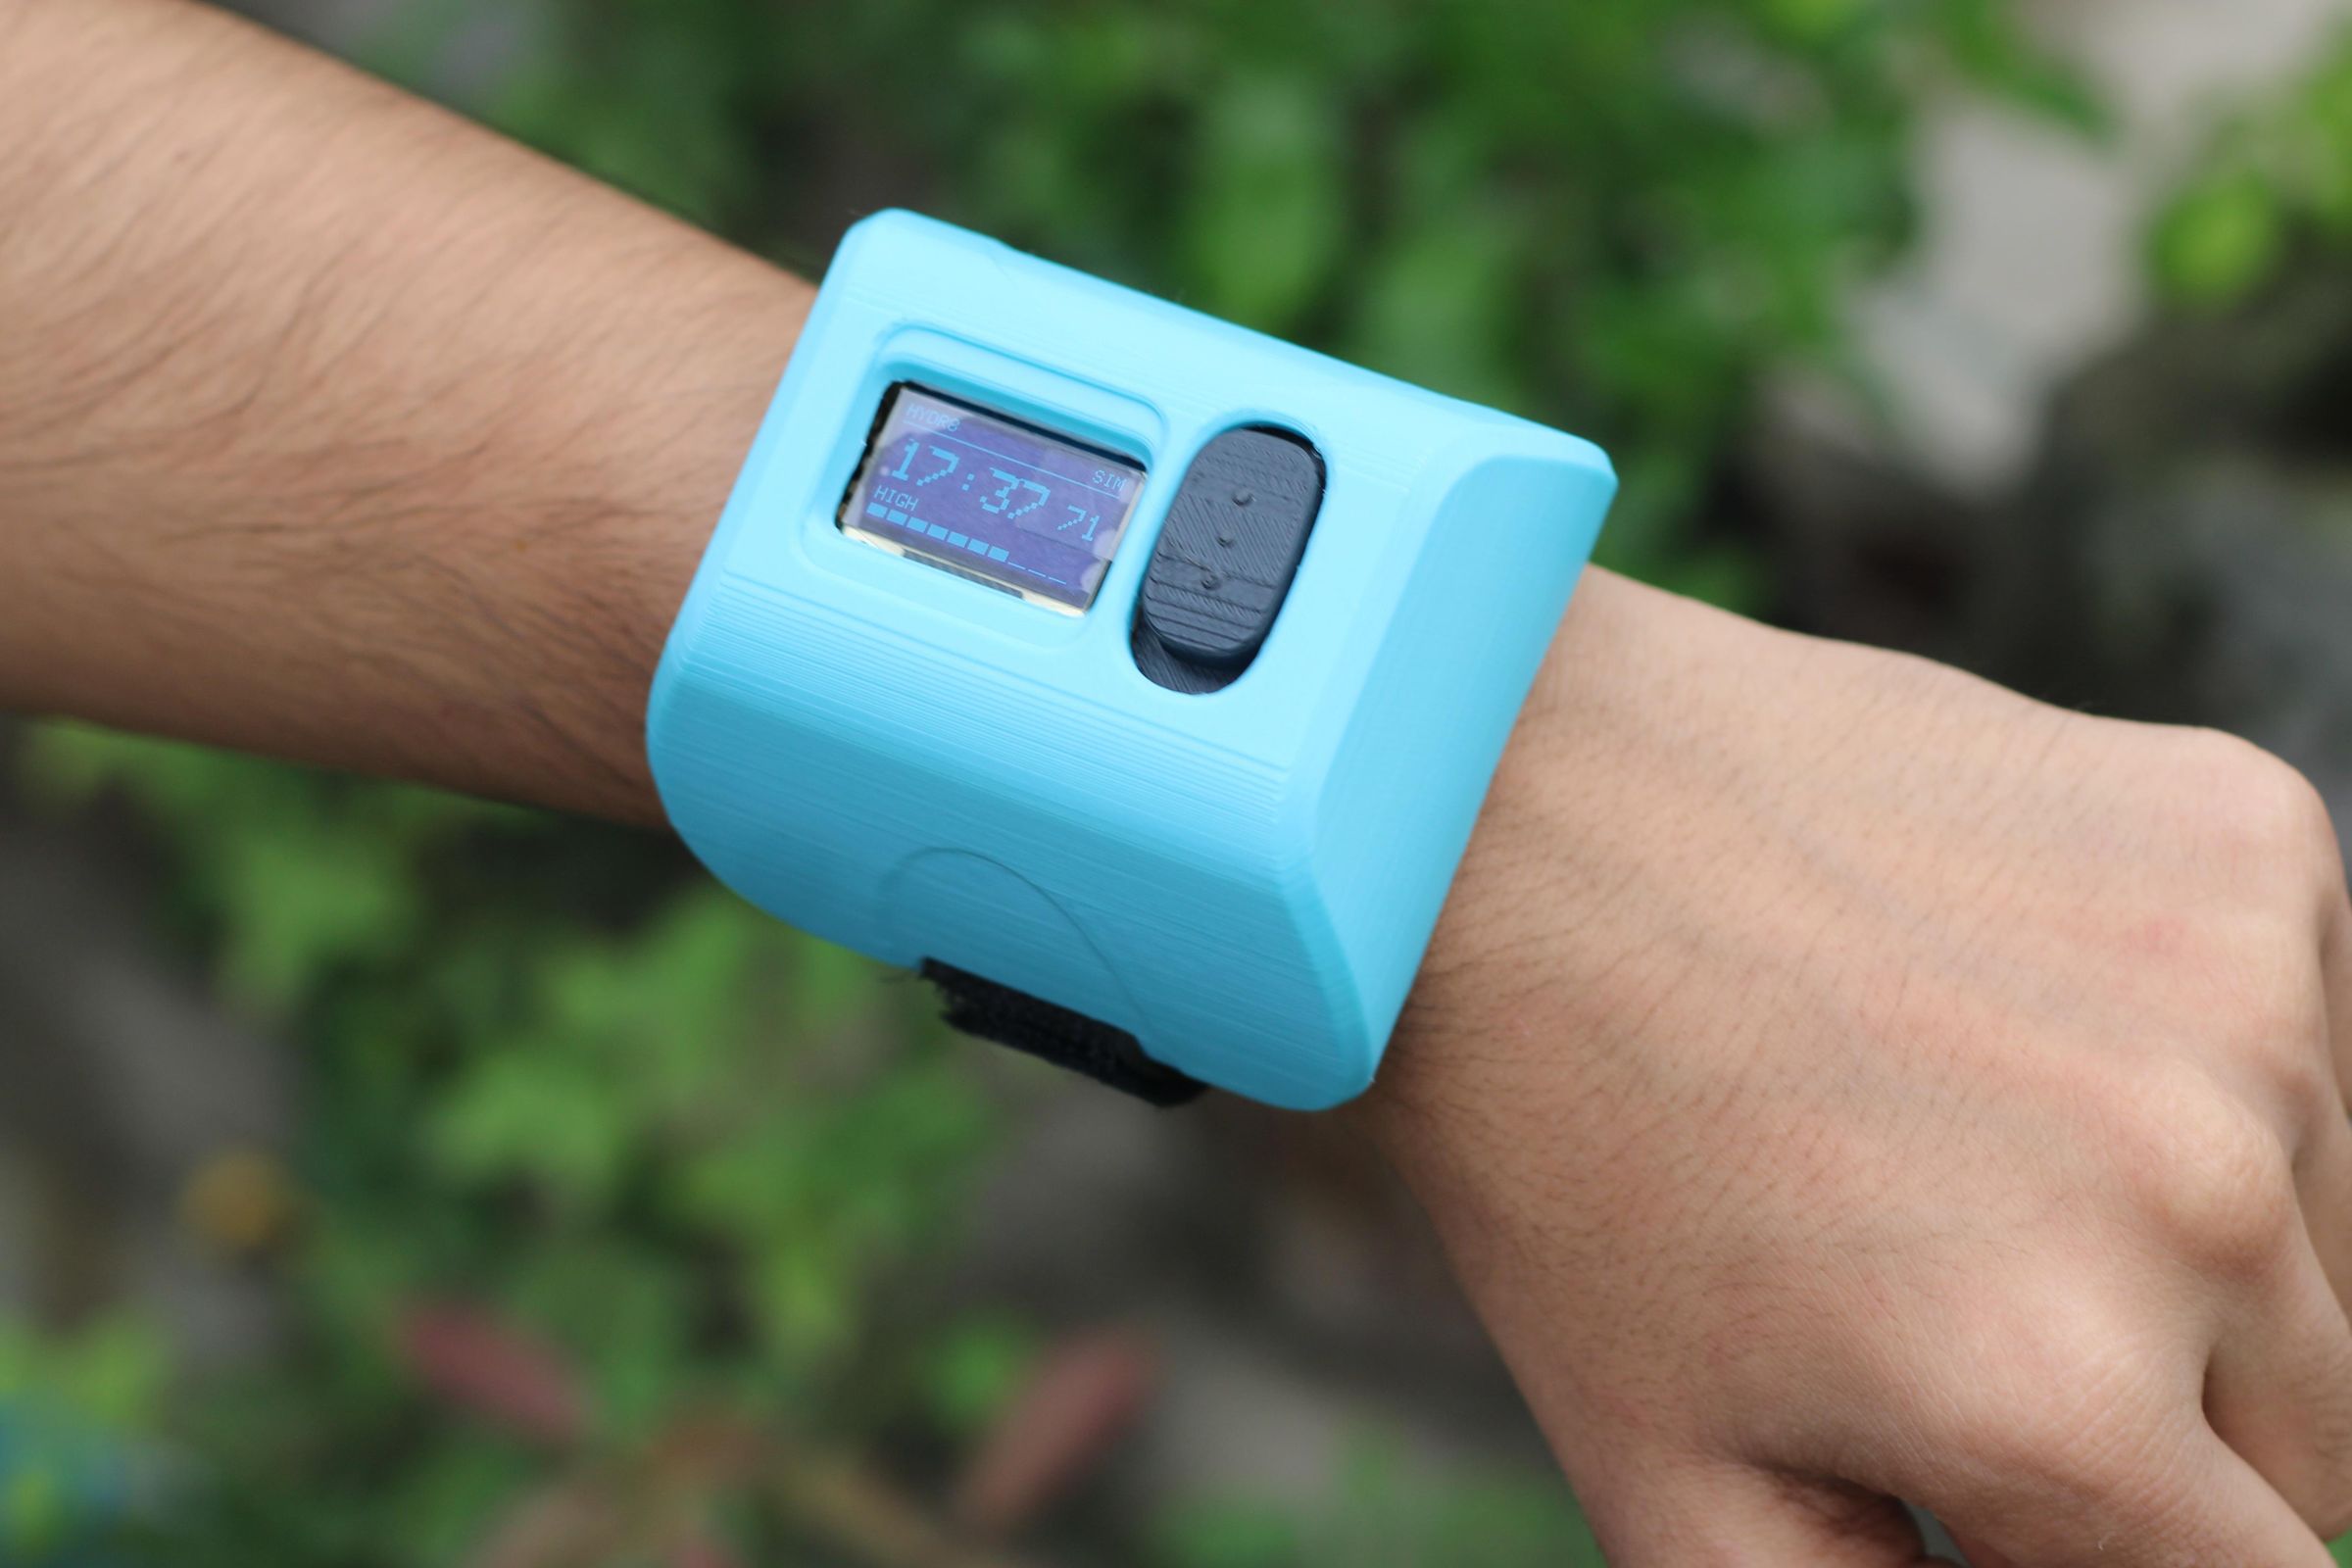
That's HYDR8. A wrist-worn band on a XIAO ESP32-C3 that reads heart rate, blood oxygen, skin-surface temperature, and the temperature and humidity around you. It learns your own resting numbers, combines everything into a single 0–100 heat and hydration stress score, and tells you what to actually do. Not just "drink water" every time — sometimes the right answer is get out of the sun, and a timer will never know that.
The band itself stays simple: time, and an interruption when it matters. The full dashboard lives on your phone, hosted by the ESP32 itself. No internet needed.
One thing upfront: HYDR8 does not measure how hydrated you are. Nothing in this build can. It estimates heat and hydration stress from related signals. It's an experimental prototype, not a medical device, and I'll be specific about where that line sits when I get to the algorithm.
Supplies
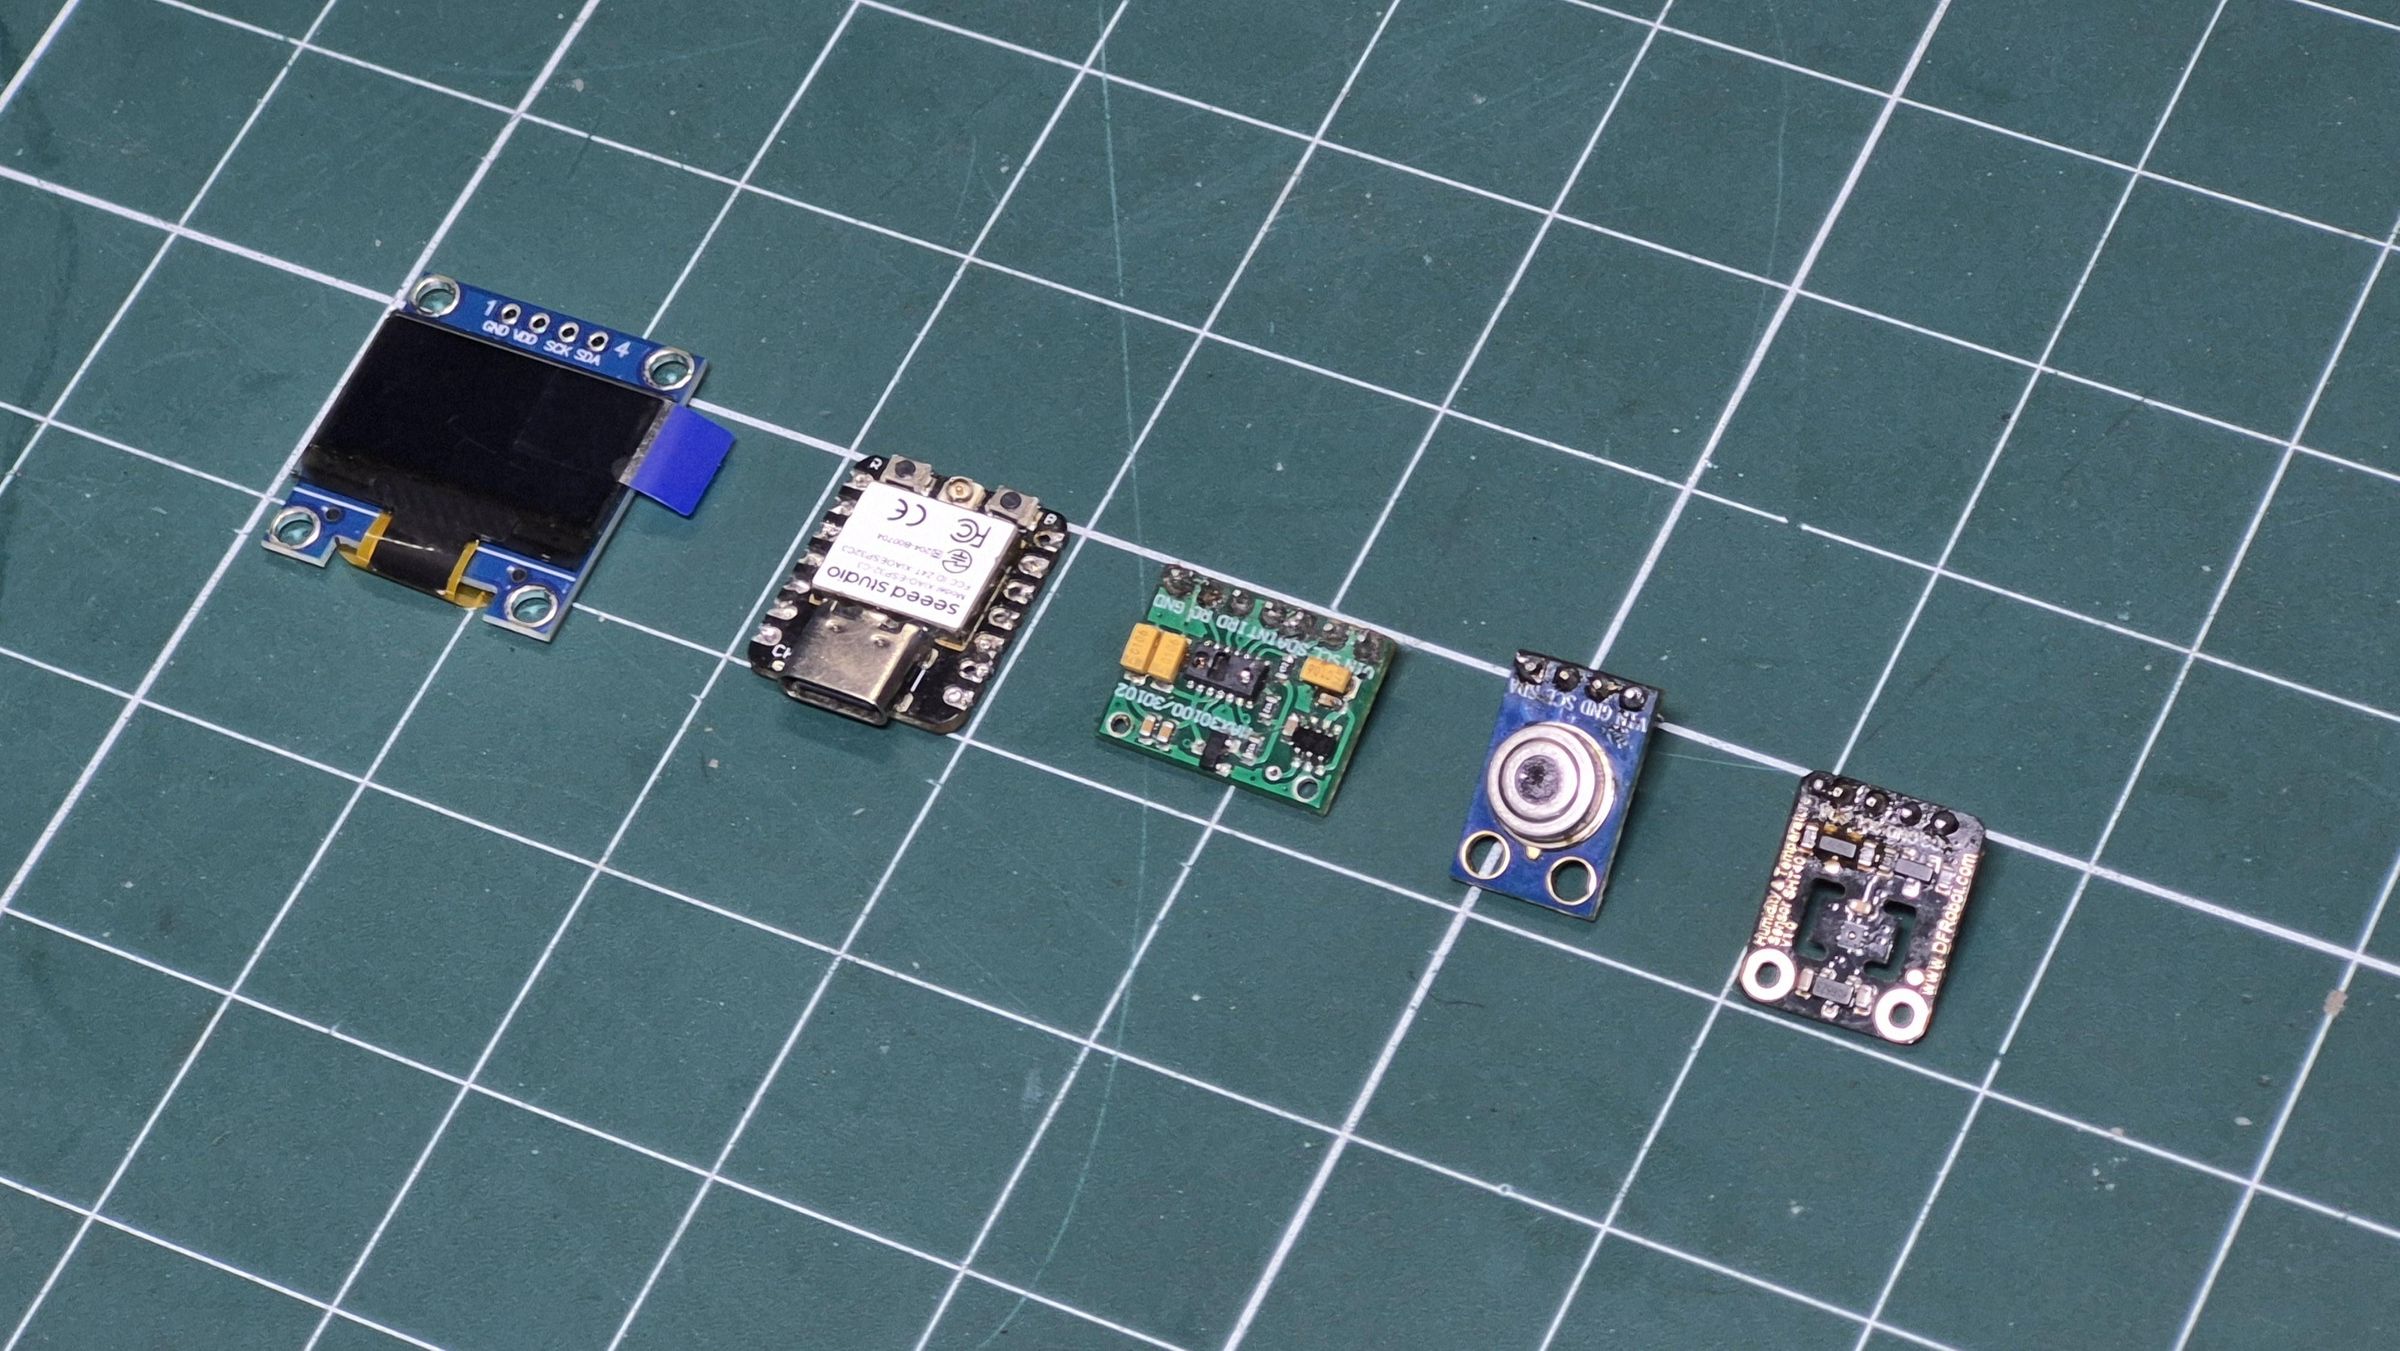
Electronics:
- XIAO ESP32-C3 (main microcontroller)
- MAX30102 (heart rate + SpO₂)
- MLX90614 (non-contact temperature)
- DFRobot Temperature & Humidity Sensor (ambient temperature + humidity)
- OLED Display (time + alerts)
- Perfboard
- Li-ion Battery
- Power Switch
- Jumper Wires
Enclosure & Assembly:
- 3D printer
- PLA/PETG filament
- Small screws
- Wrist strap
- Basic soldering supplies
Why a 30-Minute Reminder Doesn't Work
Everyone knows they should drink more water. That's not the problem. The problem is that thirst is a terrible alarm — by the time you notice it, you're already behind, and if you're concentrating on something you won't notice it at all.
So we build reminders. And the reminder is always some version of the same thing: a fixed interval. Every 30 minutes, every hour, eight glasses a day. It's simple, which is why it's everywhere.
It's also wrong most of the time.
Thirty minutes at a desk with a fan on is not the same as thirty minutes cycling in 38°C. In the first case you probably didn't need the reminder. In the second, you needed it fifteen minutes ago, and you'll need the next one soon after. Same notification, wildly different situations, and the app has no idea which one you're in.
That mismatch is what kills it. A reminder that's wrong more often than it's right teaches you to dismiss it without reading. Mine lasted two days.
There's a second thing fixed reminders get wrong, and I think it's the bigger one: water isn't always the answer. If you're standing in direct sun at 45°C and your body is already struggling to shed heat, drinking more water doesn't fix that. You need shade. You need to stop moving for a bit. A timer can't tell the difference between "you're a little behind on fluids" and "you need to get out of this environment right now," so it says the same thing either way.
And in India, that second situation isn't hypothetical. Humidity is what makes it dangerous — sweating only cools you if the sweat can evaporate, and at 70% humidity it mostly can't. Which is why 35°C in dry Rajasthan air and 35°C in coastal humidity are genuinely different physiological problems, even though your phone's weather app shows the same number.
The people most exposed to this are the ones least likely to be wearing a fitness tracker: construction workers, delivery riders, farmers, anyone whose job is outdoors in summer. I'm not going to pretend a hobby project on a perfboard solves that. But it did make me want to find out how far you could get with about ₹1,500 of sensors and an ESP32.
The information needed to give better advice isn't exotic. Your heart rate says something about how hard your body is working. Skin temperature says something about heat load. Air temperature and humidity say what you're up against. Put those together against what's normal for you, watch which way they're moving, and you can say something much more useful than "30 minutes have passed."
That's the idea I wanted to test.
The Solution
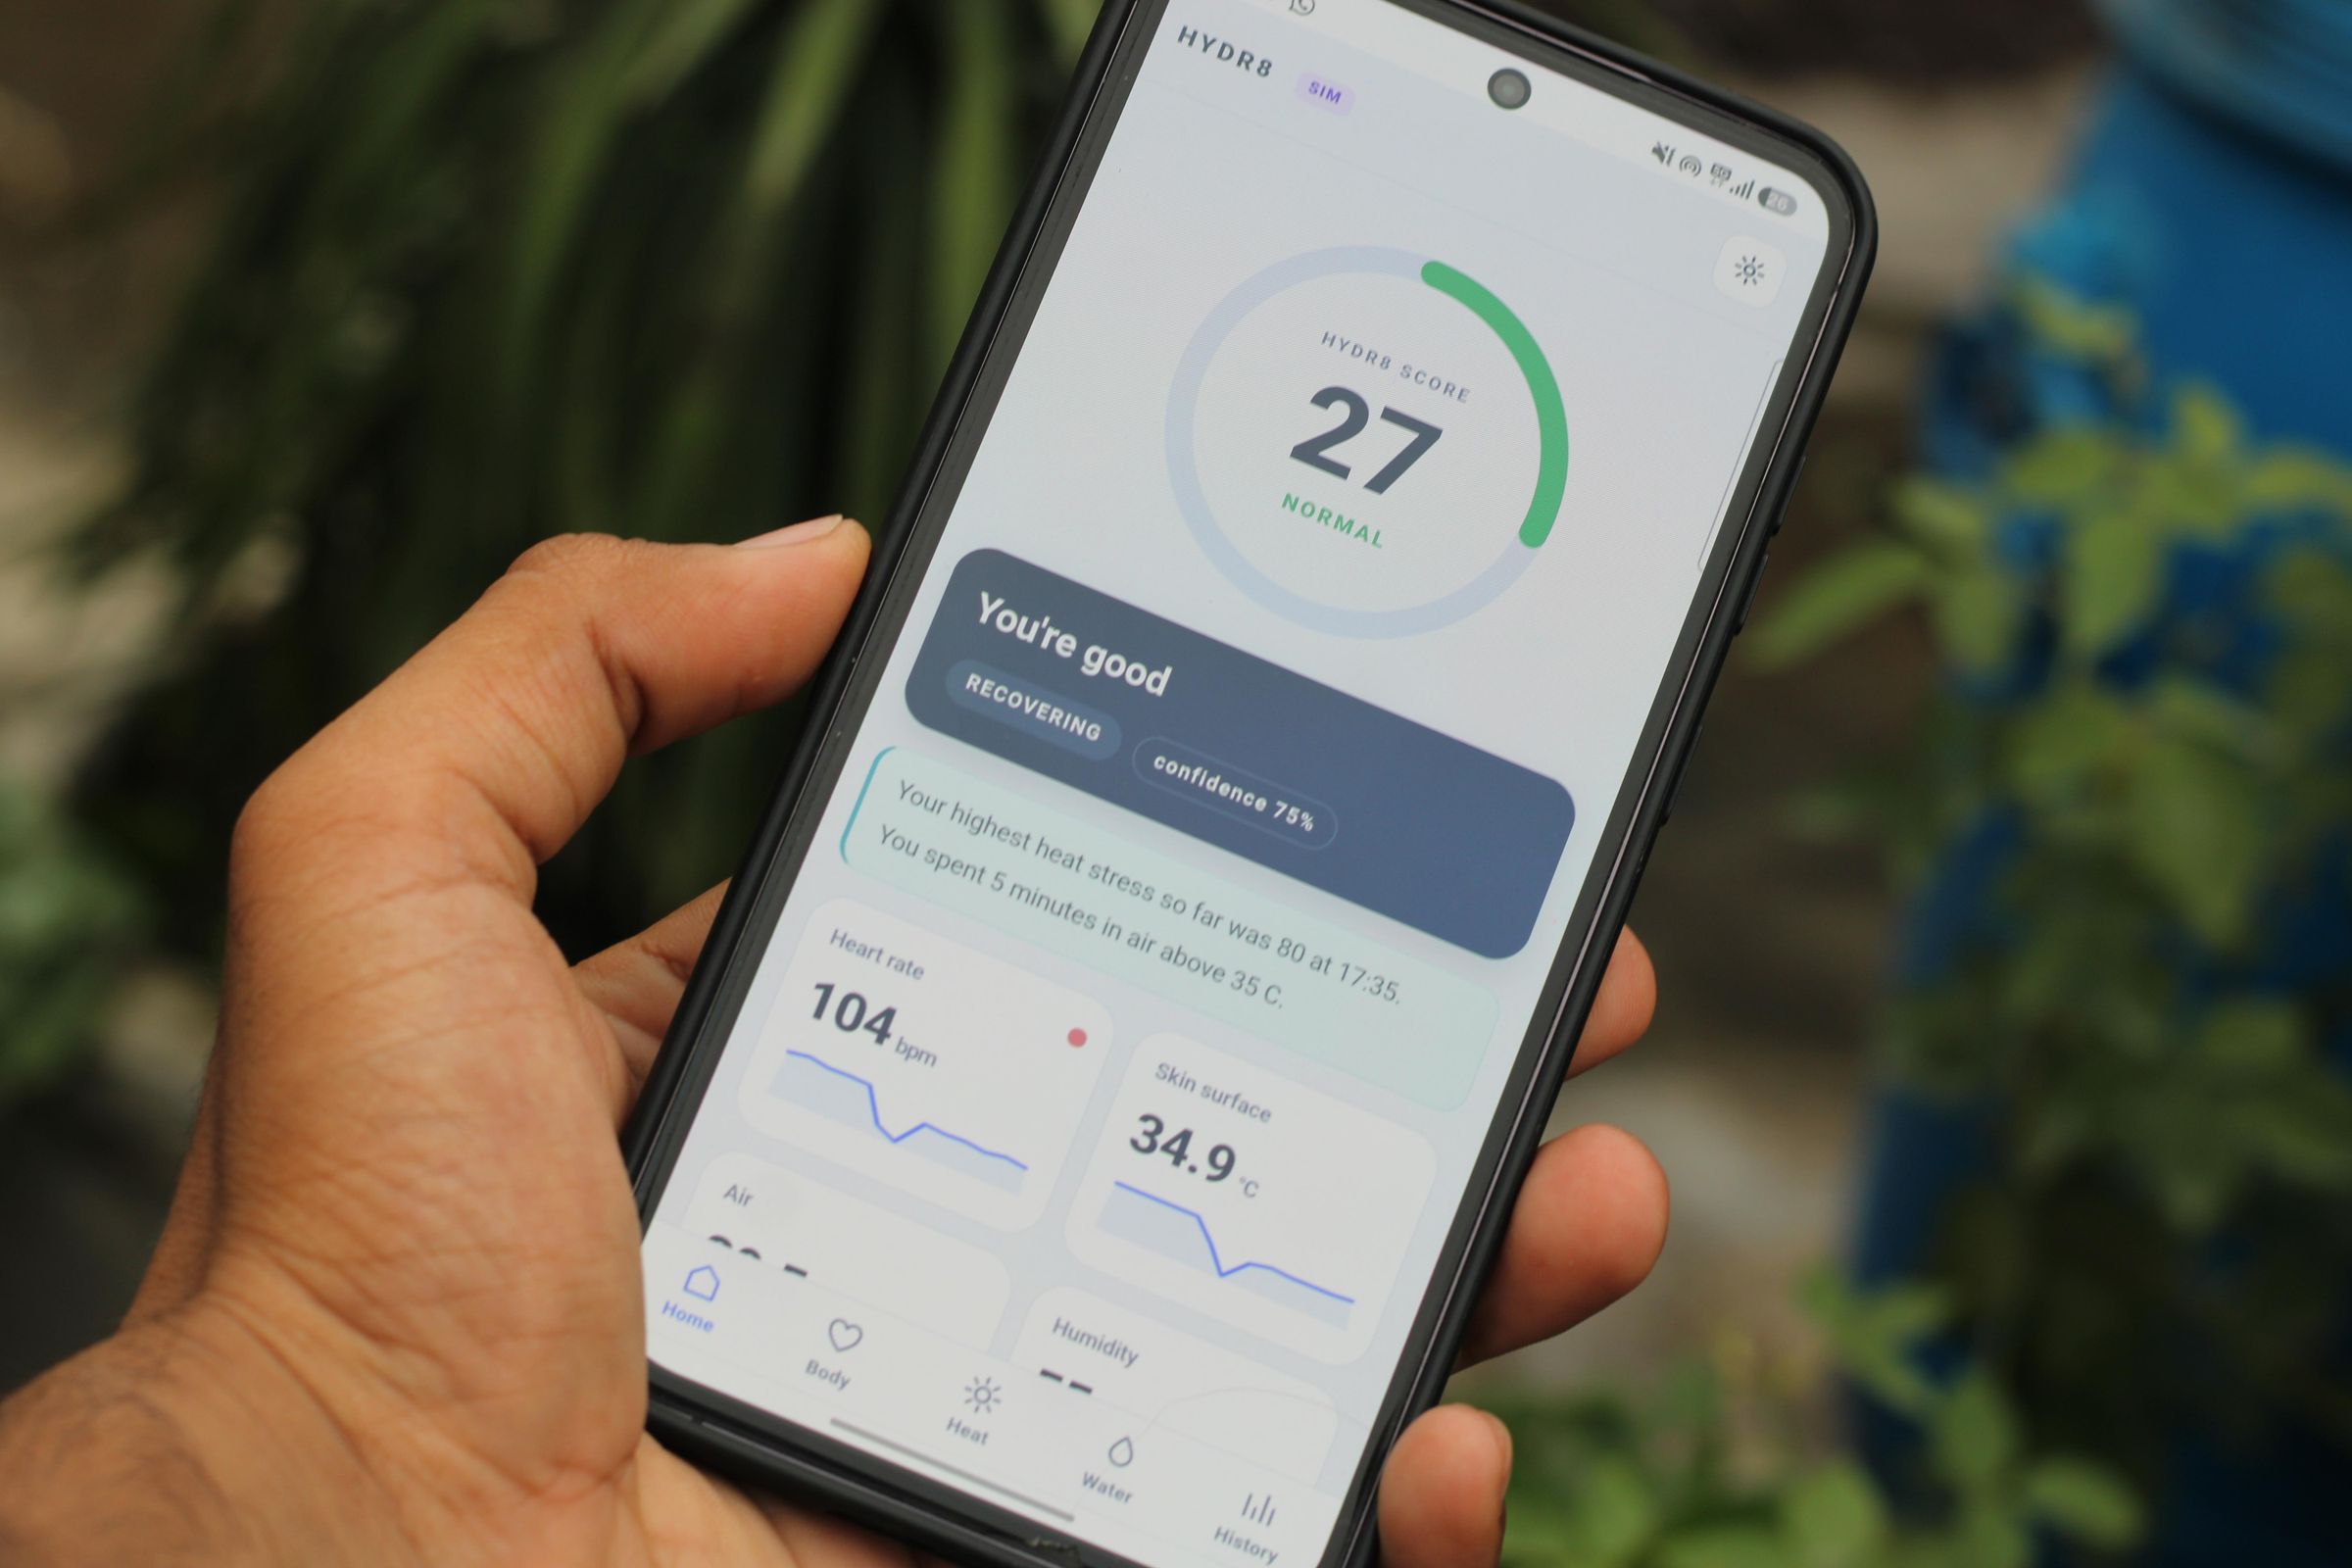
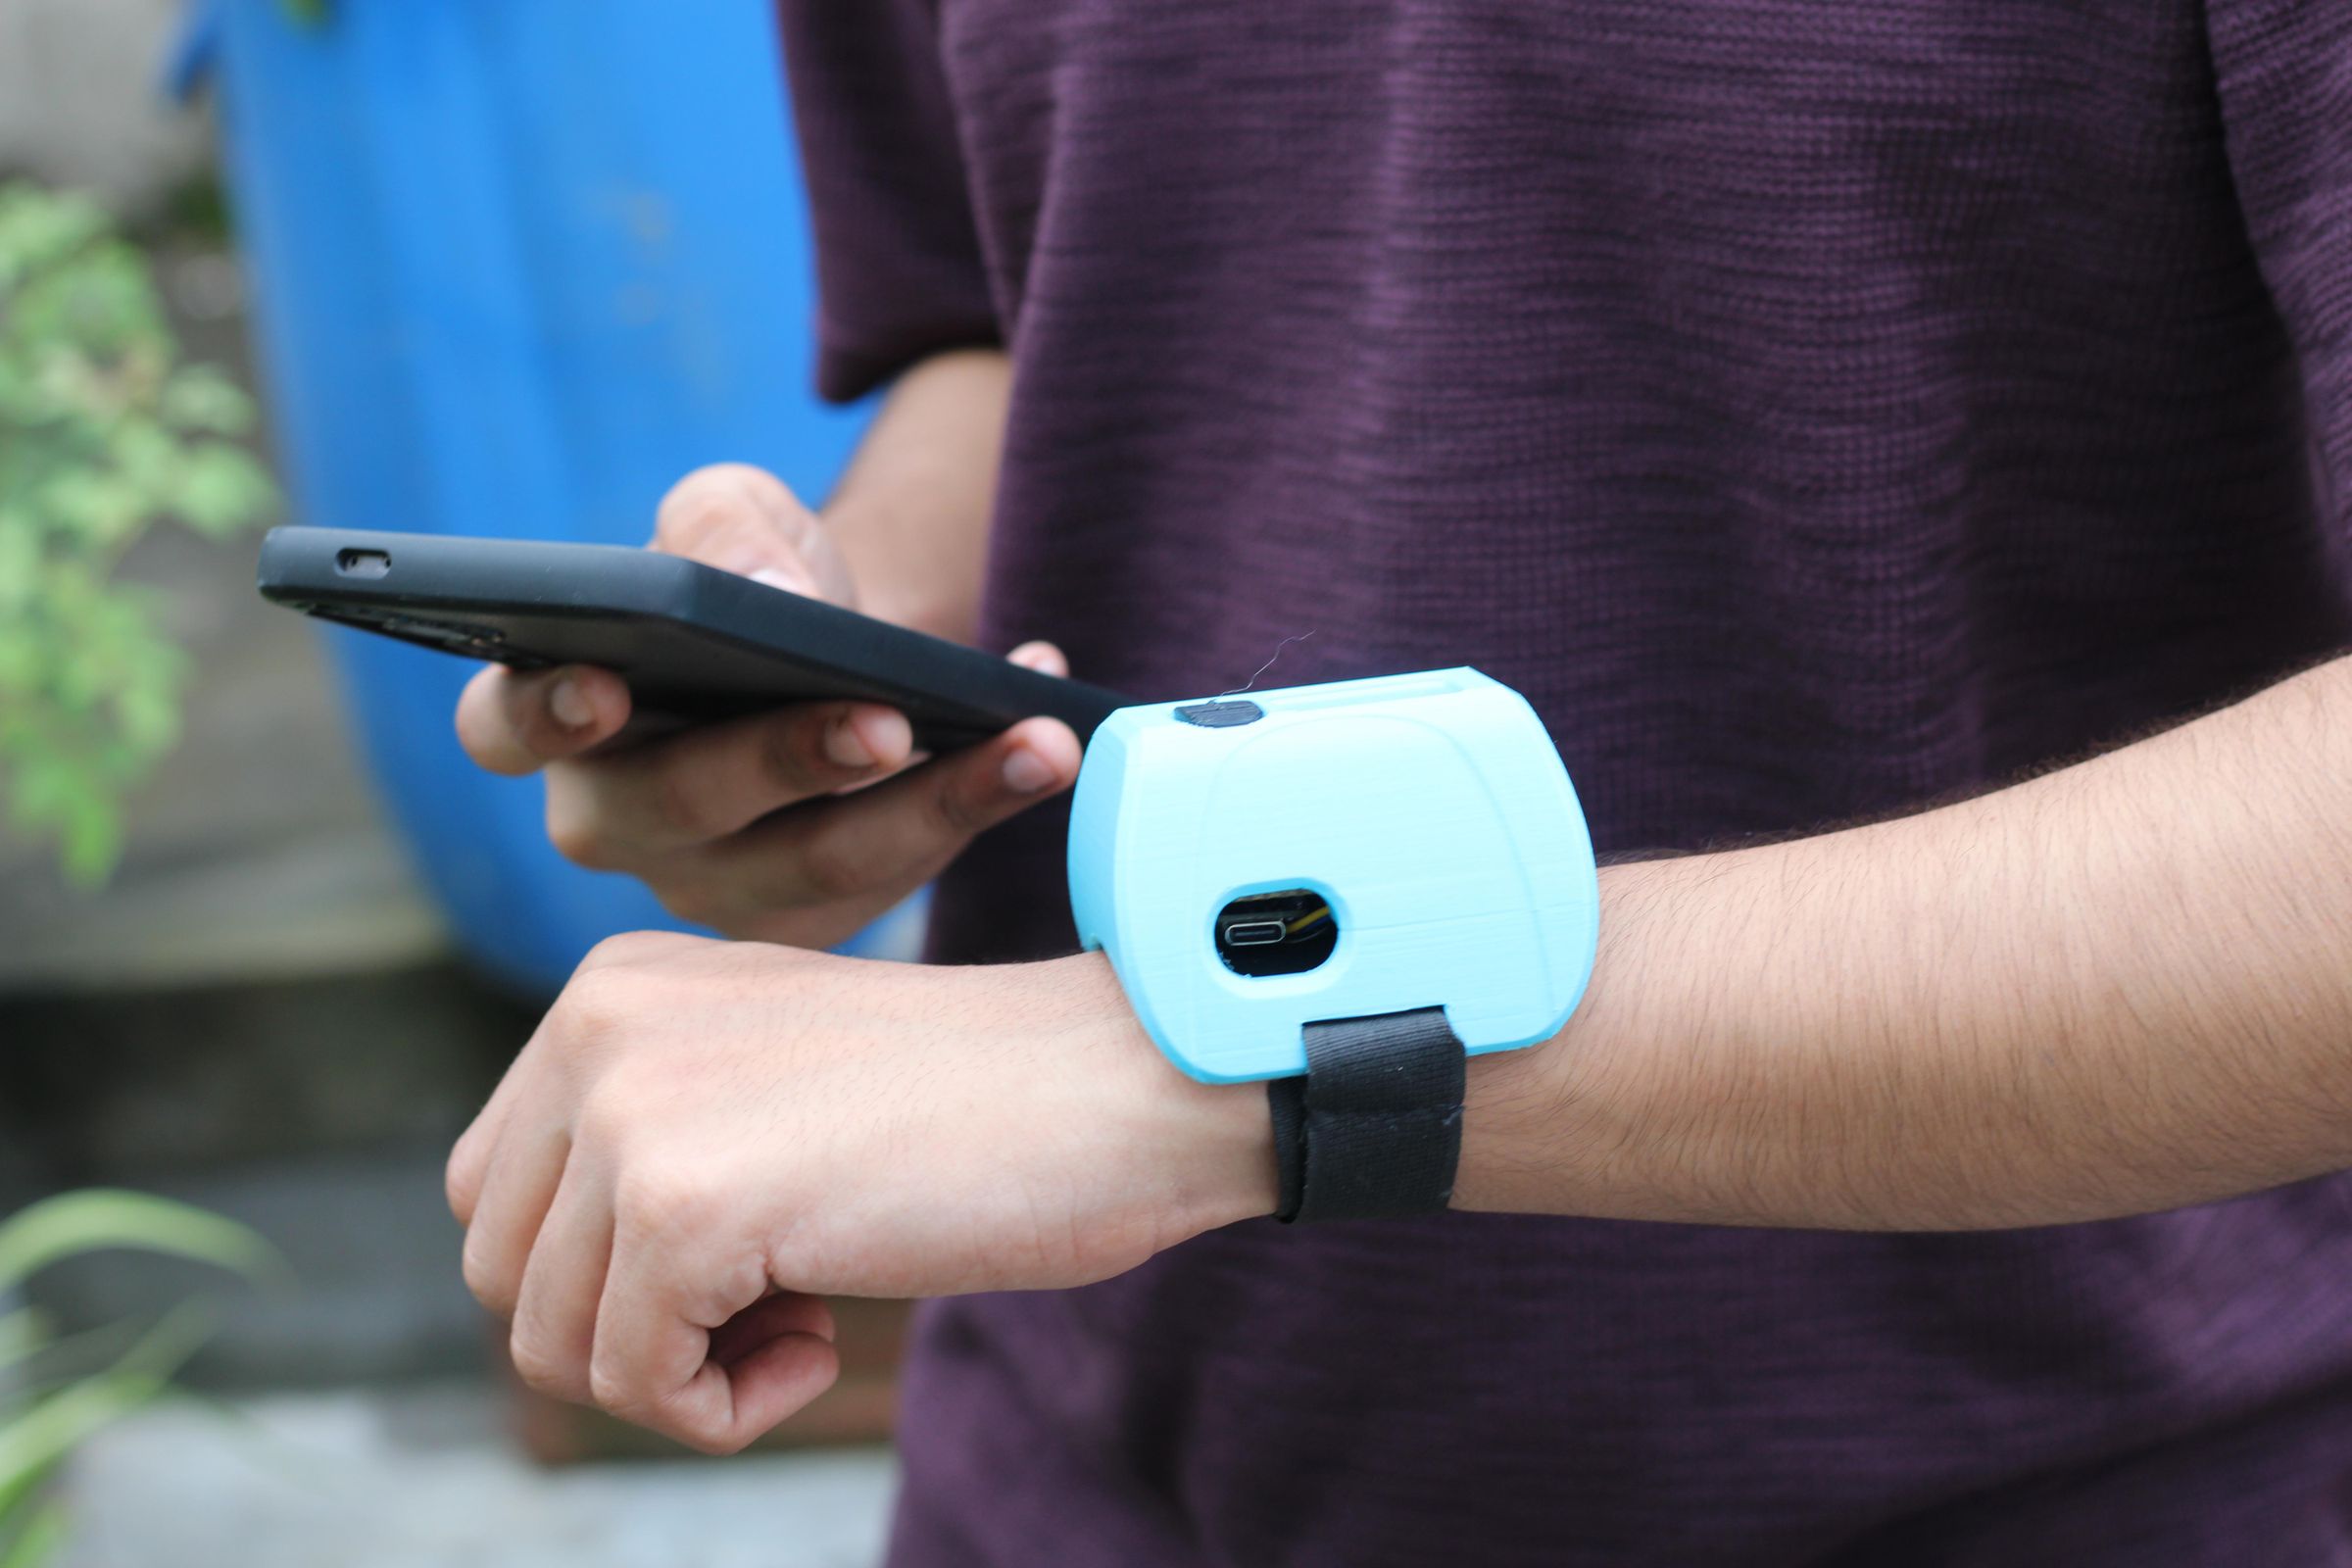
So I Built HYDR8
HYDR8 is a wrist-worn band that answers a different question. Instead of how long has it been since you drank?, it asks how hard is your body working, and what is the air doing to you right now?
It reads six things:
- Heart rate, which tells you how hard your body is working
- SpO₂, blood oxygen, used as a secondary signal
- Skin-surface temperature, the heat load at your wrist
- Ambient temperature, what you're actually standing in
- Humidity, which decides whether sweating can cool you at all
- Your personal baseline, meaning what all of the above look like when you're resting
Plus a seventh thing that turned out to matter more than I expected: trend. Not just where you are, but which direction you're heading.
All of that collapses into one number, the HYDR8 score, from 0 to 100, representing estimated heat and hydration stress.
Being honest about what this number is
HYDR8 is an experimental heat and hydration stress estimator. It is not a clinically validated dehydration detector, and I want to be precise about the difference.
There is no sensor in this build that knows how much water is in your body. None exists at this price, in this size, on a wrist. What HYDR8 measures are signals that relate to heat and hydration stress, like a raised heart rate against your own resting rate, warmer skin, hot and humid air. It combines them into an estimate.
It's the difference between a doctor running a blood test and a friend saying "you look terrible, sit down and drink something." The second one is genuinely useful. It's just not a diagnosis.
The score also carries a confidence value that drops when a sensor is missing, when the pulse signal is noisy, or when you haven't calibrated a baseline yet. If HYDR8 isn't sure, it says so instead of quietly making something up.
What it actually tells you
The score maps onto an escalating ladder of advice:
What it actually tells you
The score maps onto an escalating ladder of advice:
Normal — you're fine, nothing to do.
Hydrate soon — stress is building, get ahead of it.
Drink water — you're in it now.
Take a break — high stress and still climbing. Water alone isn't keeping up.
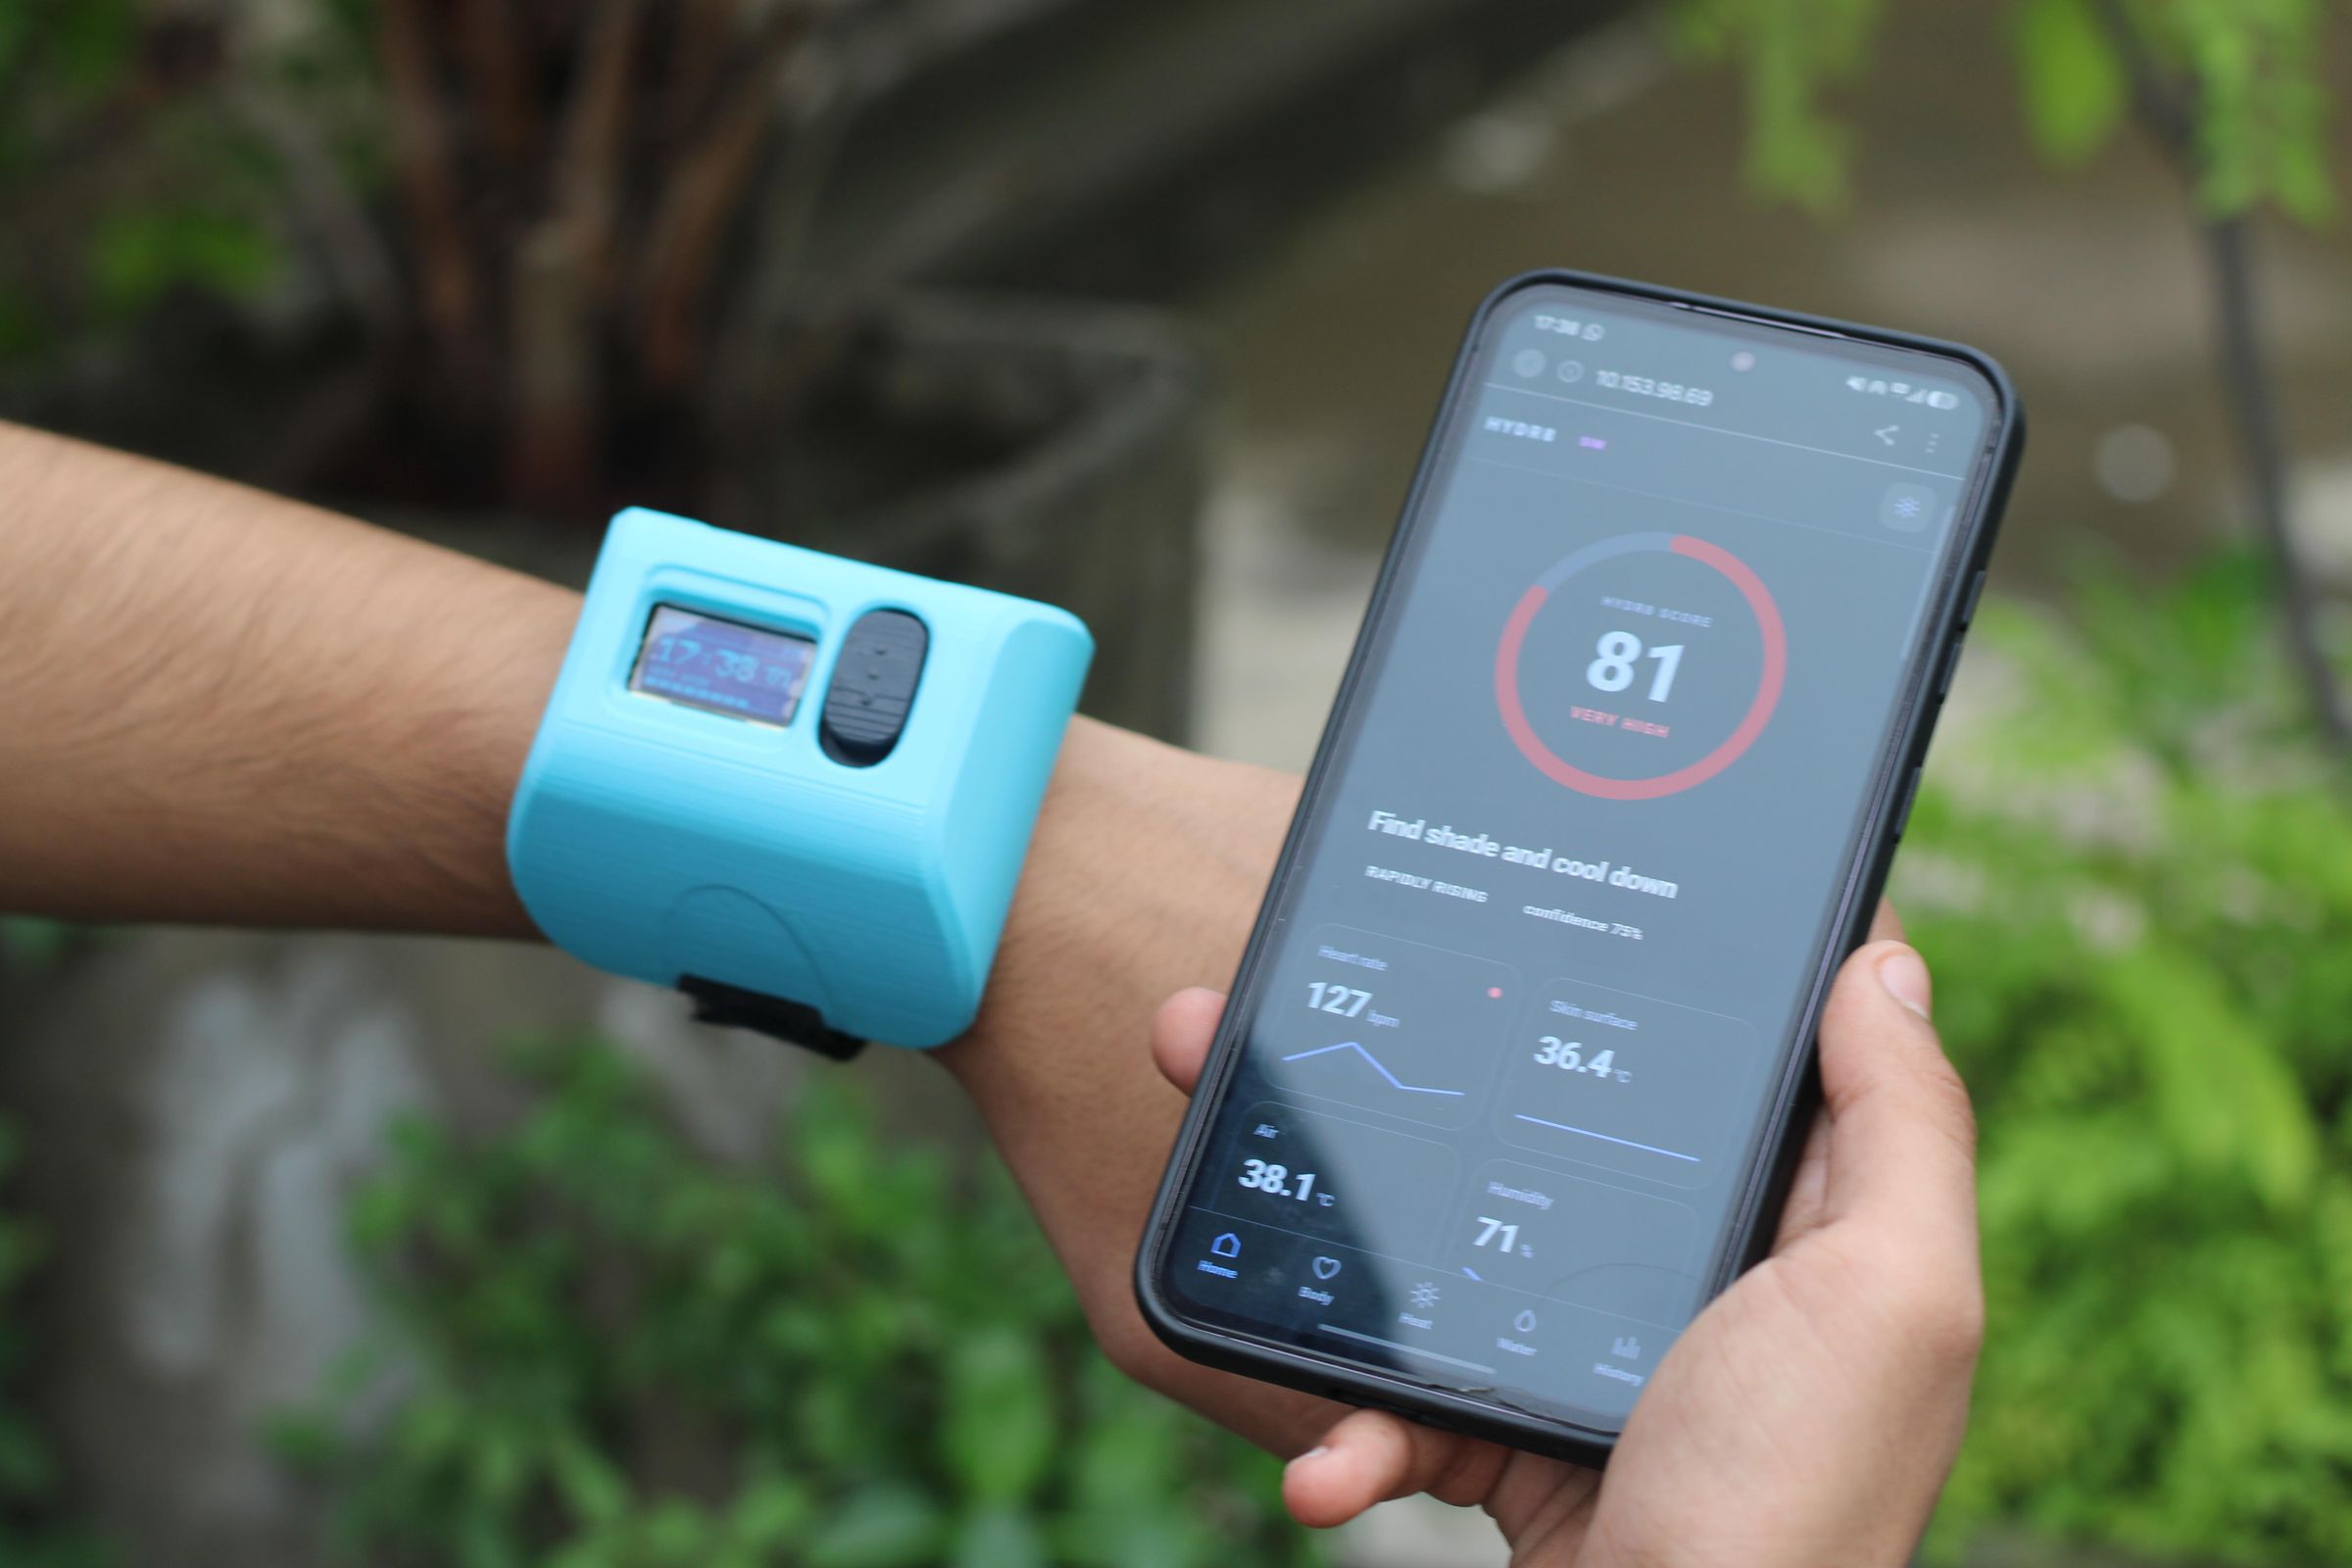
Cool down / Find shade — the environment is the problem. Drinking more won't fix standing in the sun
The two halves of the product:
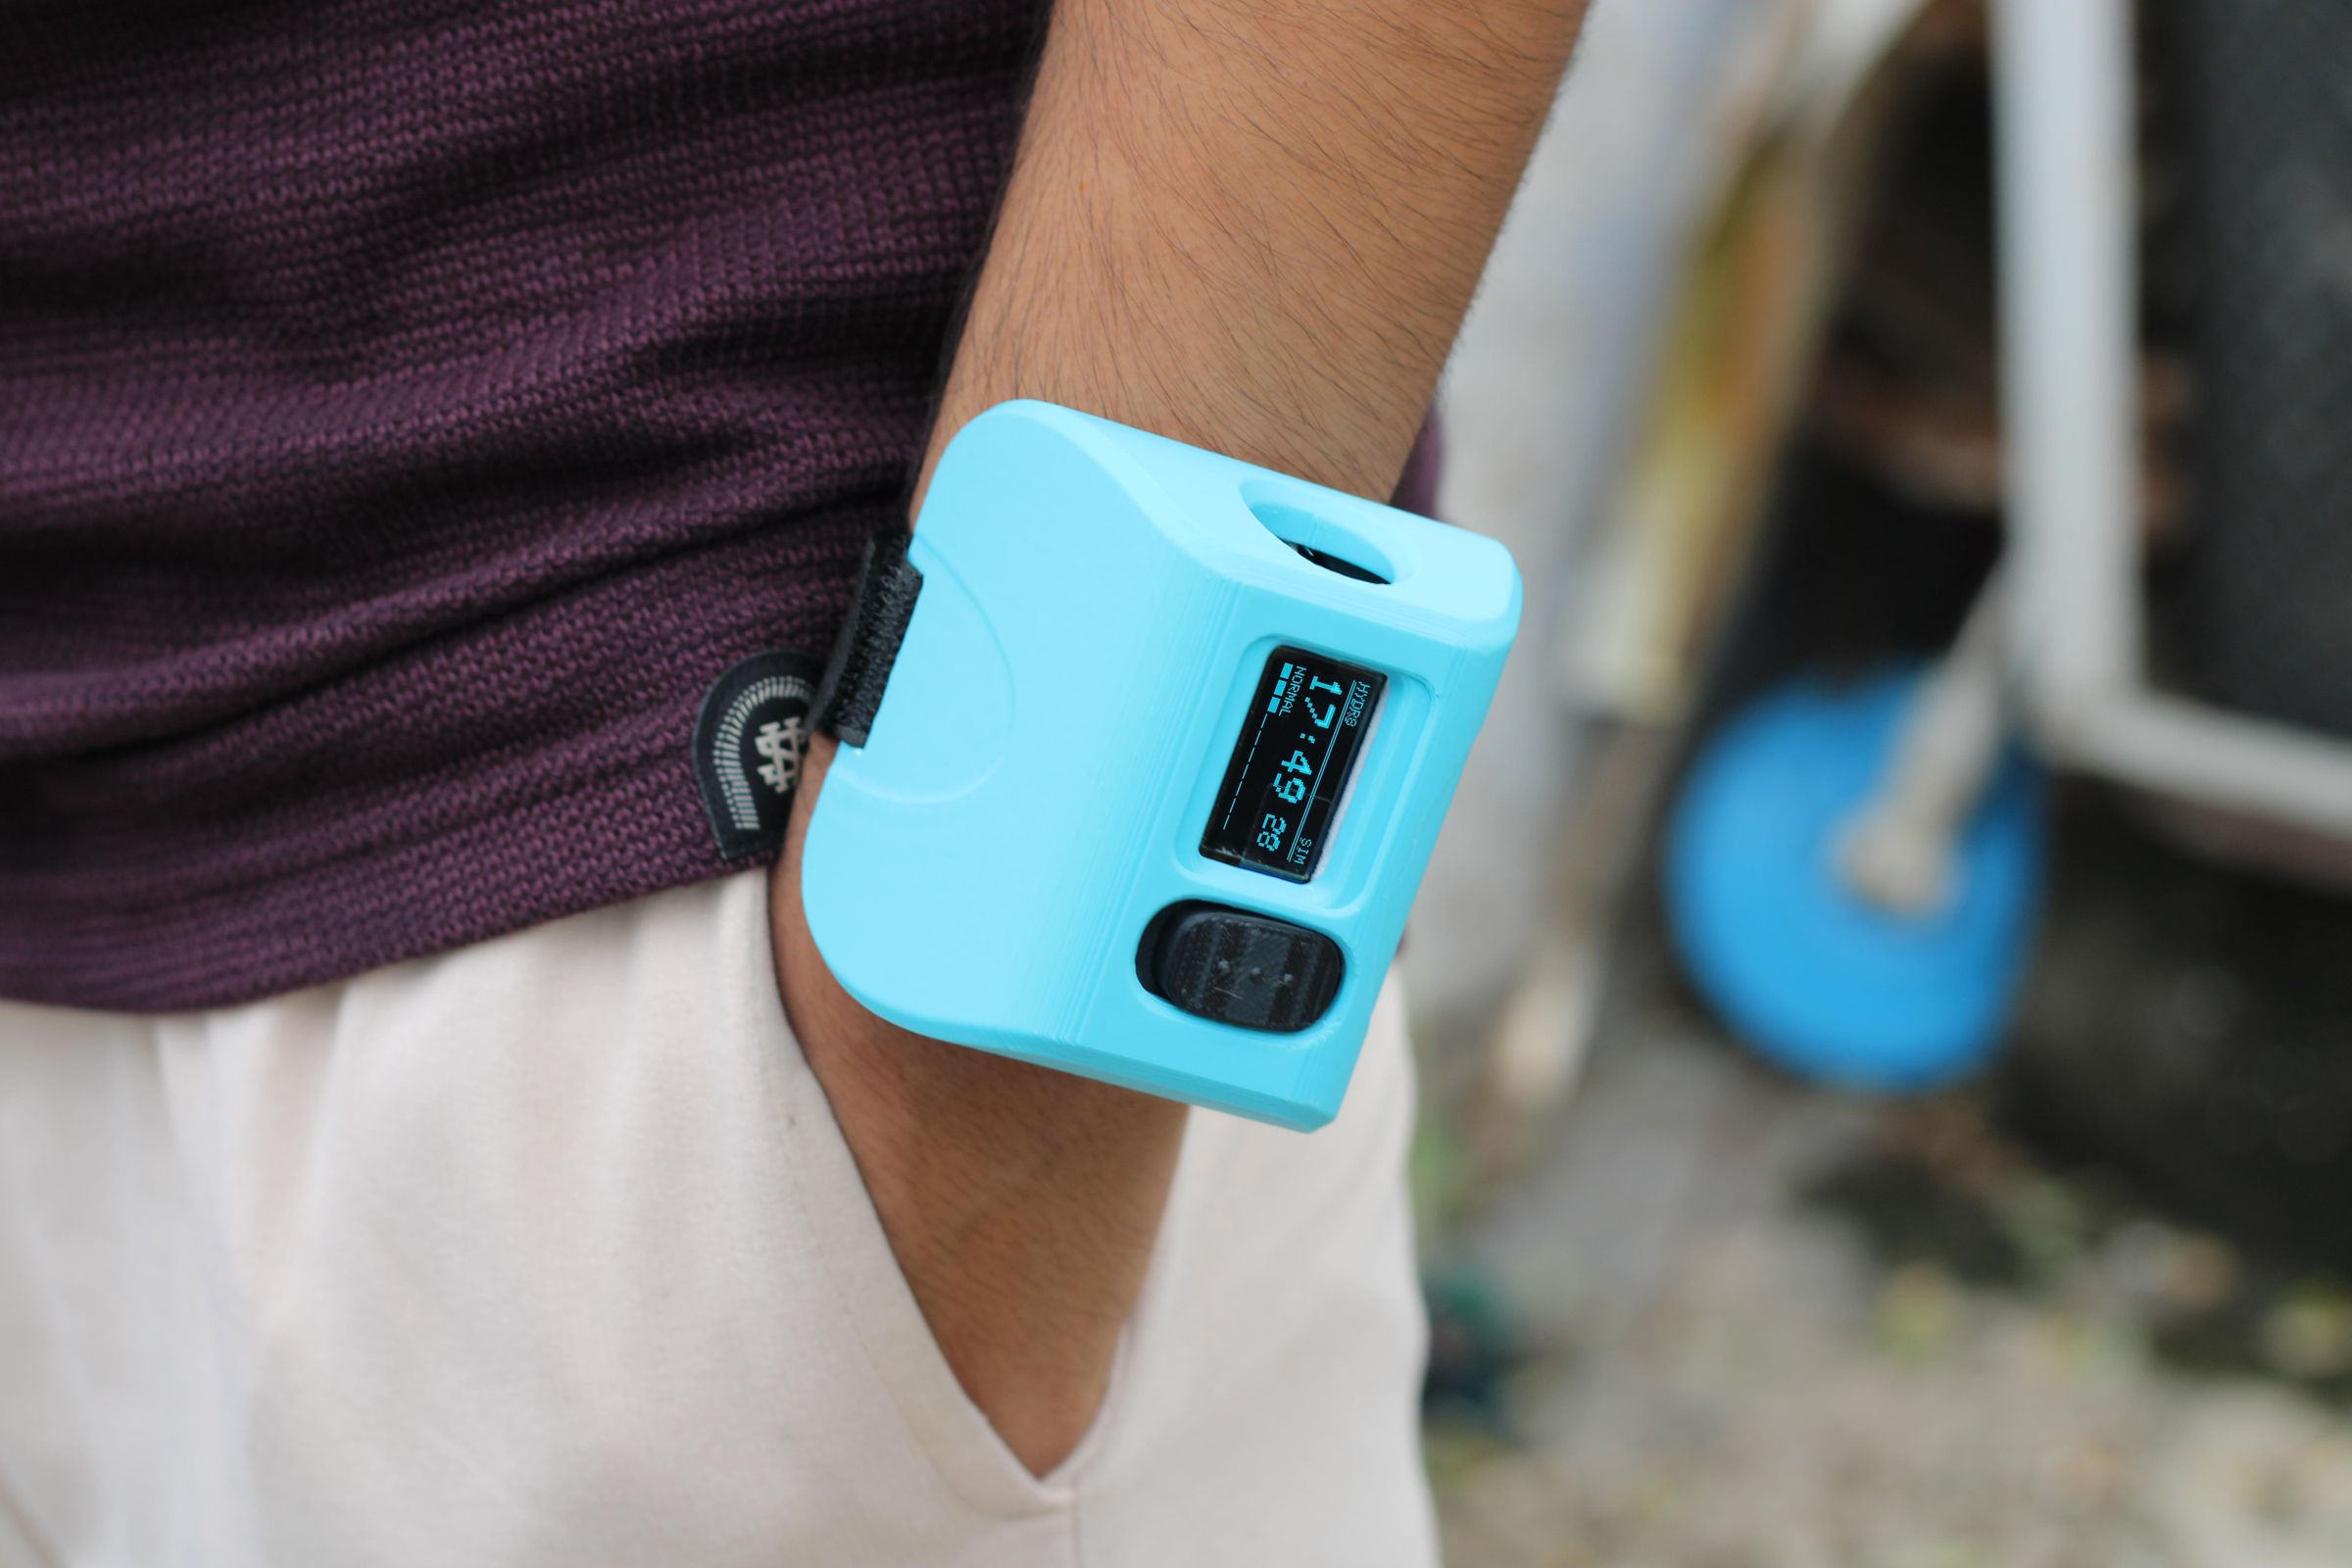
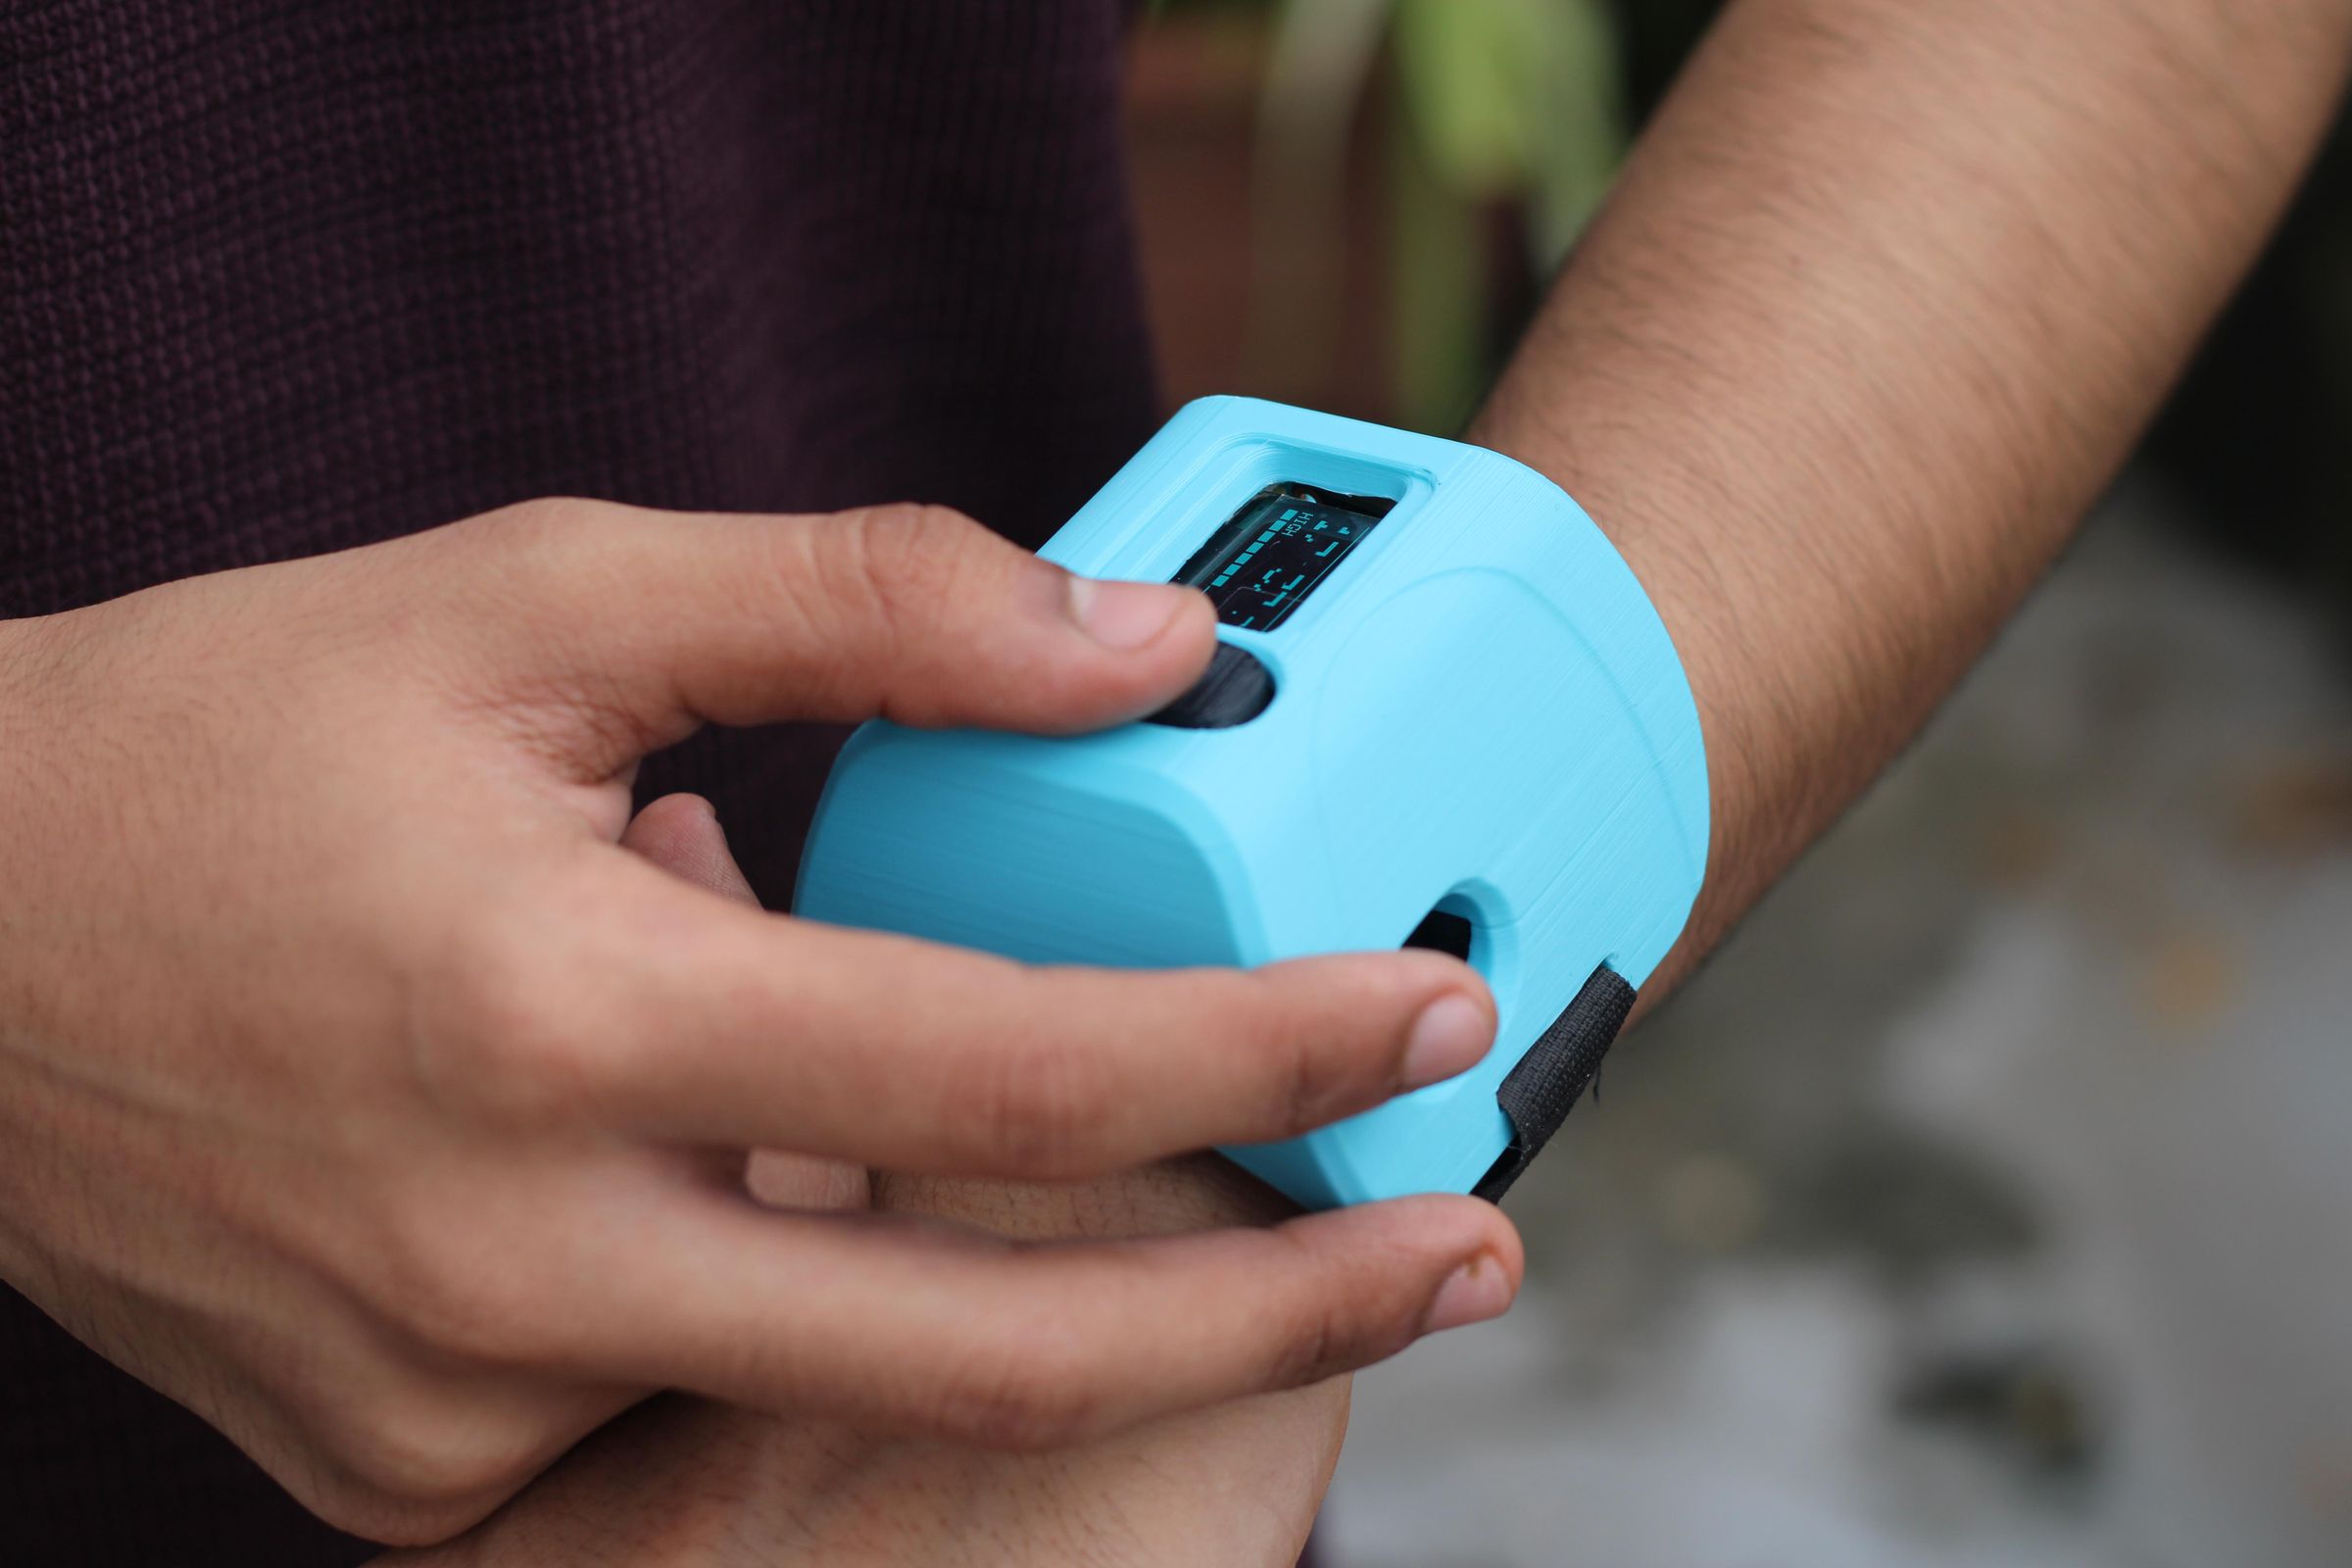
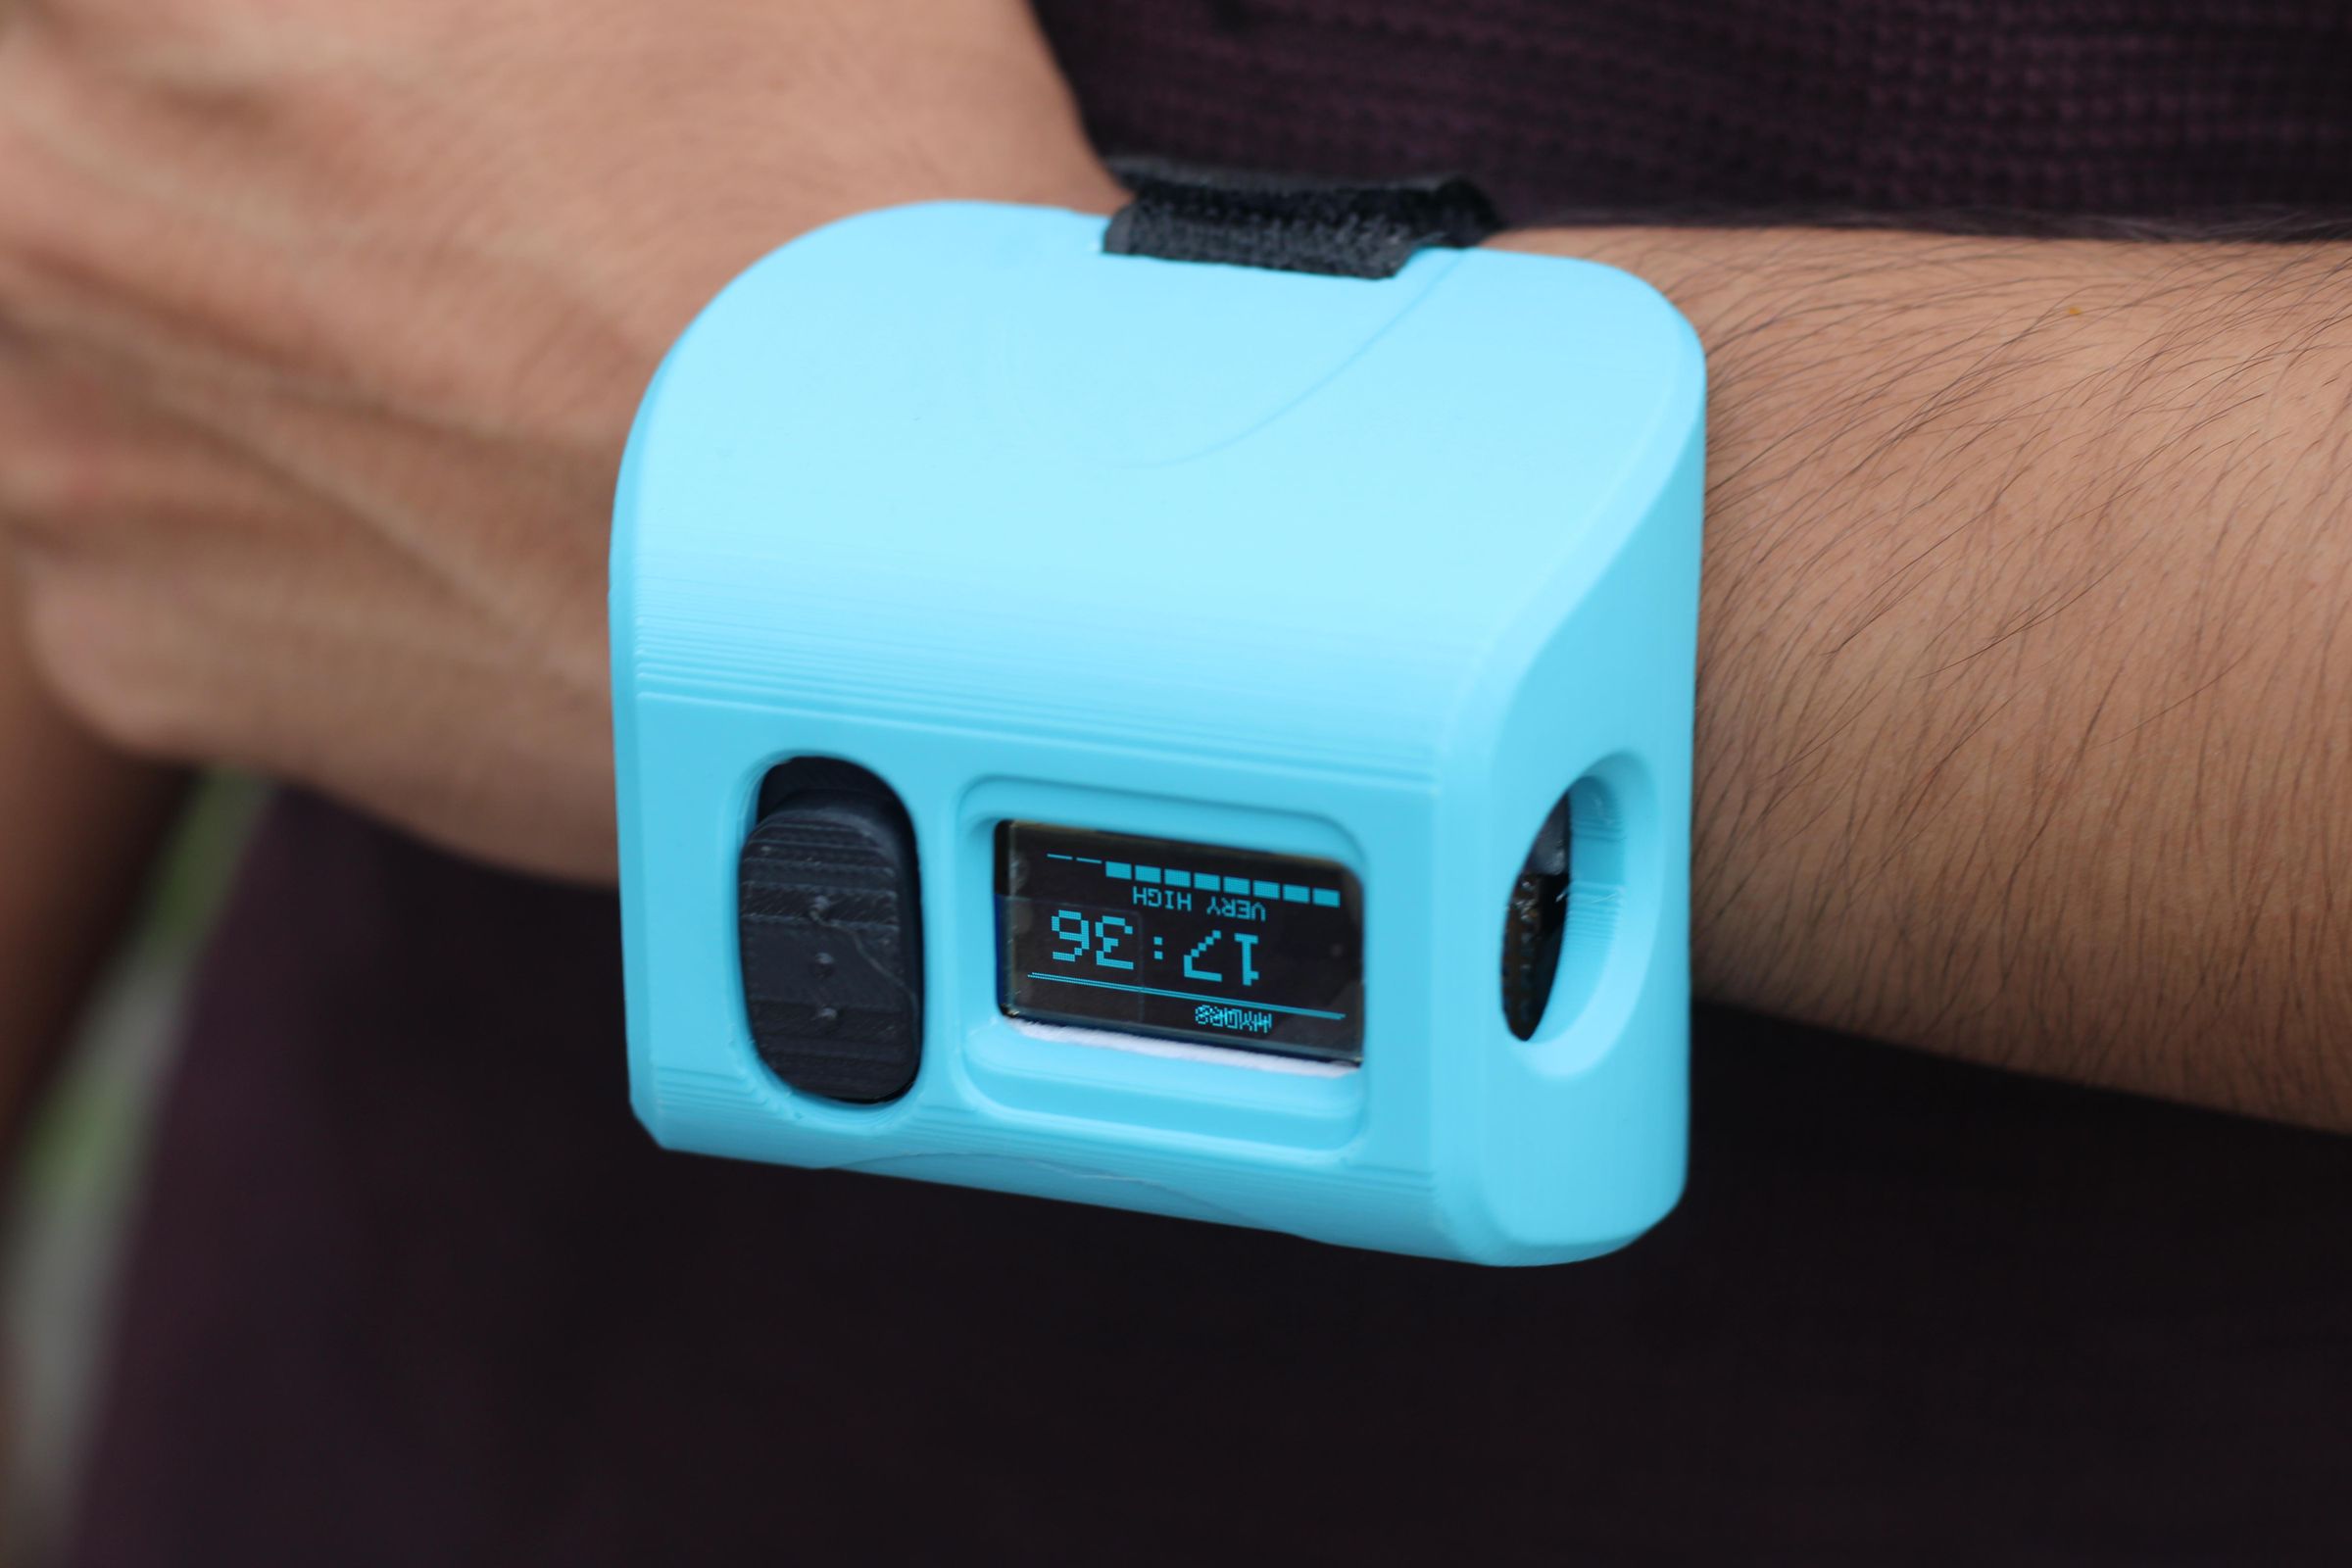
The band is deliberately dumb. It shows the time, and it takes over the screen when something matters, so DRINK WATER or COOL DOWN, then it goes back to being a clock. That's all. A wearable that demands attention constantly gets taken off and left in a drawer.
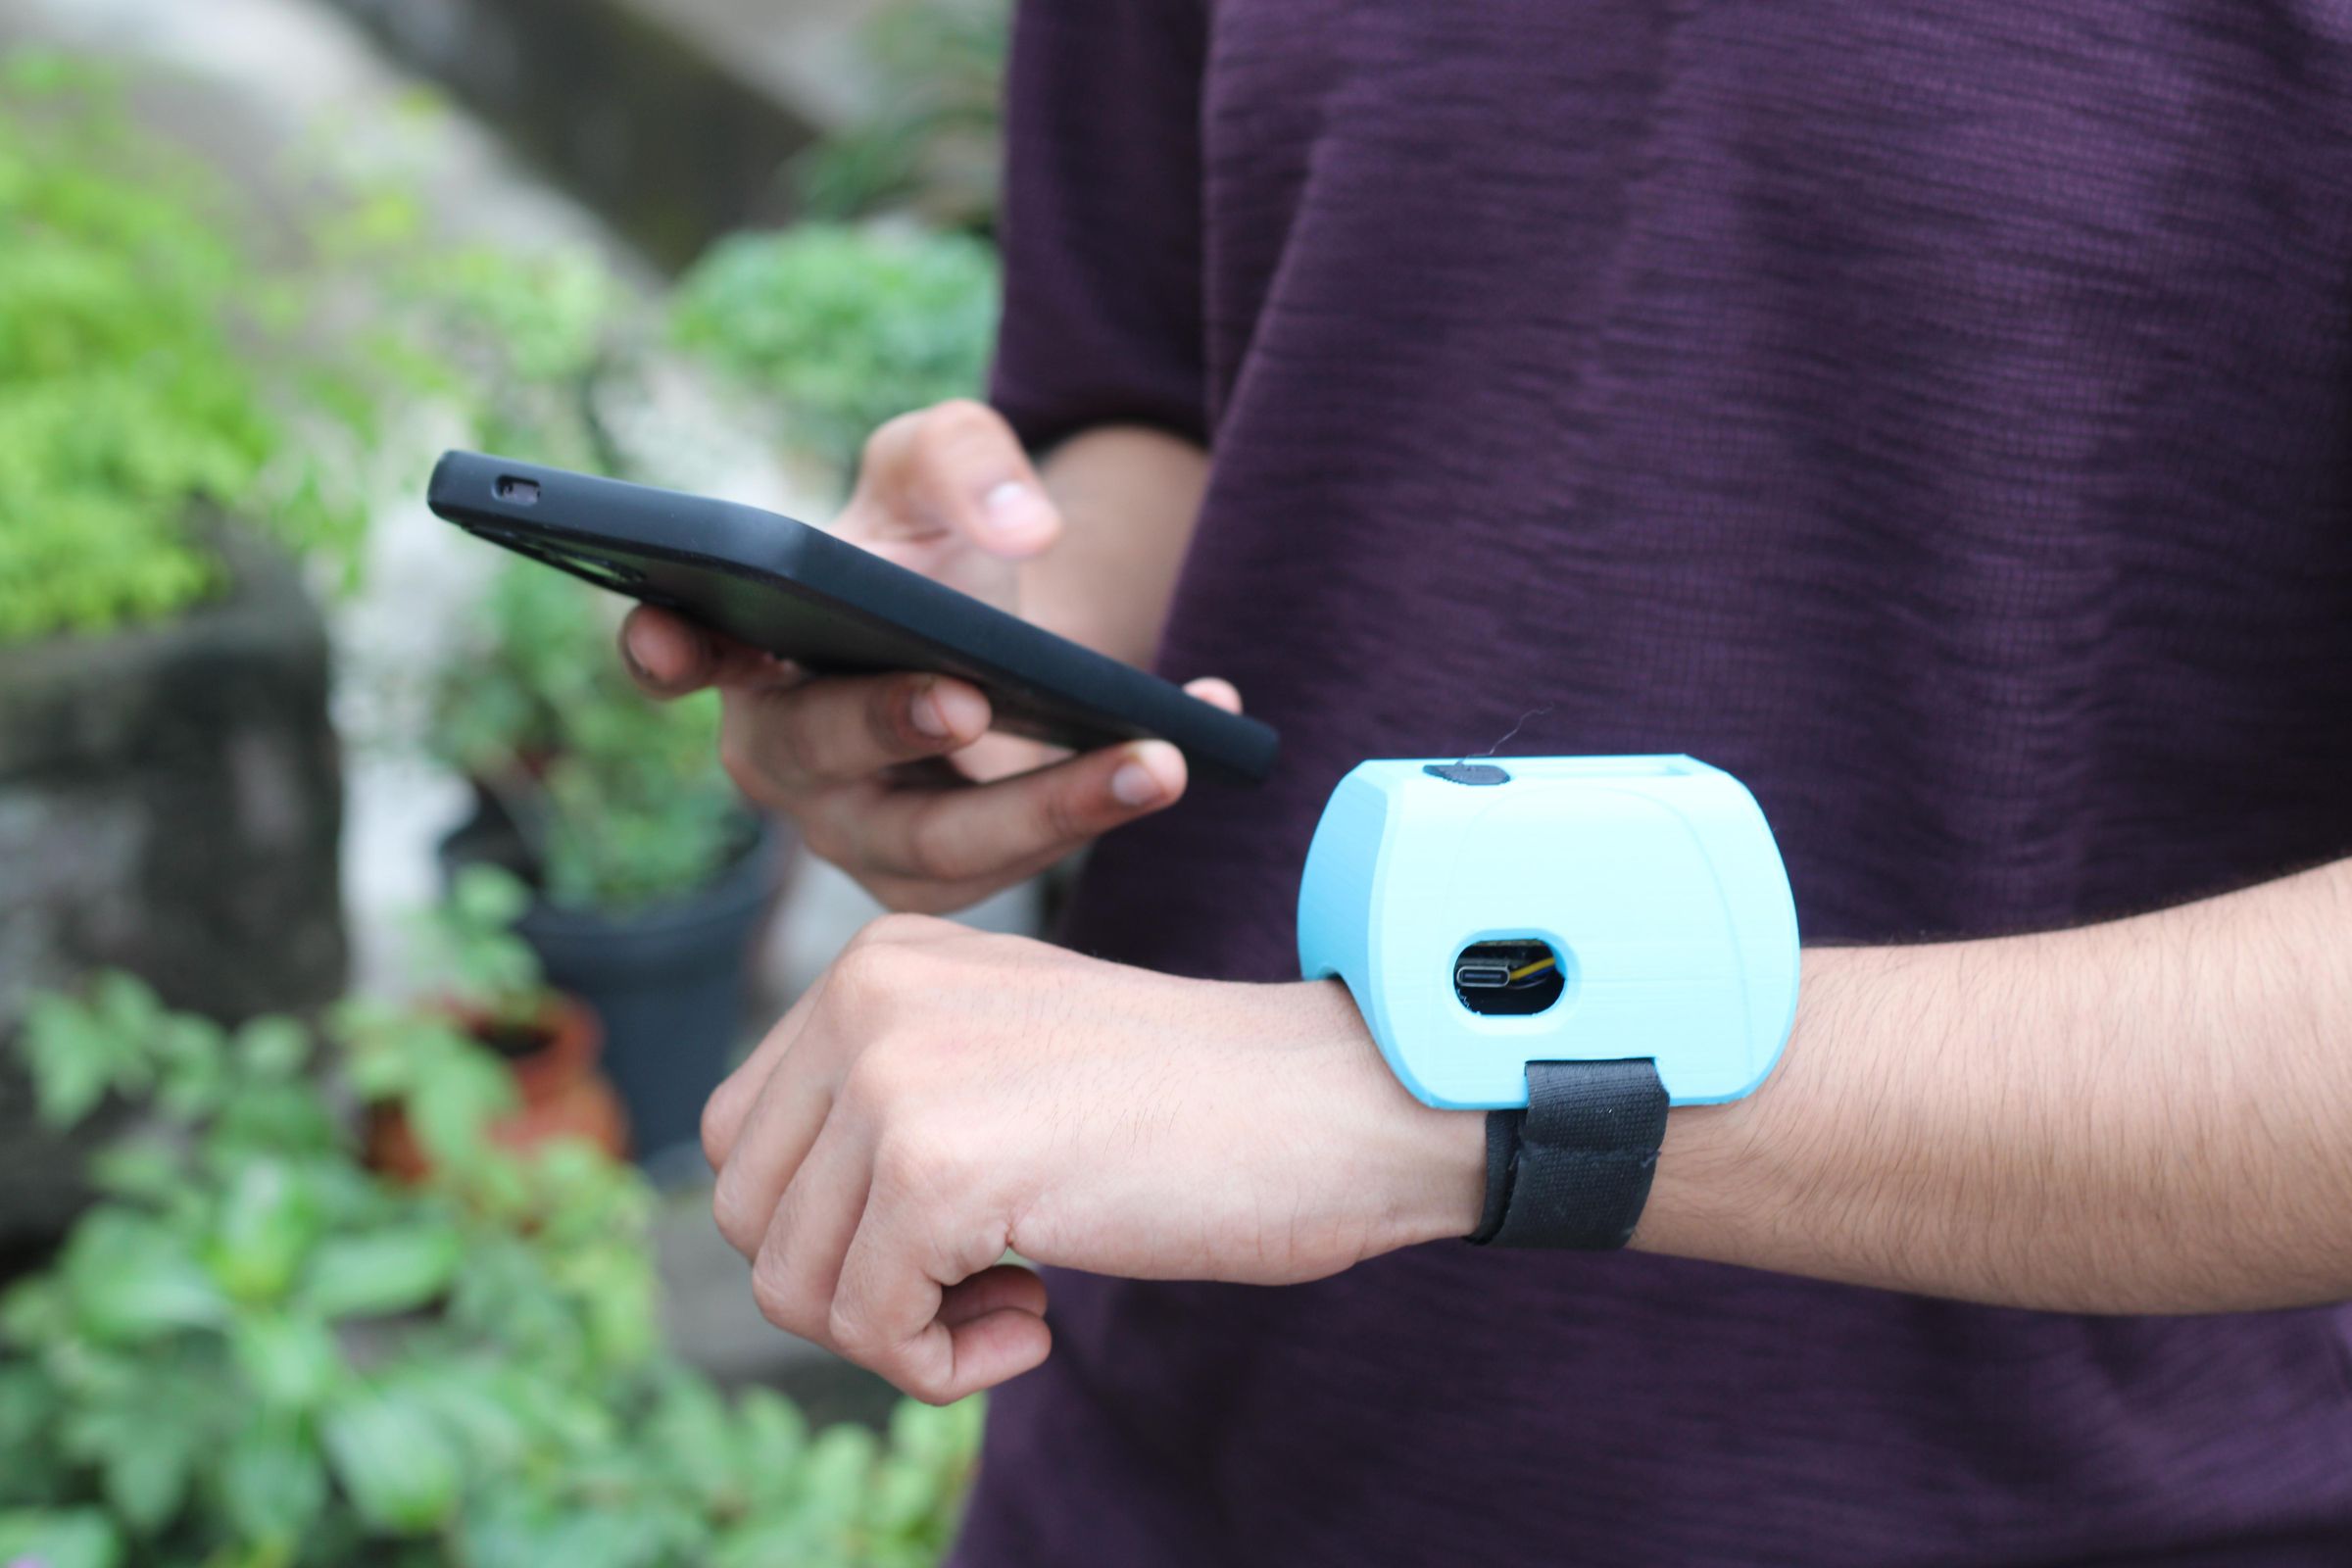
The phone is where everything lives. The ESP32 hosts a full dashboard itself: live readings, your score broken into its contributions, charts, a hydration log, history, and simple insights. No app to install, no cloud account, no internet connection needed. You open a web page and it's there.
Reminders adapt as well. The interval stretches when you're cool and comfortable, shrinks as stress rises, and gets skipped entirely if your score is high and climbing fast. There's still a hard floor so it can never nag you every thirty seconds.
How all of this is actually calculated is Section 12. For now, that's what it does.
Designing the Band
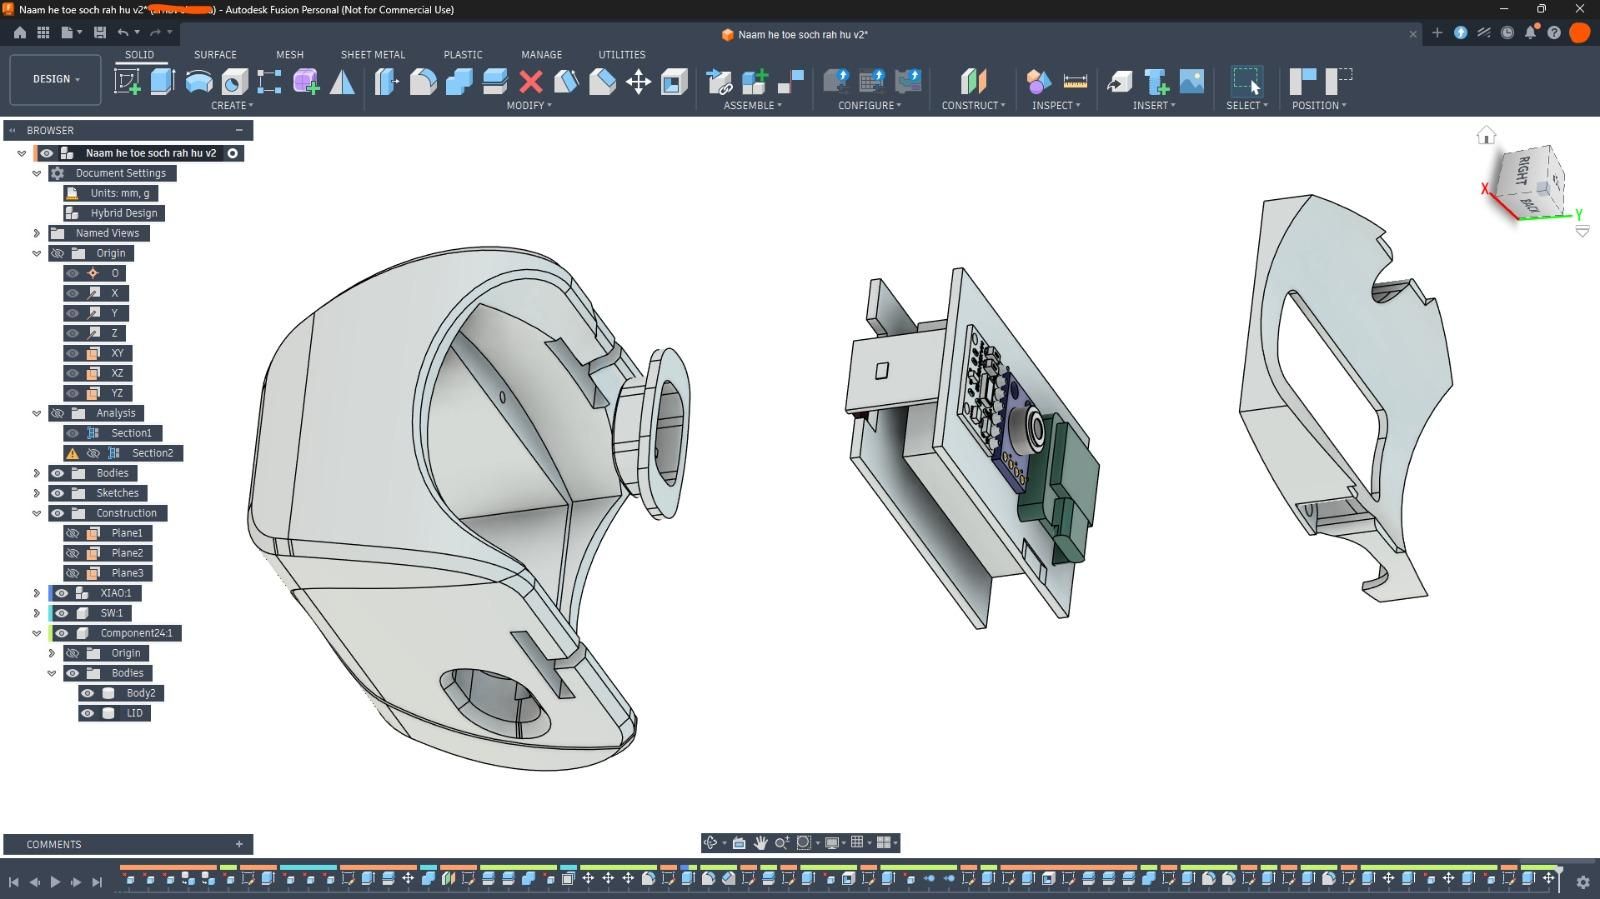
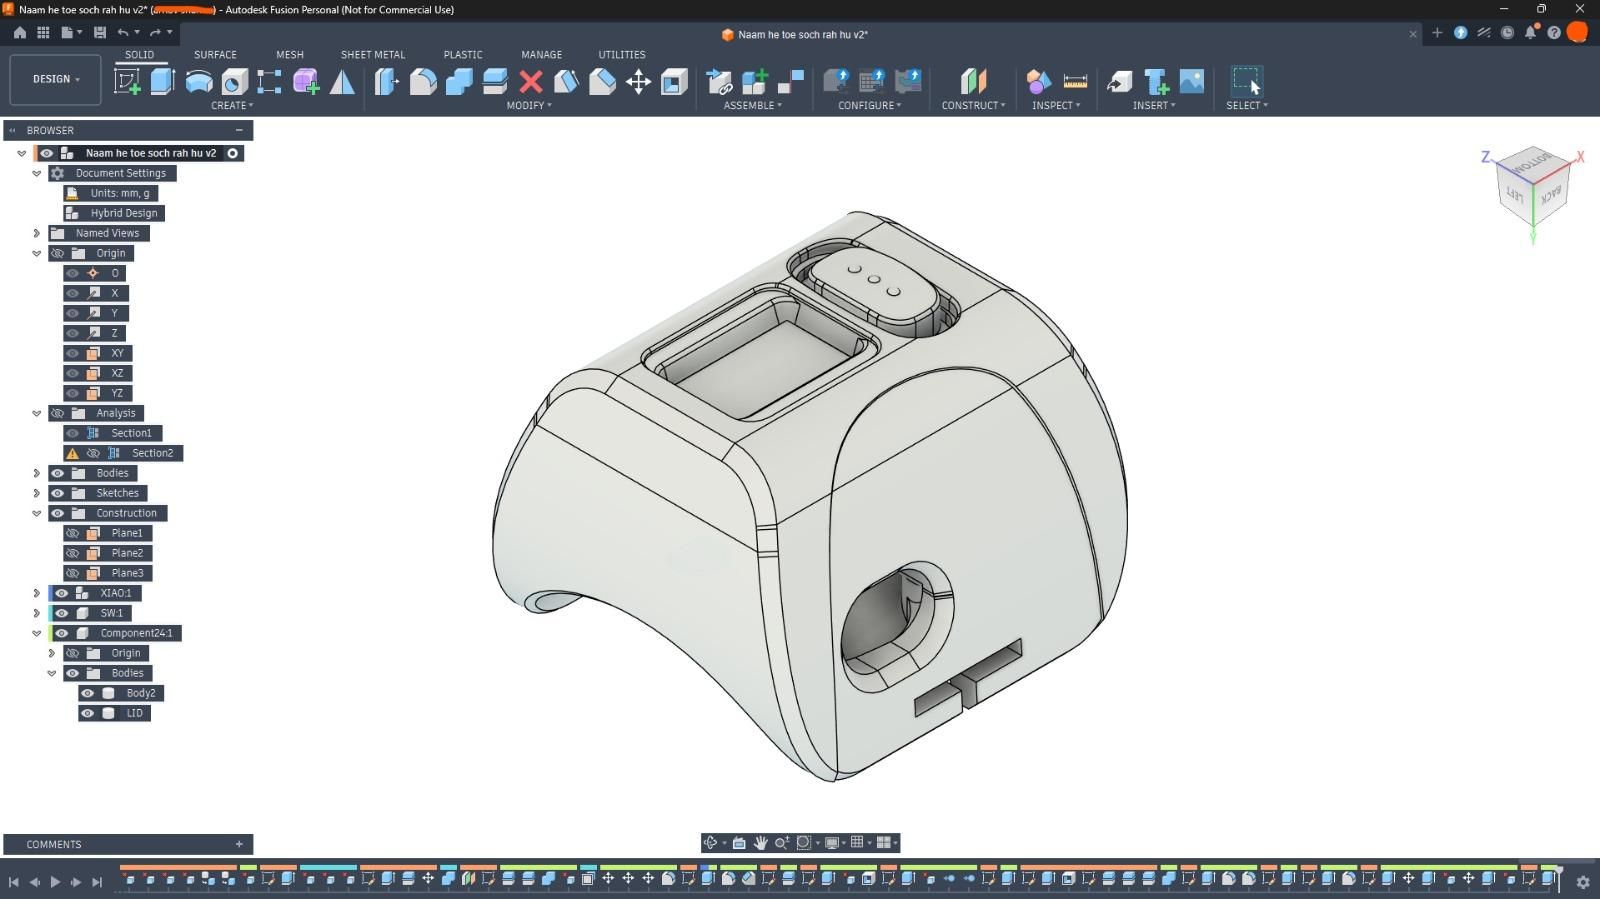
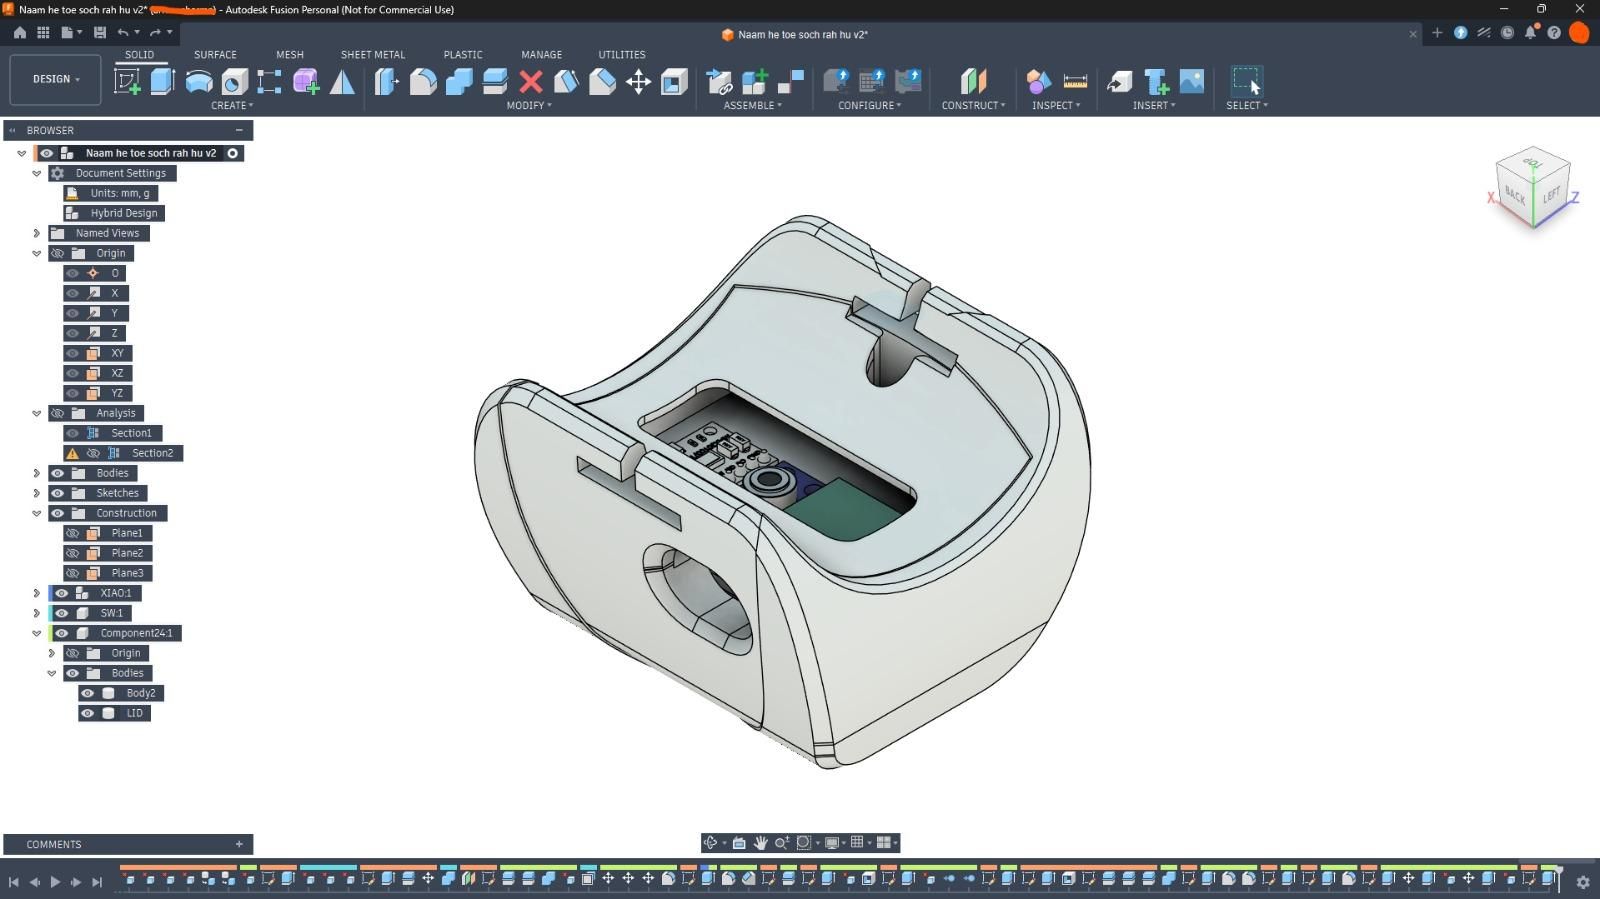
I didn't want HYDR8 to look like a small rectangular electronics box strapped to my wrist. With all the sensors and electronics inside, it would have been very easy to end up with a chunky rectangular block.
Instead, I went for a more fluid, organic form, inspired by the smooth, almost liquid-metal shapes you see in some modern watches and futuristic hardware.
The idea was to make the enclosure feel like one continuous object rather than a collection of components stuffed into a box. I used rounded surfaces and flowing curves around the edges while keeping the top relatively flat so the OLED and sensors could sit properly.
The shape also had to work around the electronics. The OLED needed a clear opening, the MAX30102 had to sit where it could make proper contact with the wrist, and the other sensors needed their own openings without making the enclosure look cluttered.
So the design was basically a balance between making the electronics fit and making the electronics disappear into the form.
That was the part I liked most about designing HYDR8. Instead of hiding everything inside a generic box, the enclosure itself became part of the project.
Downloads
Printing the Enclosure
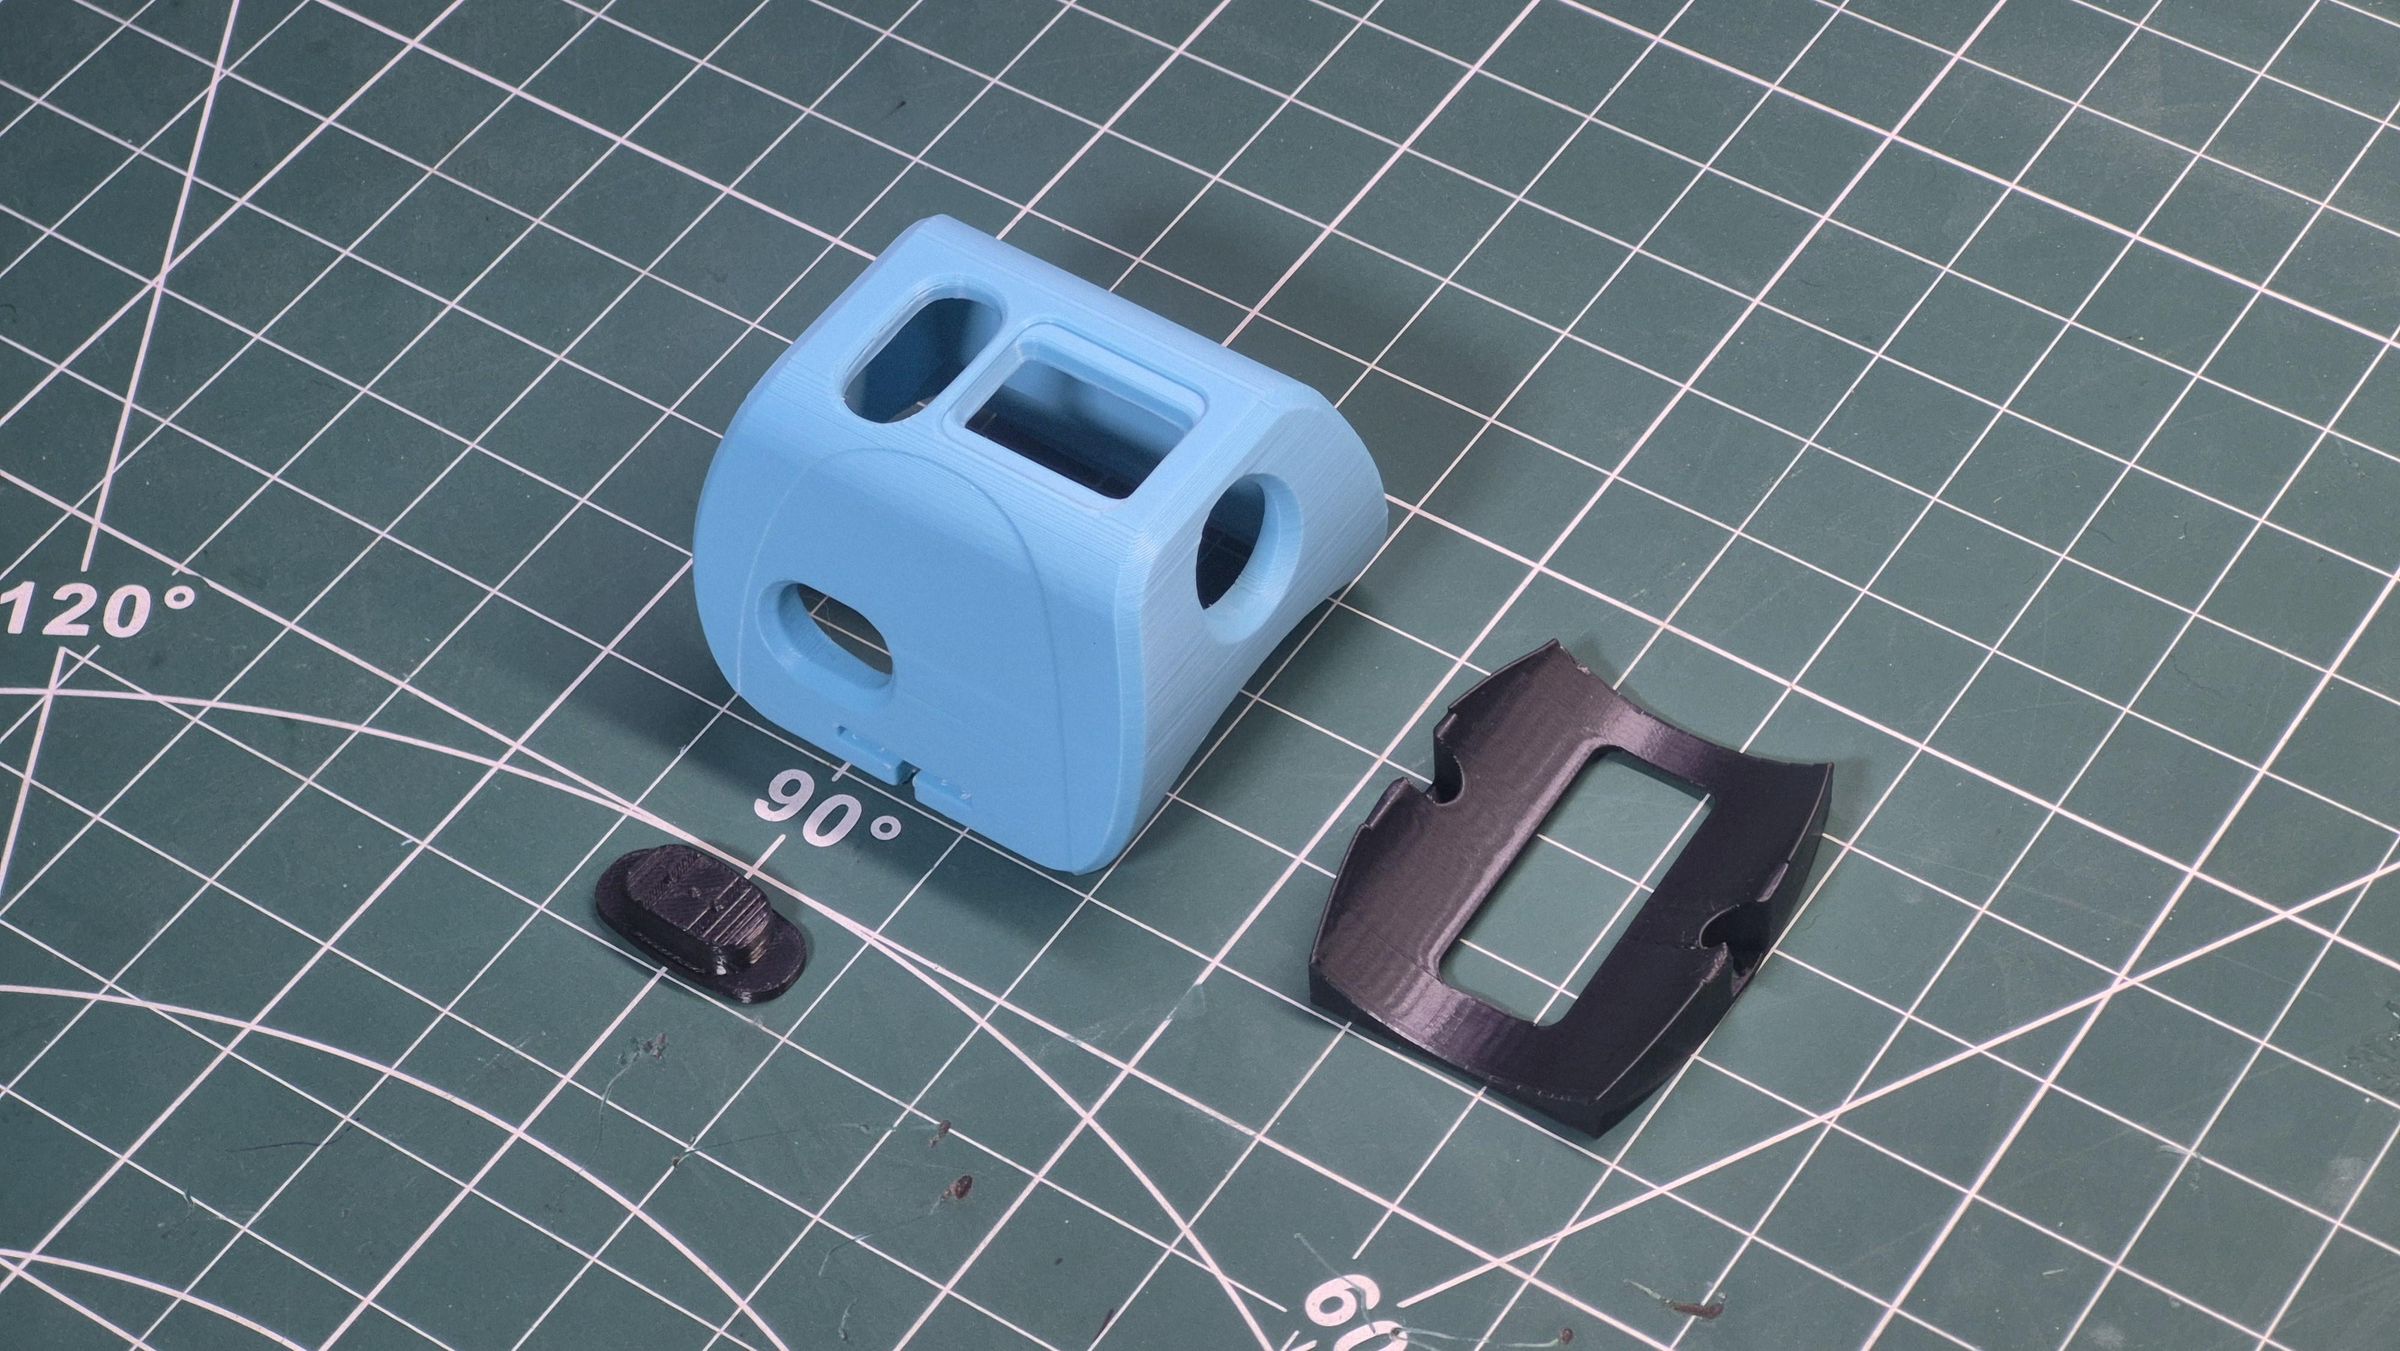
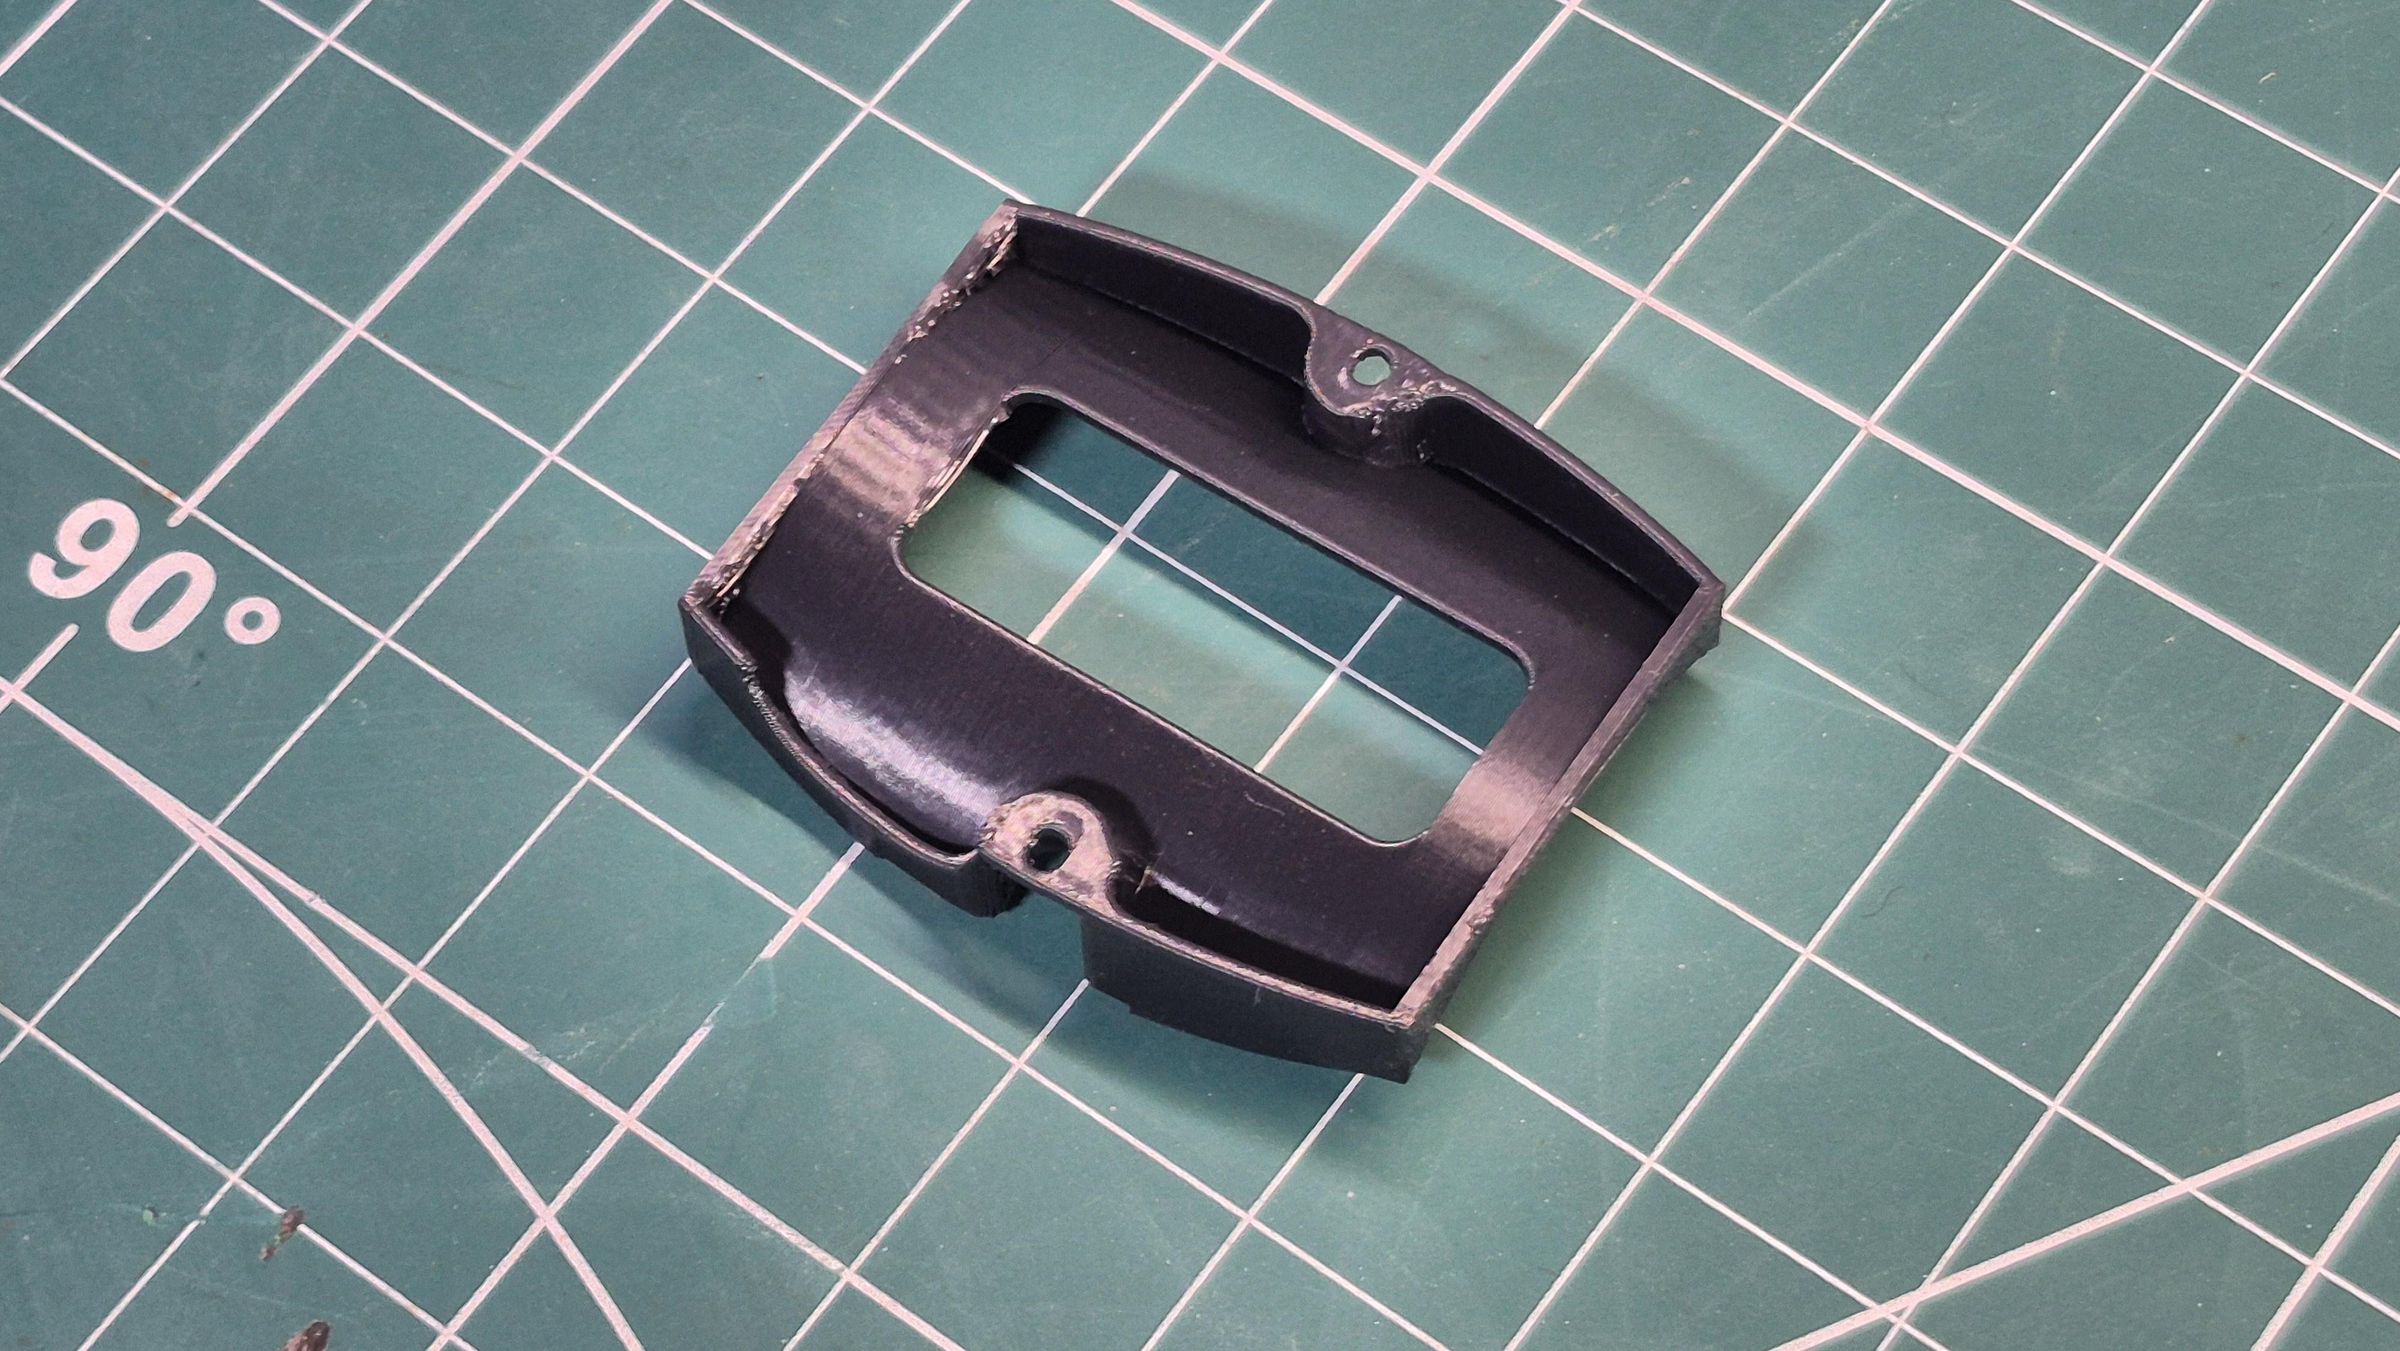
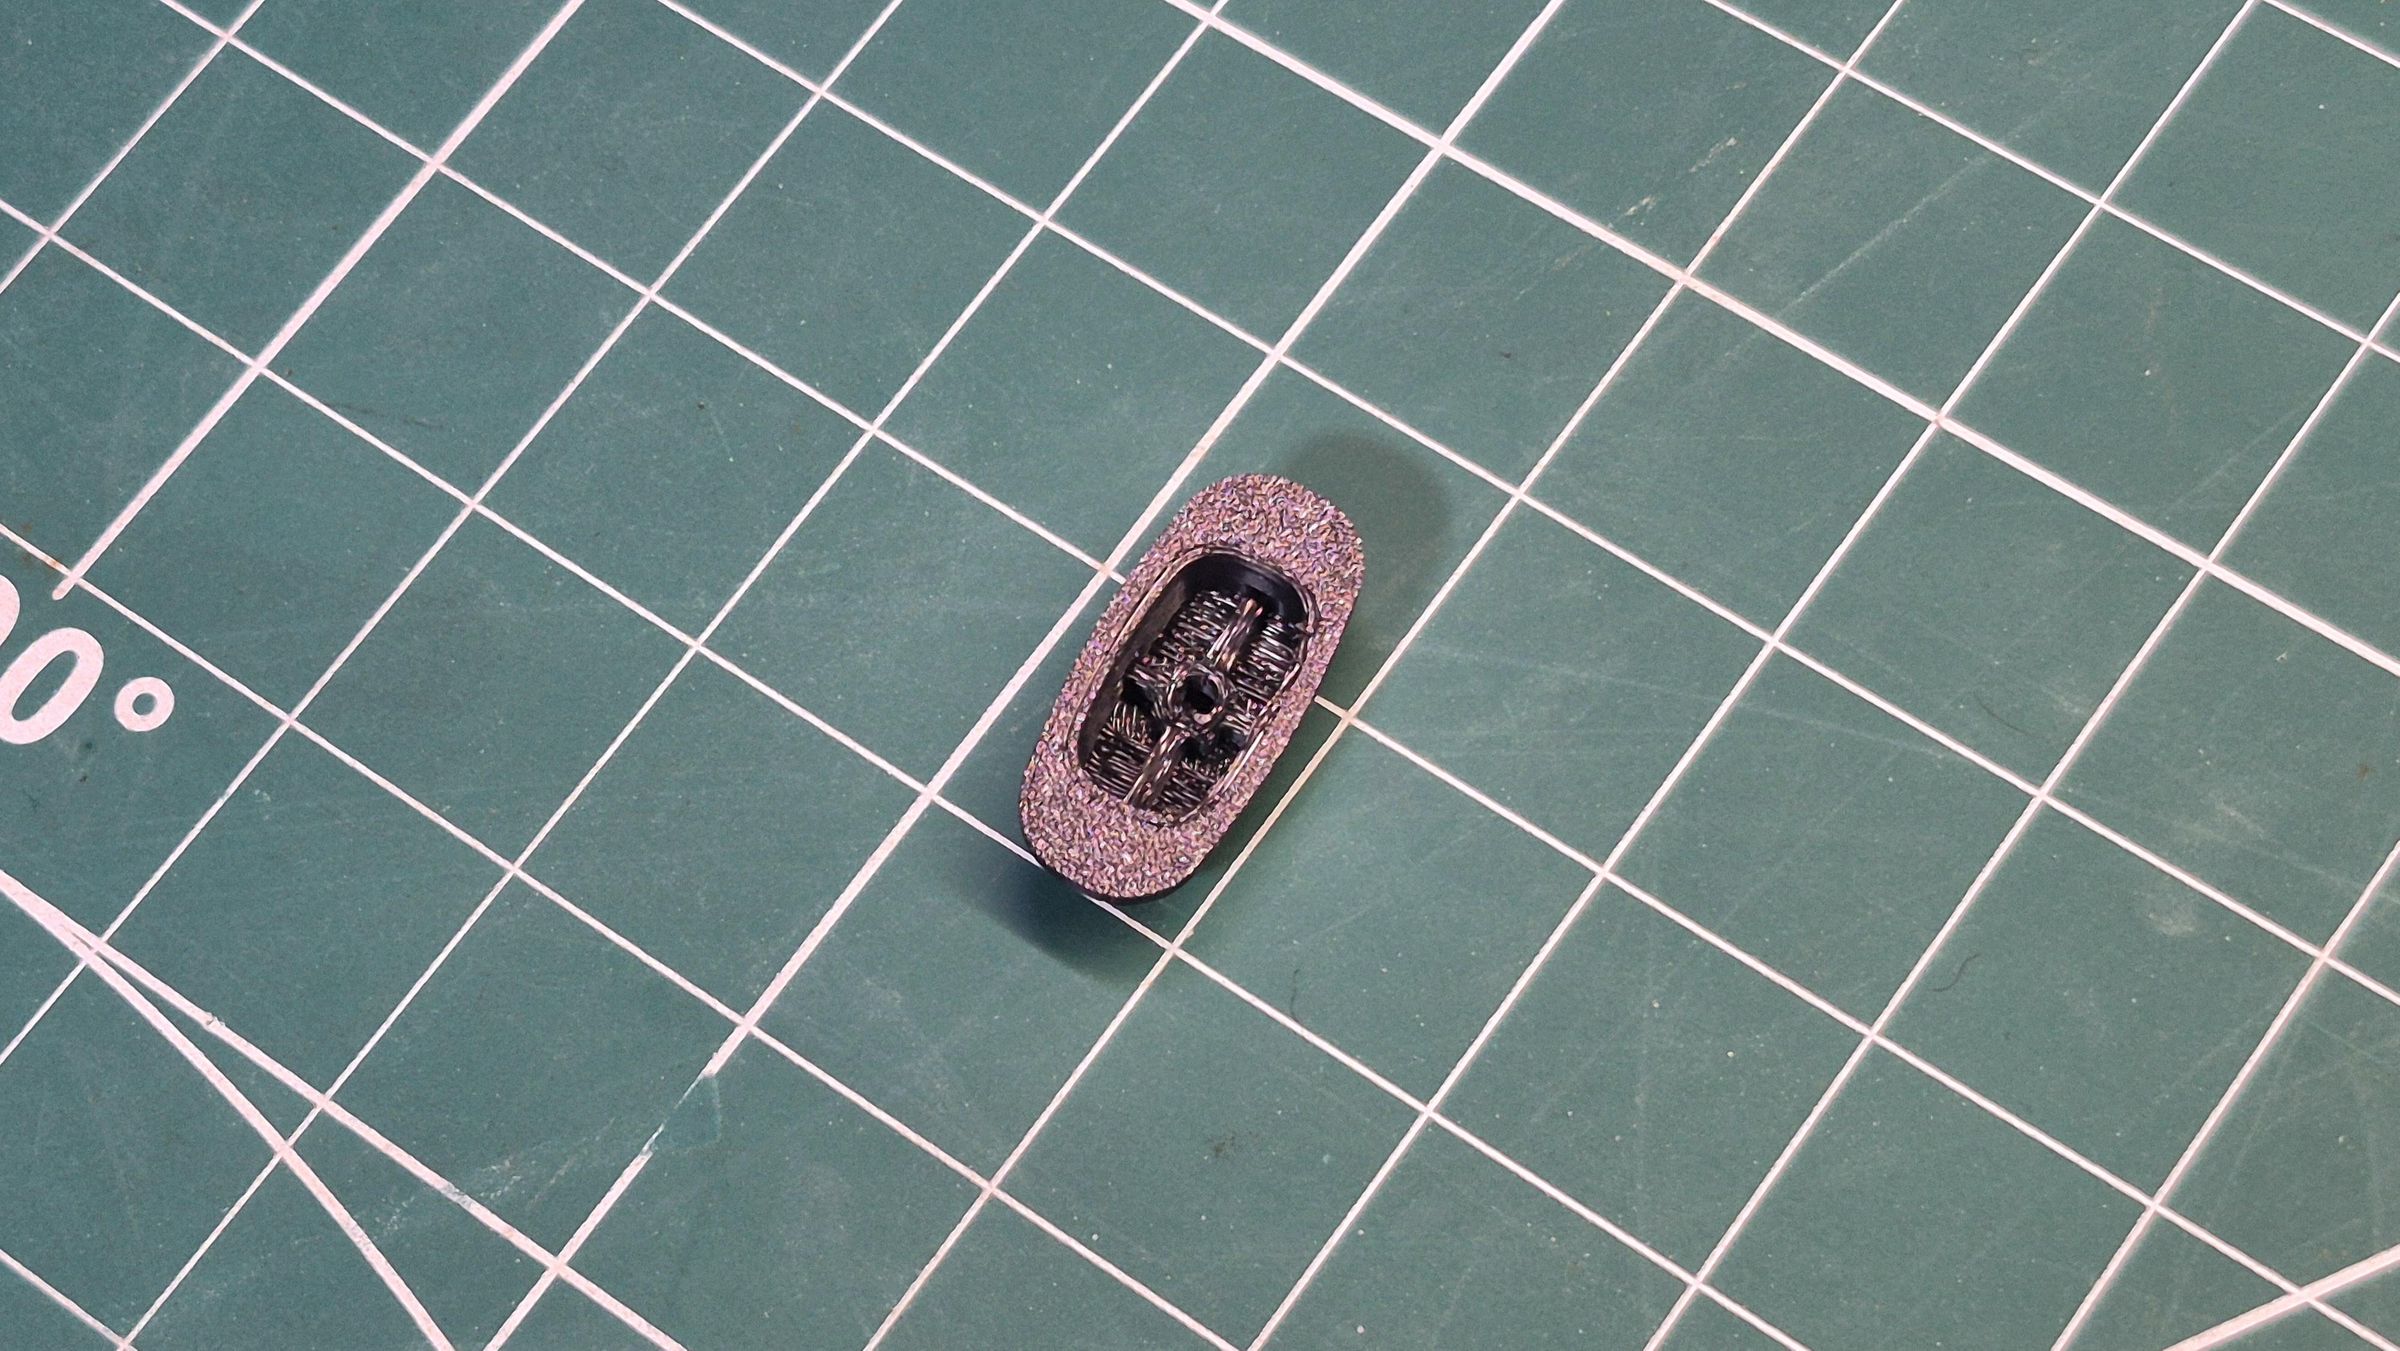
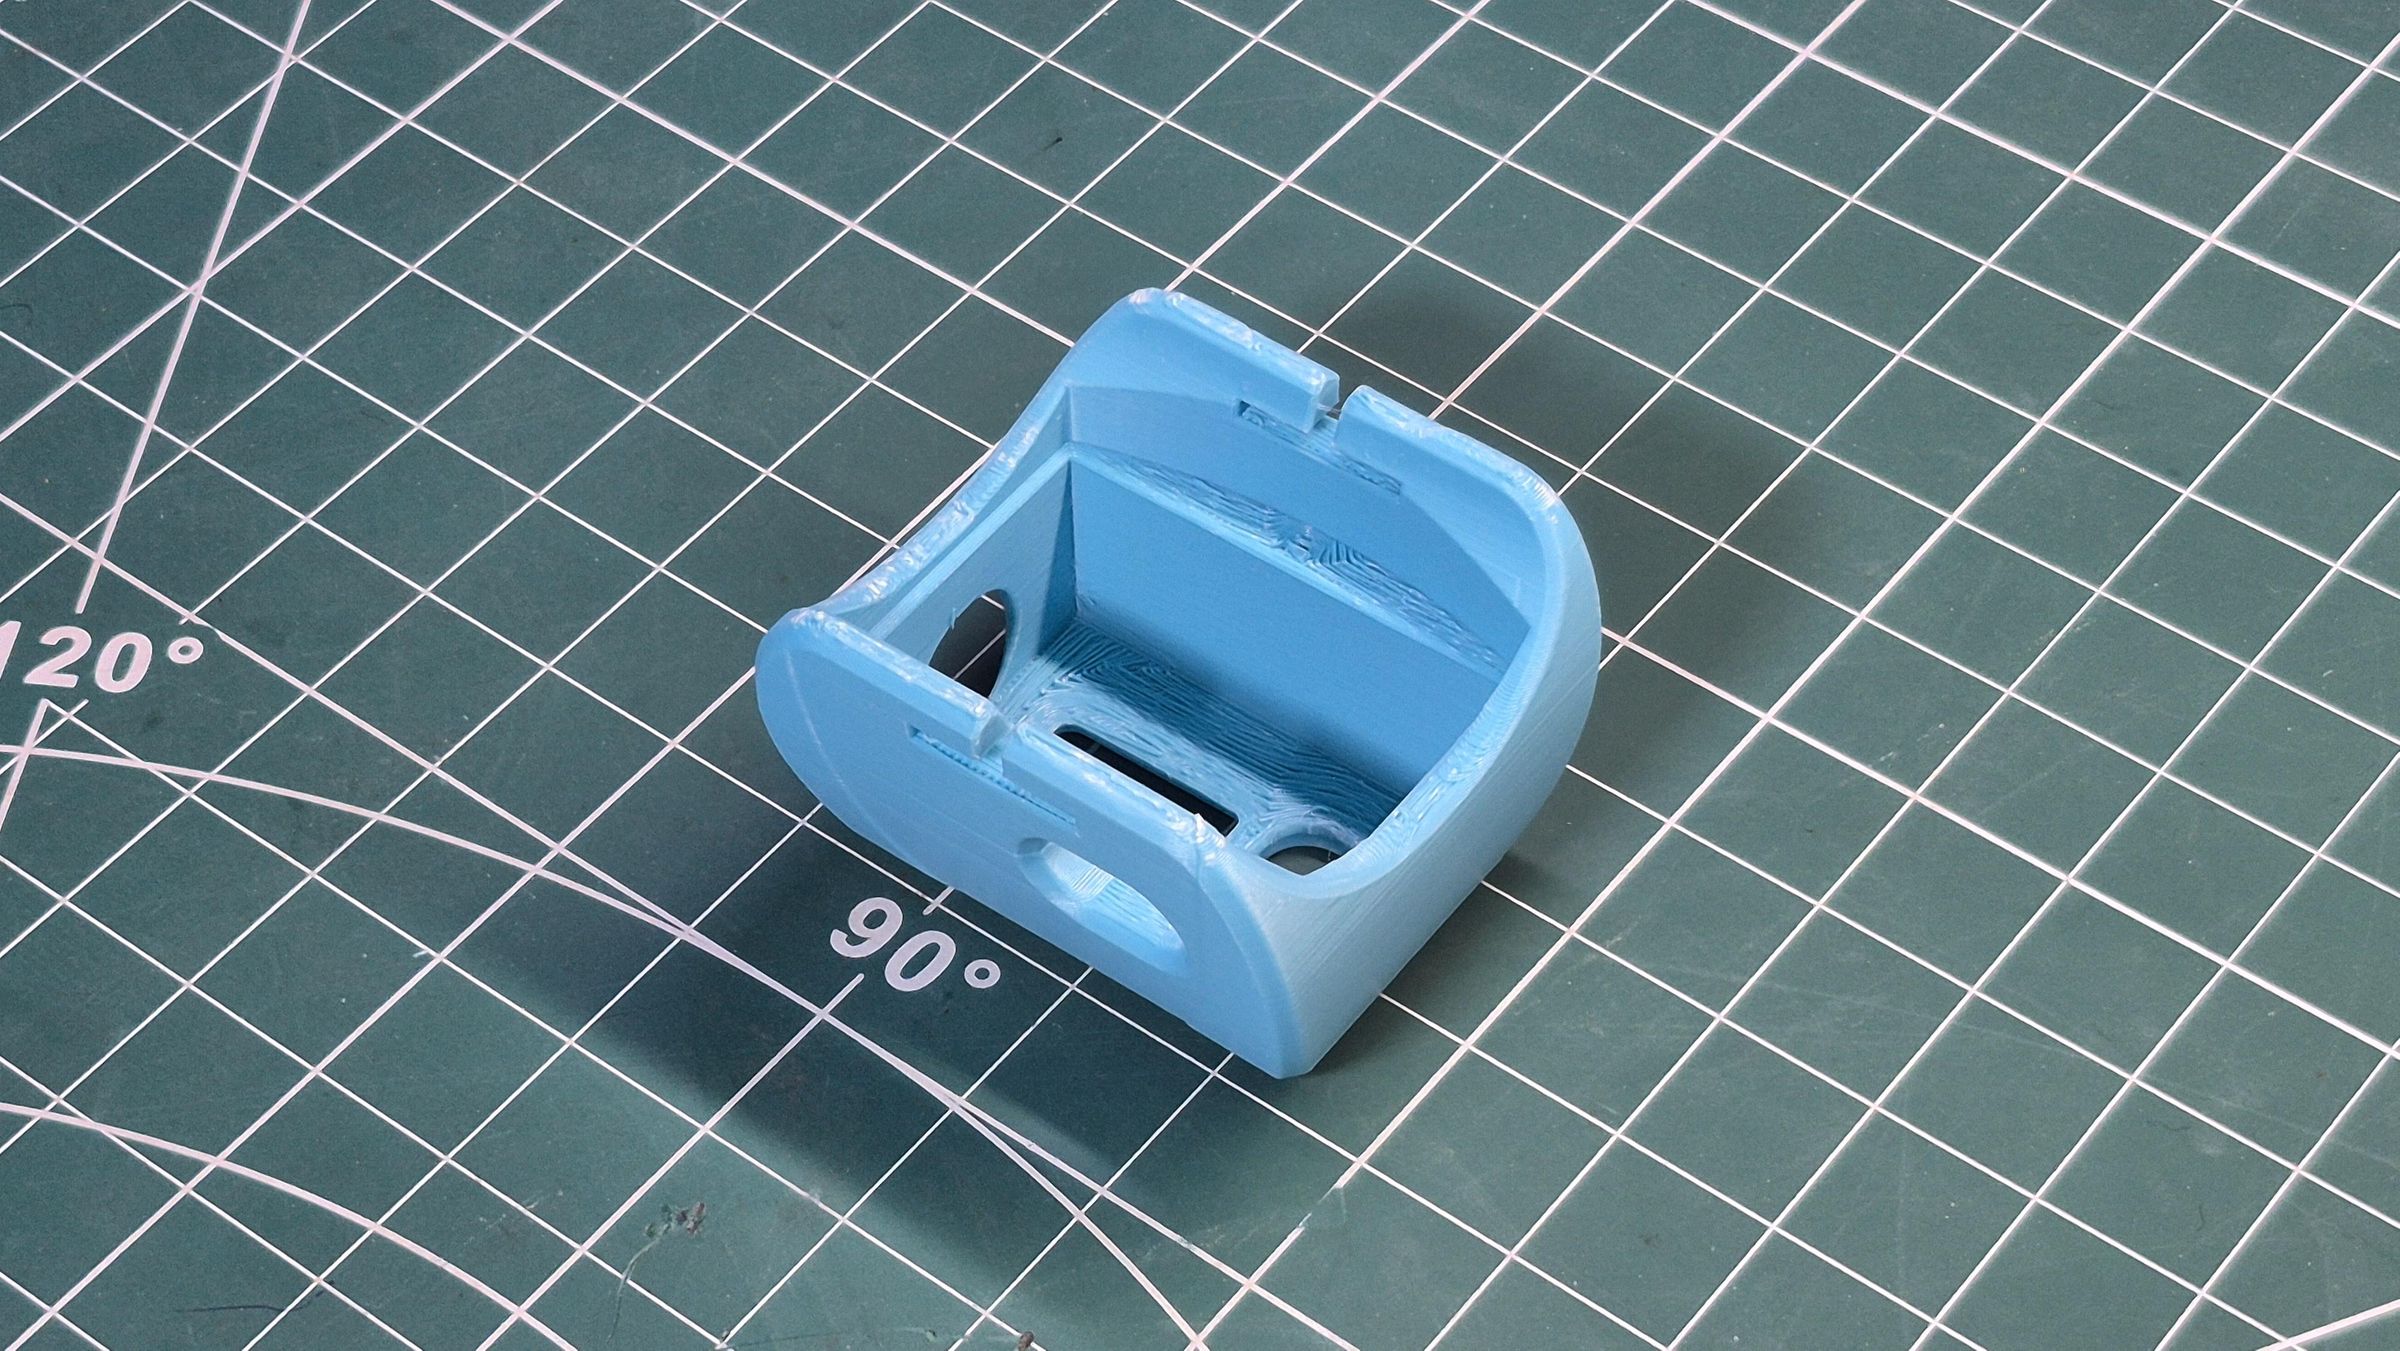
Once the enclosure was finalized in Fusion 360, it was time to turn the model into an actual wearable.
For the main body, I used aqua-colored filament to give HYDR8 its bright, clean look. The switch was printed separately using black filament, which gives it a nice contrast against the main body.
The enclosure was printed in separate parts so that the electronics, display and sensors could be fitted properly during assembly. After printing, I cleaned up the parts and checked the fit of the OLED, sensors and switch before moving on to the electronics.
The most important part here was getting the openings and clearances right. The OLED needed to sit flush with the top surface, the sensors needed to line up with their openings, and the switch had to move freely without getting stuck.
Once everything fit properly, the printed parts were ready for assembly.
Designing the Circuit
Before cutting the perfboards or soldering anything, I first worked out the complete circuit and how each module would connect to the XIAO ESP32-C3.
The MAX30102, MLX90614 and OLED all share the same I²C bus:
- GPIO 6 → SDA
- GPIO 7 → SCL
They also share 3.3V and GND.
The DFRobot temperature and humidity sensor is connected separately through its data pin, along with its power and ground connections.
Having the three I²C devices on the same bus keeps the wiring much simpler and helps save space inside the small enclosure.
Preparing the Perfboards
Instead of trying to fit everything onto a single perfboard, I decided to use two boards.
The bottom perfboard contains the main electronics: the XIAO ESP32-C3, MAX30102 and MLX90614. I also mounted the environmental temperature and humidity sensor vertically so that its sensing area remains exposed to the surrounding air.
The top perfboard is mainly for the user-facing parts, containing the OLED display and the power switch.
I first marked out the positions of the components and cut the perfboards to fit the enclosure. Before soldering anything, I placed the modules on the boards to make sure everything had enough space and that the two boards could eventually fit together.
The battery remains separate and connects to the electronics during the final assembly.
Soldering the Circuit
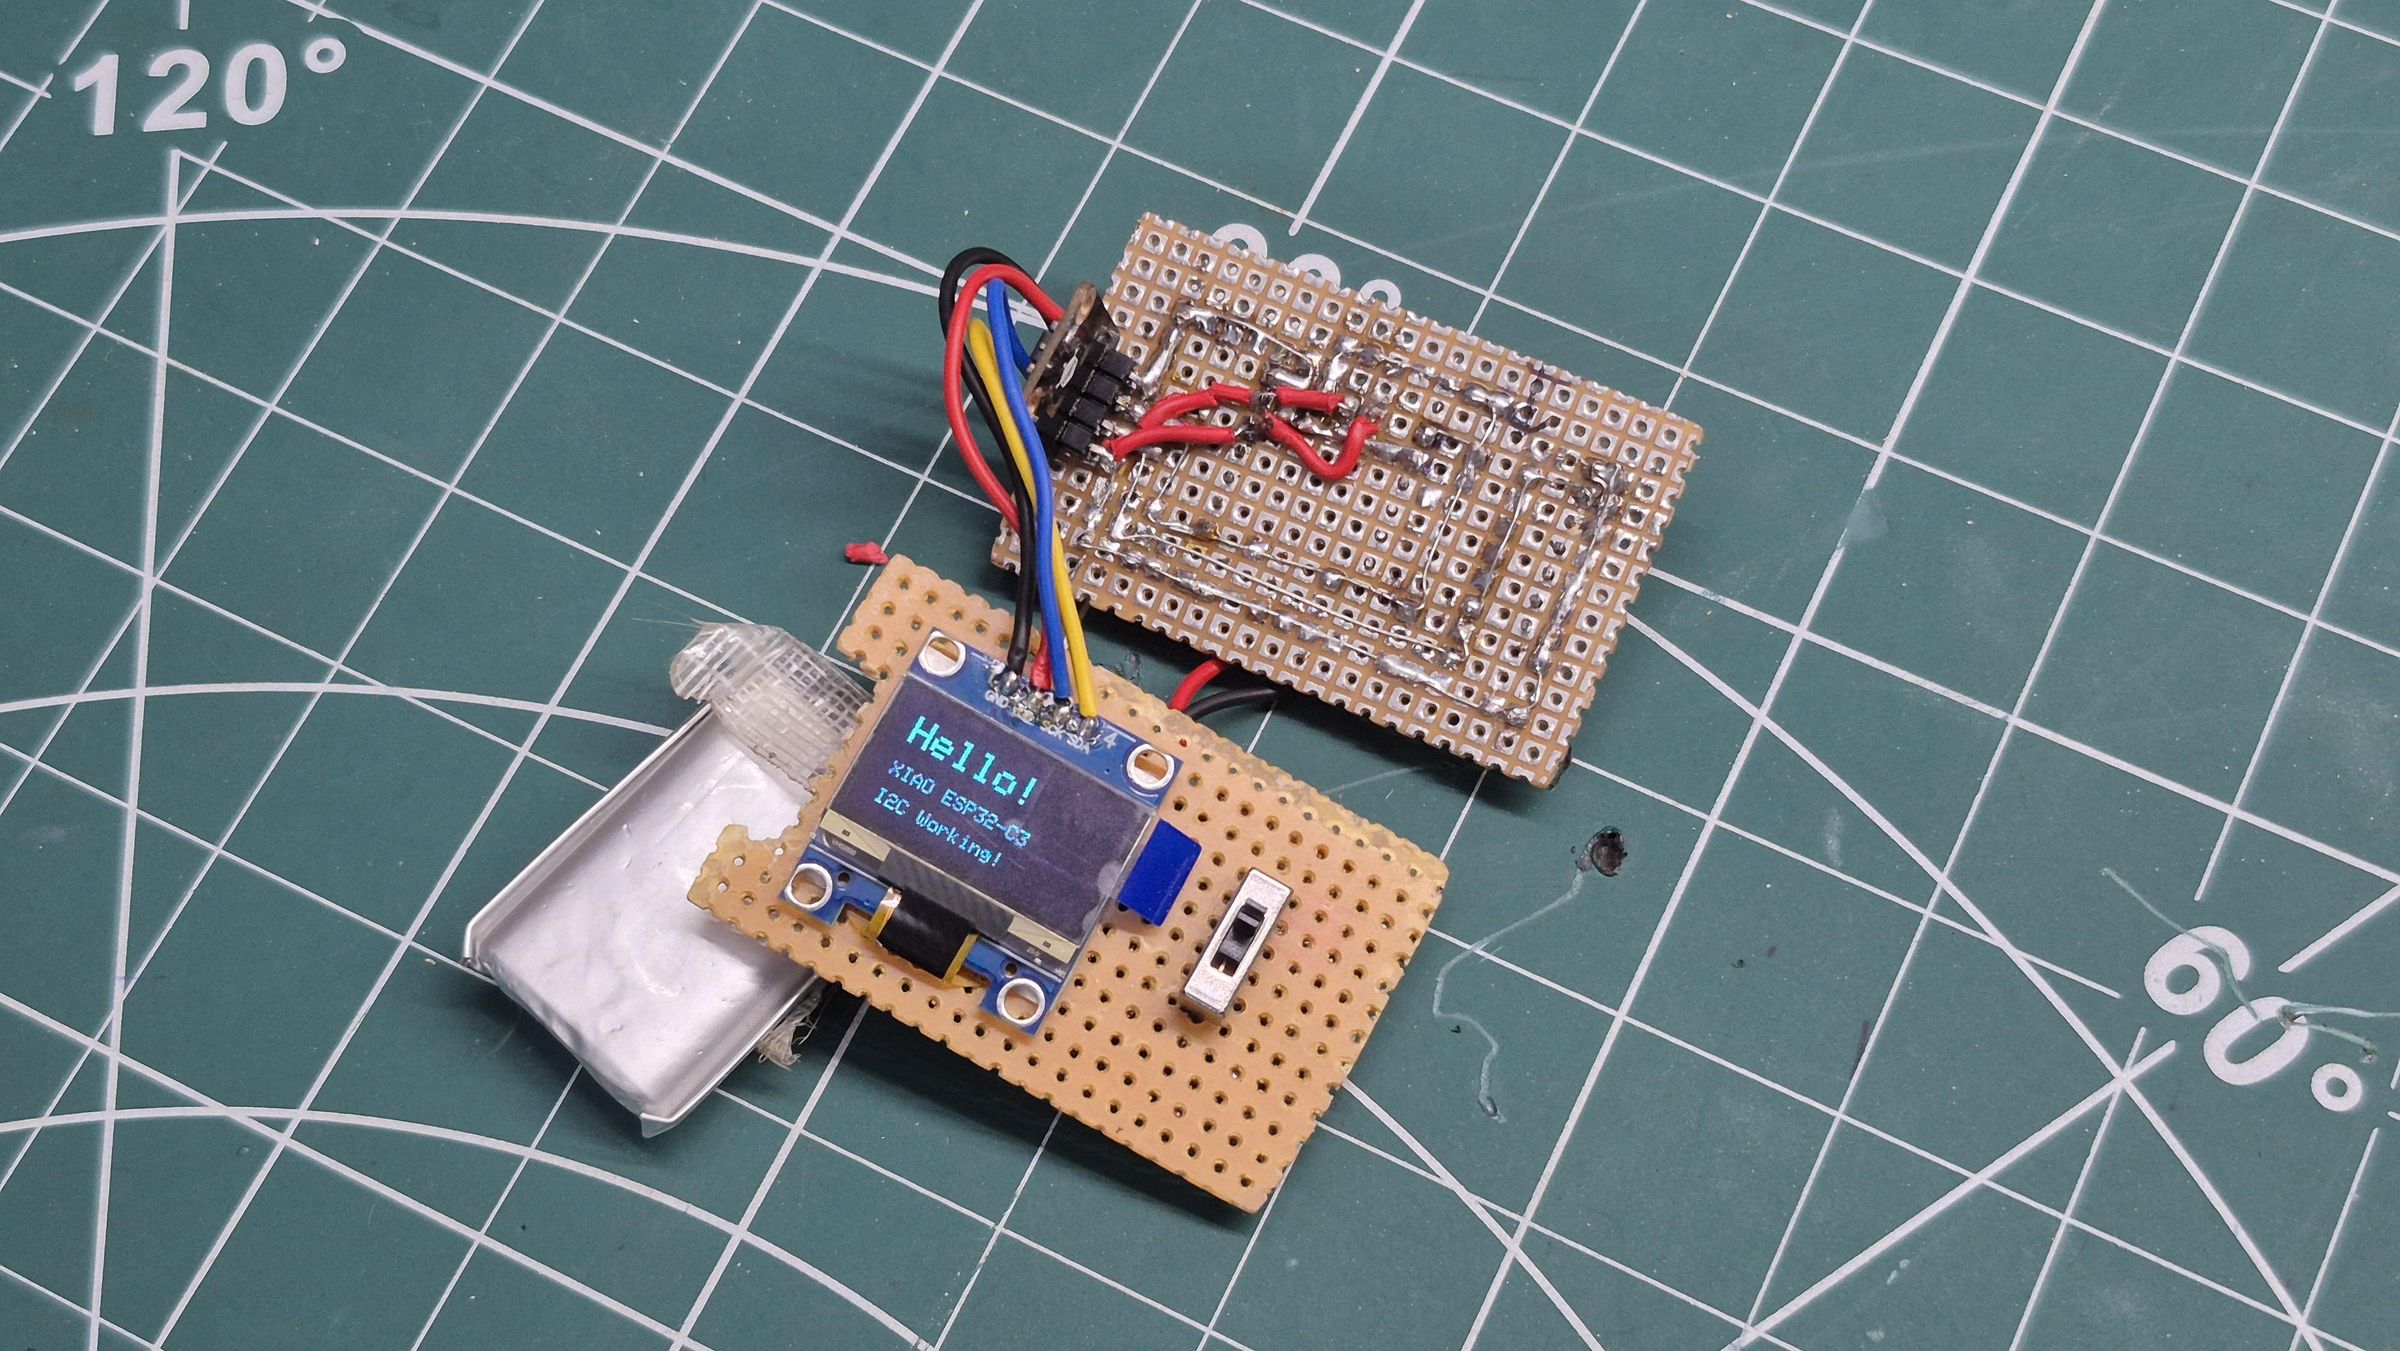
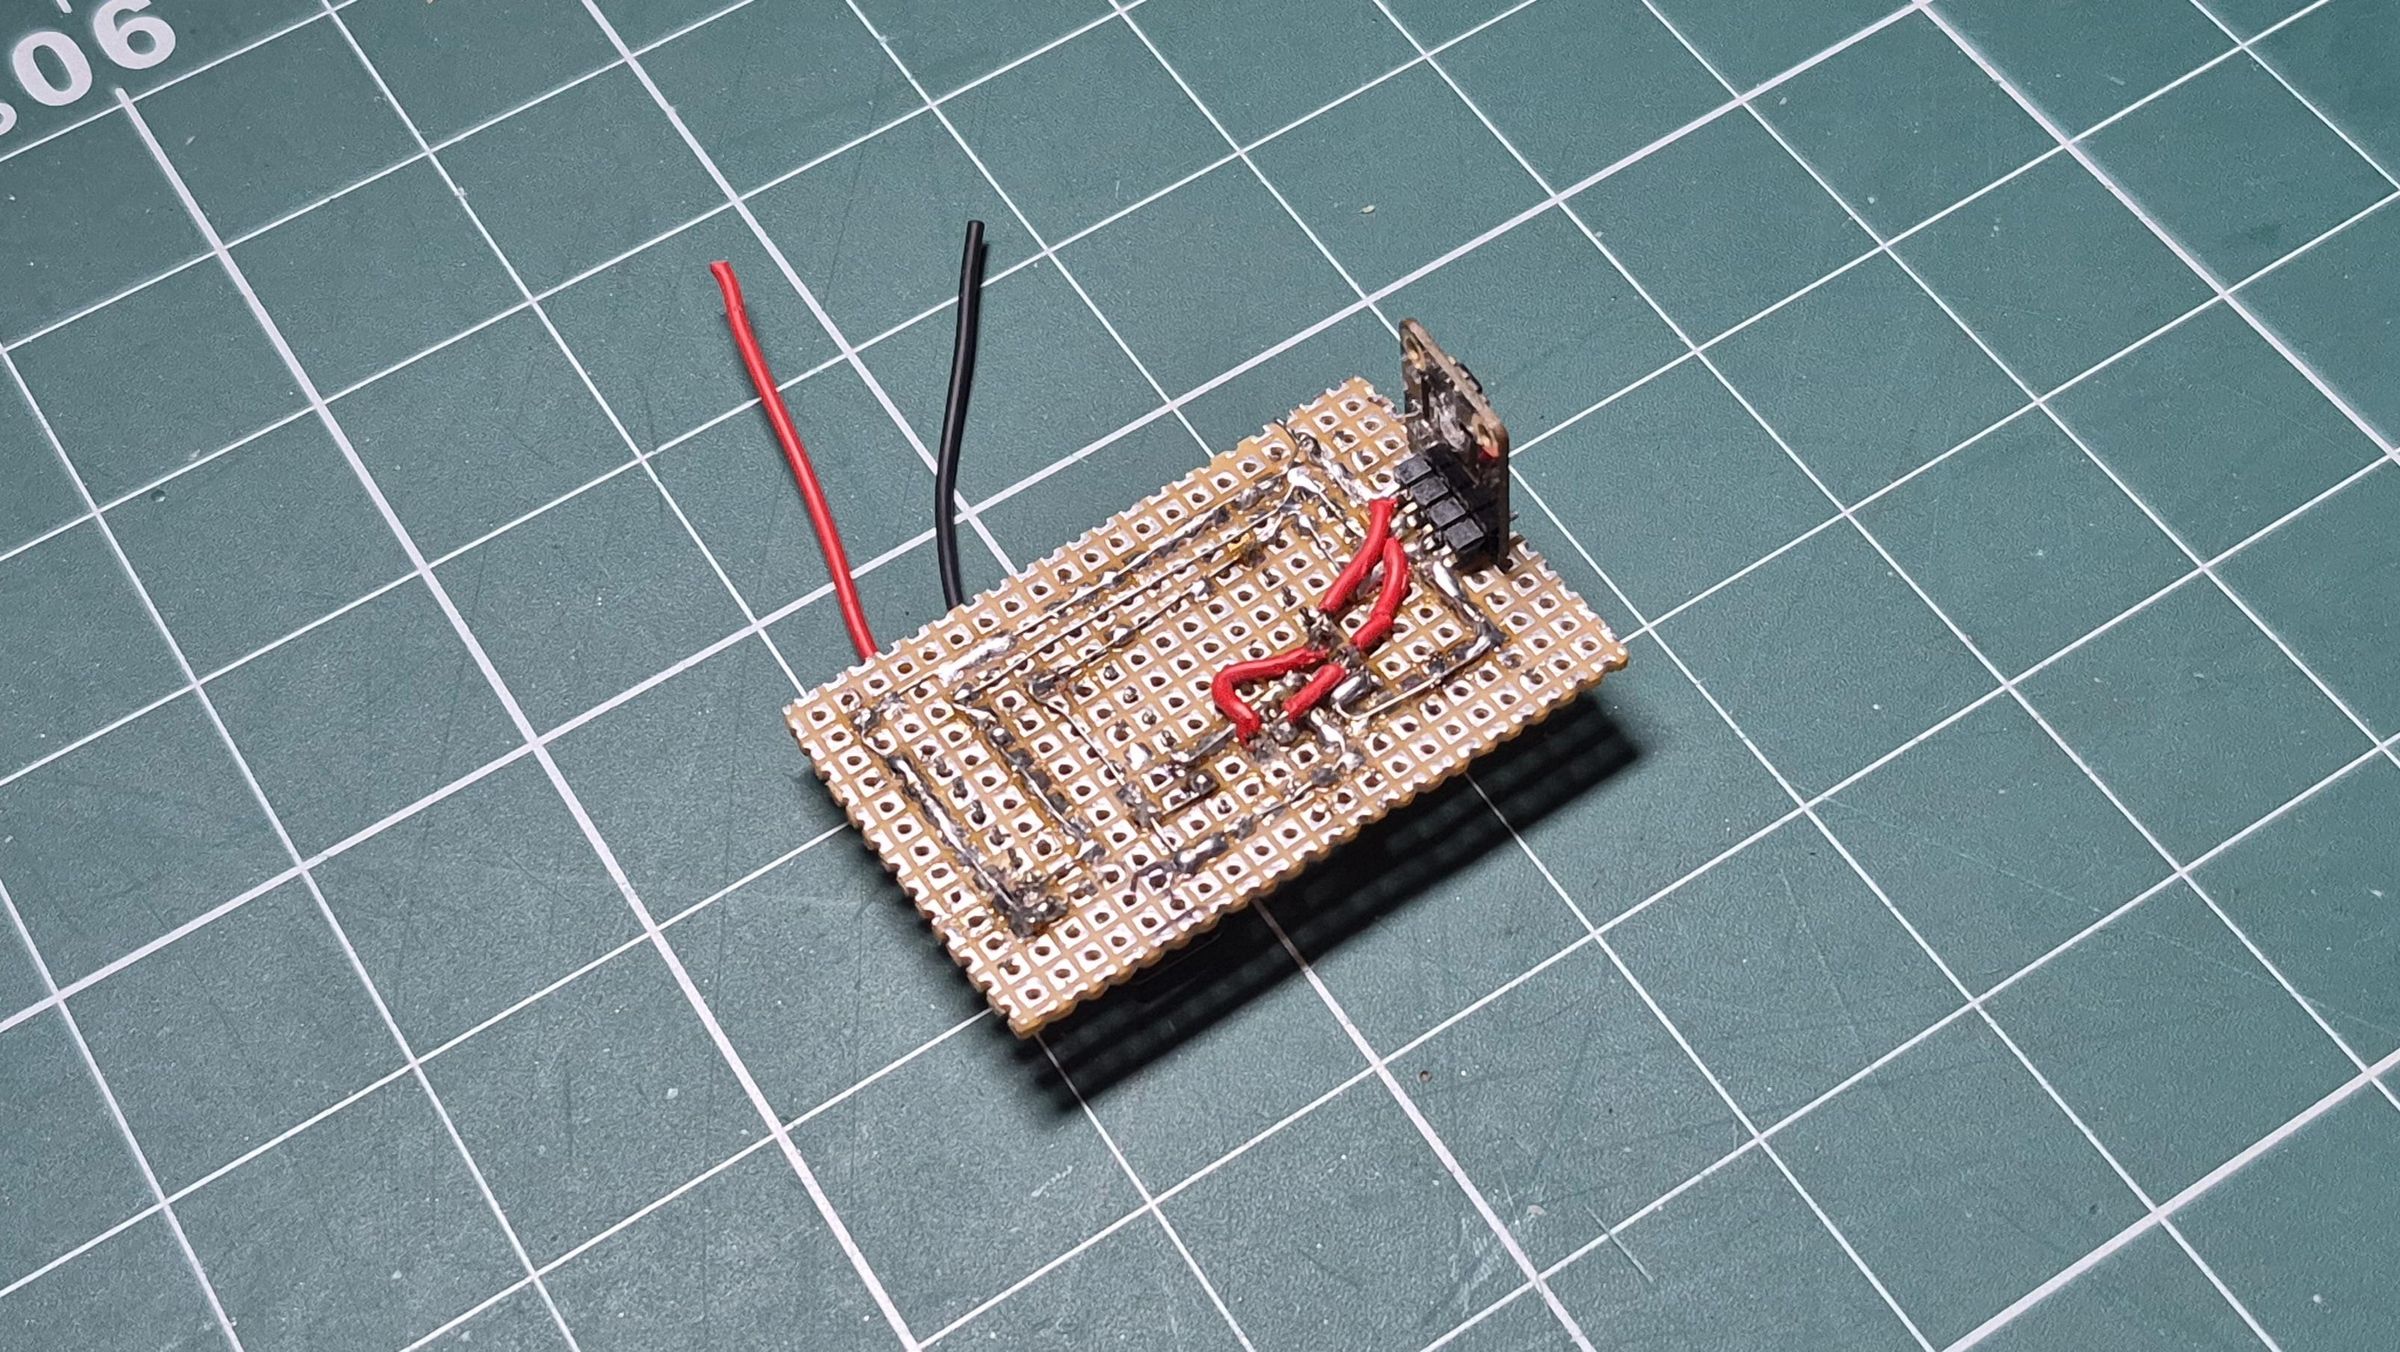
Once I was happy with the layout, I started soldering the components in place.
I kept the bottom board focused on the controller and sensors, while the top board handles the OLED and switch. This separation helped keep the wiring more manageable and made it easier to position the display where it would be visible from the outside.
I also tried to keep the connections as compact as possible because there isn't much spare space inside the enclosure. The I²C connections are shared between the relevant modules, while the power and ground connections are distributed across the boards.
After soldering, I checked the connections for shorts and continuity before connecting the battery or powering the board.
Putting the Electronics Together
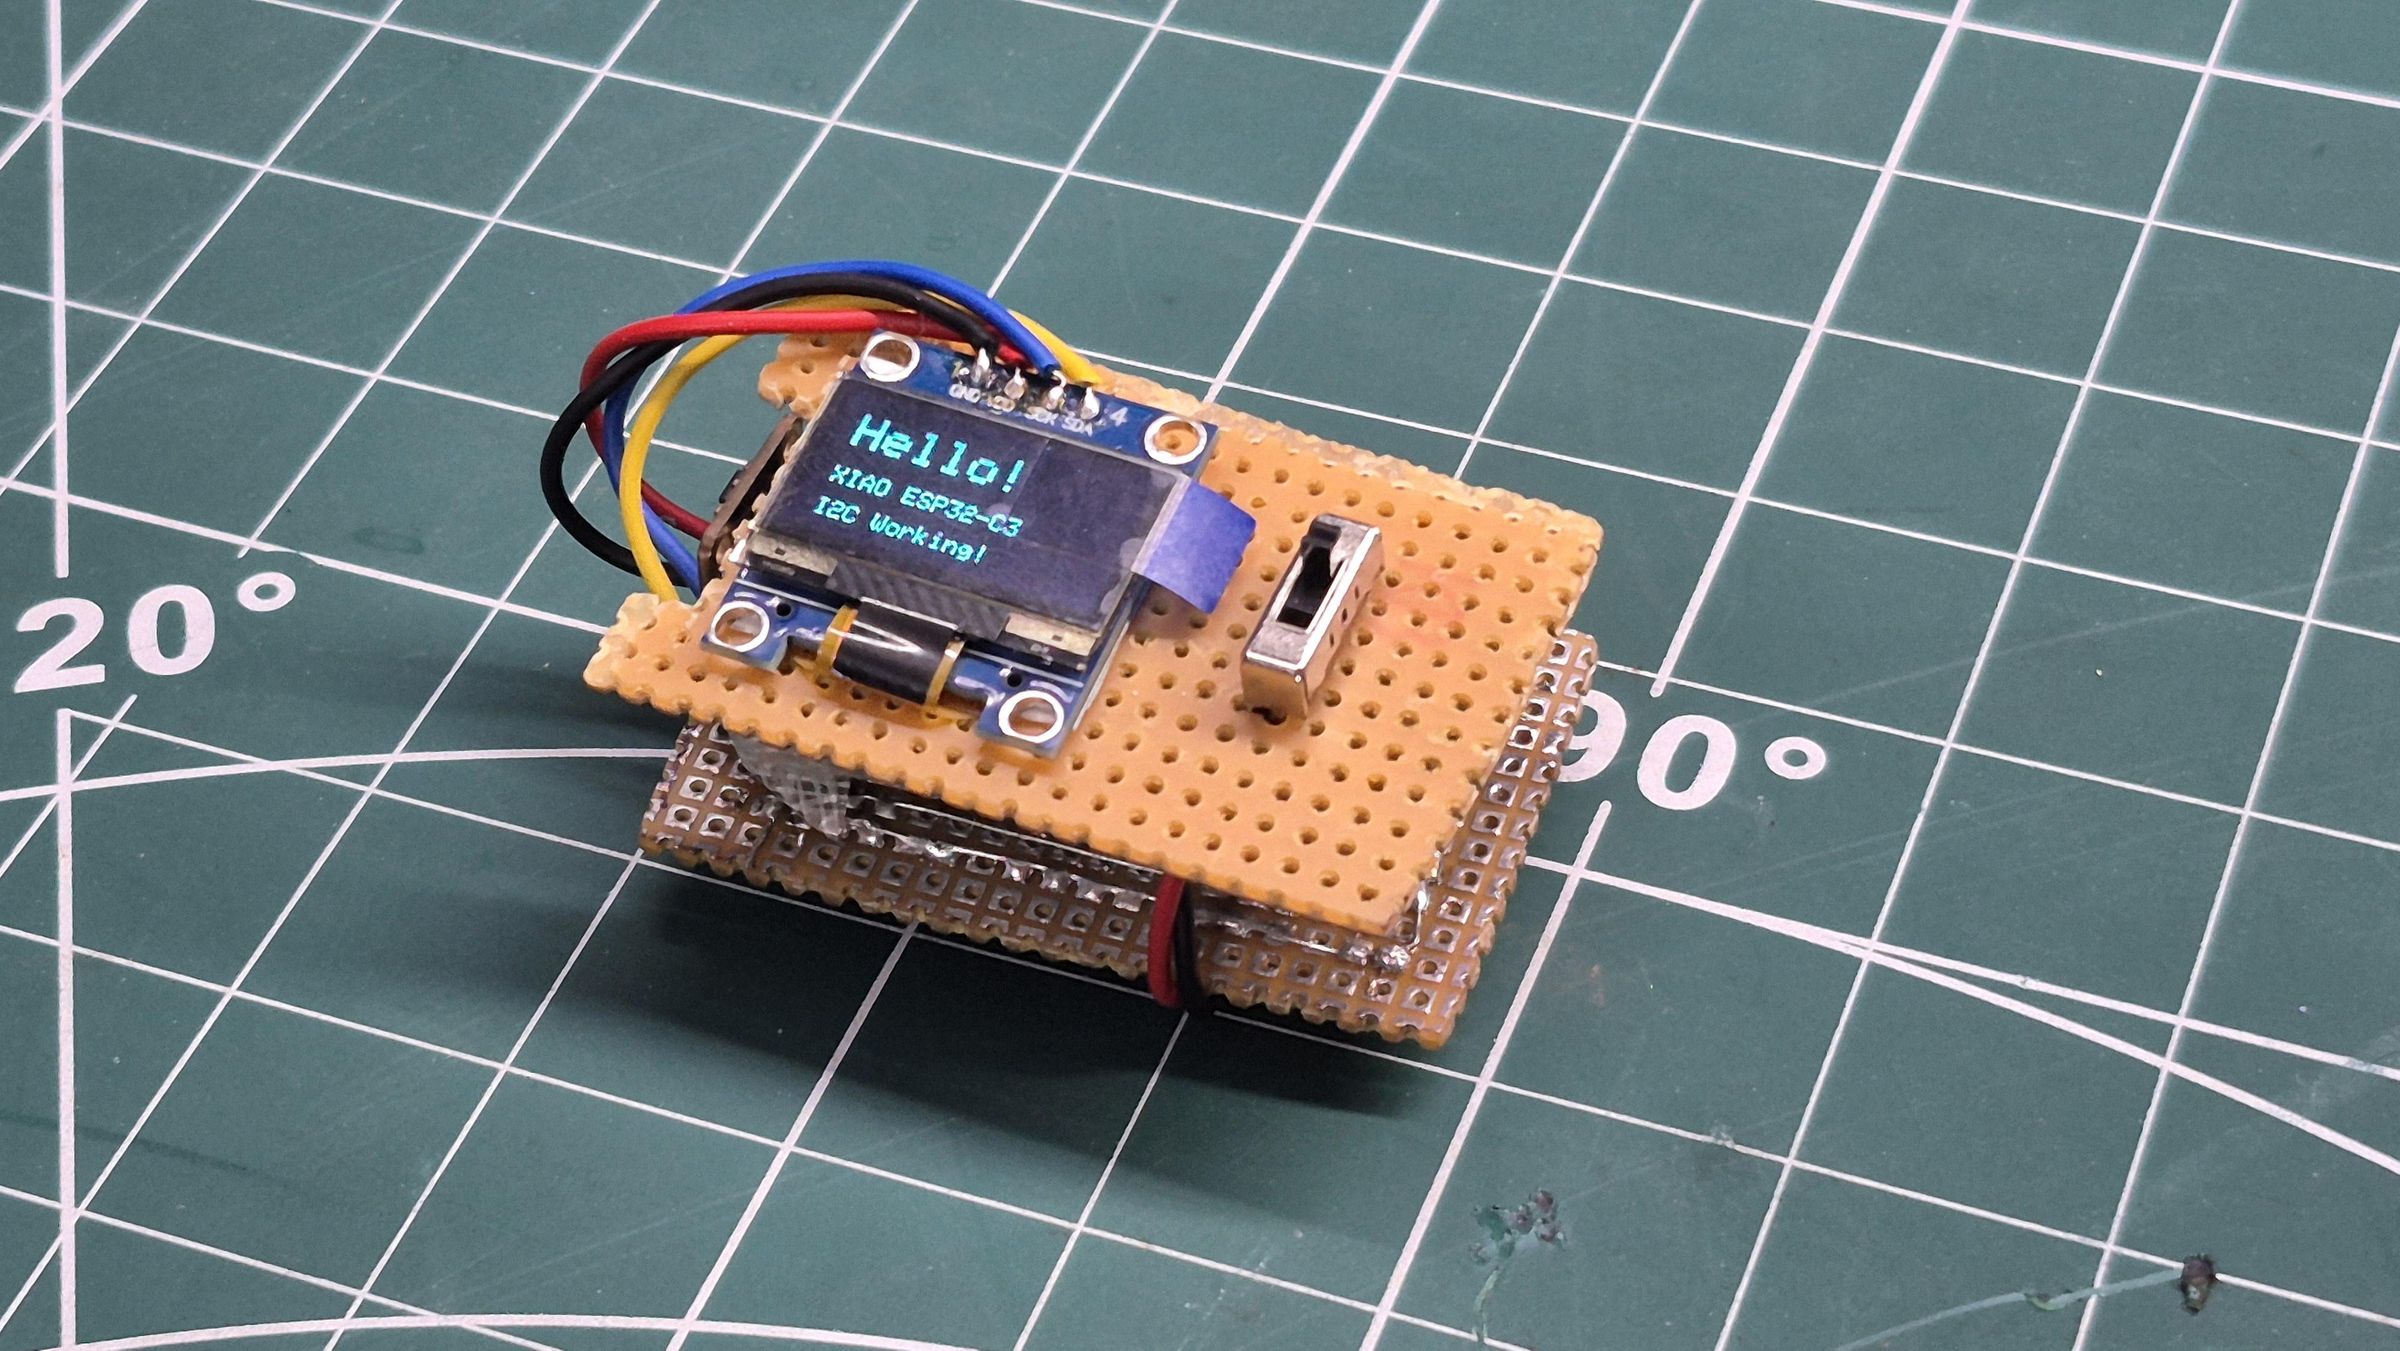
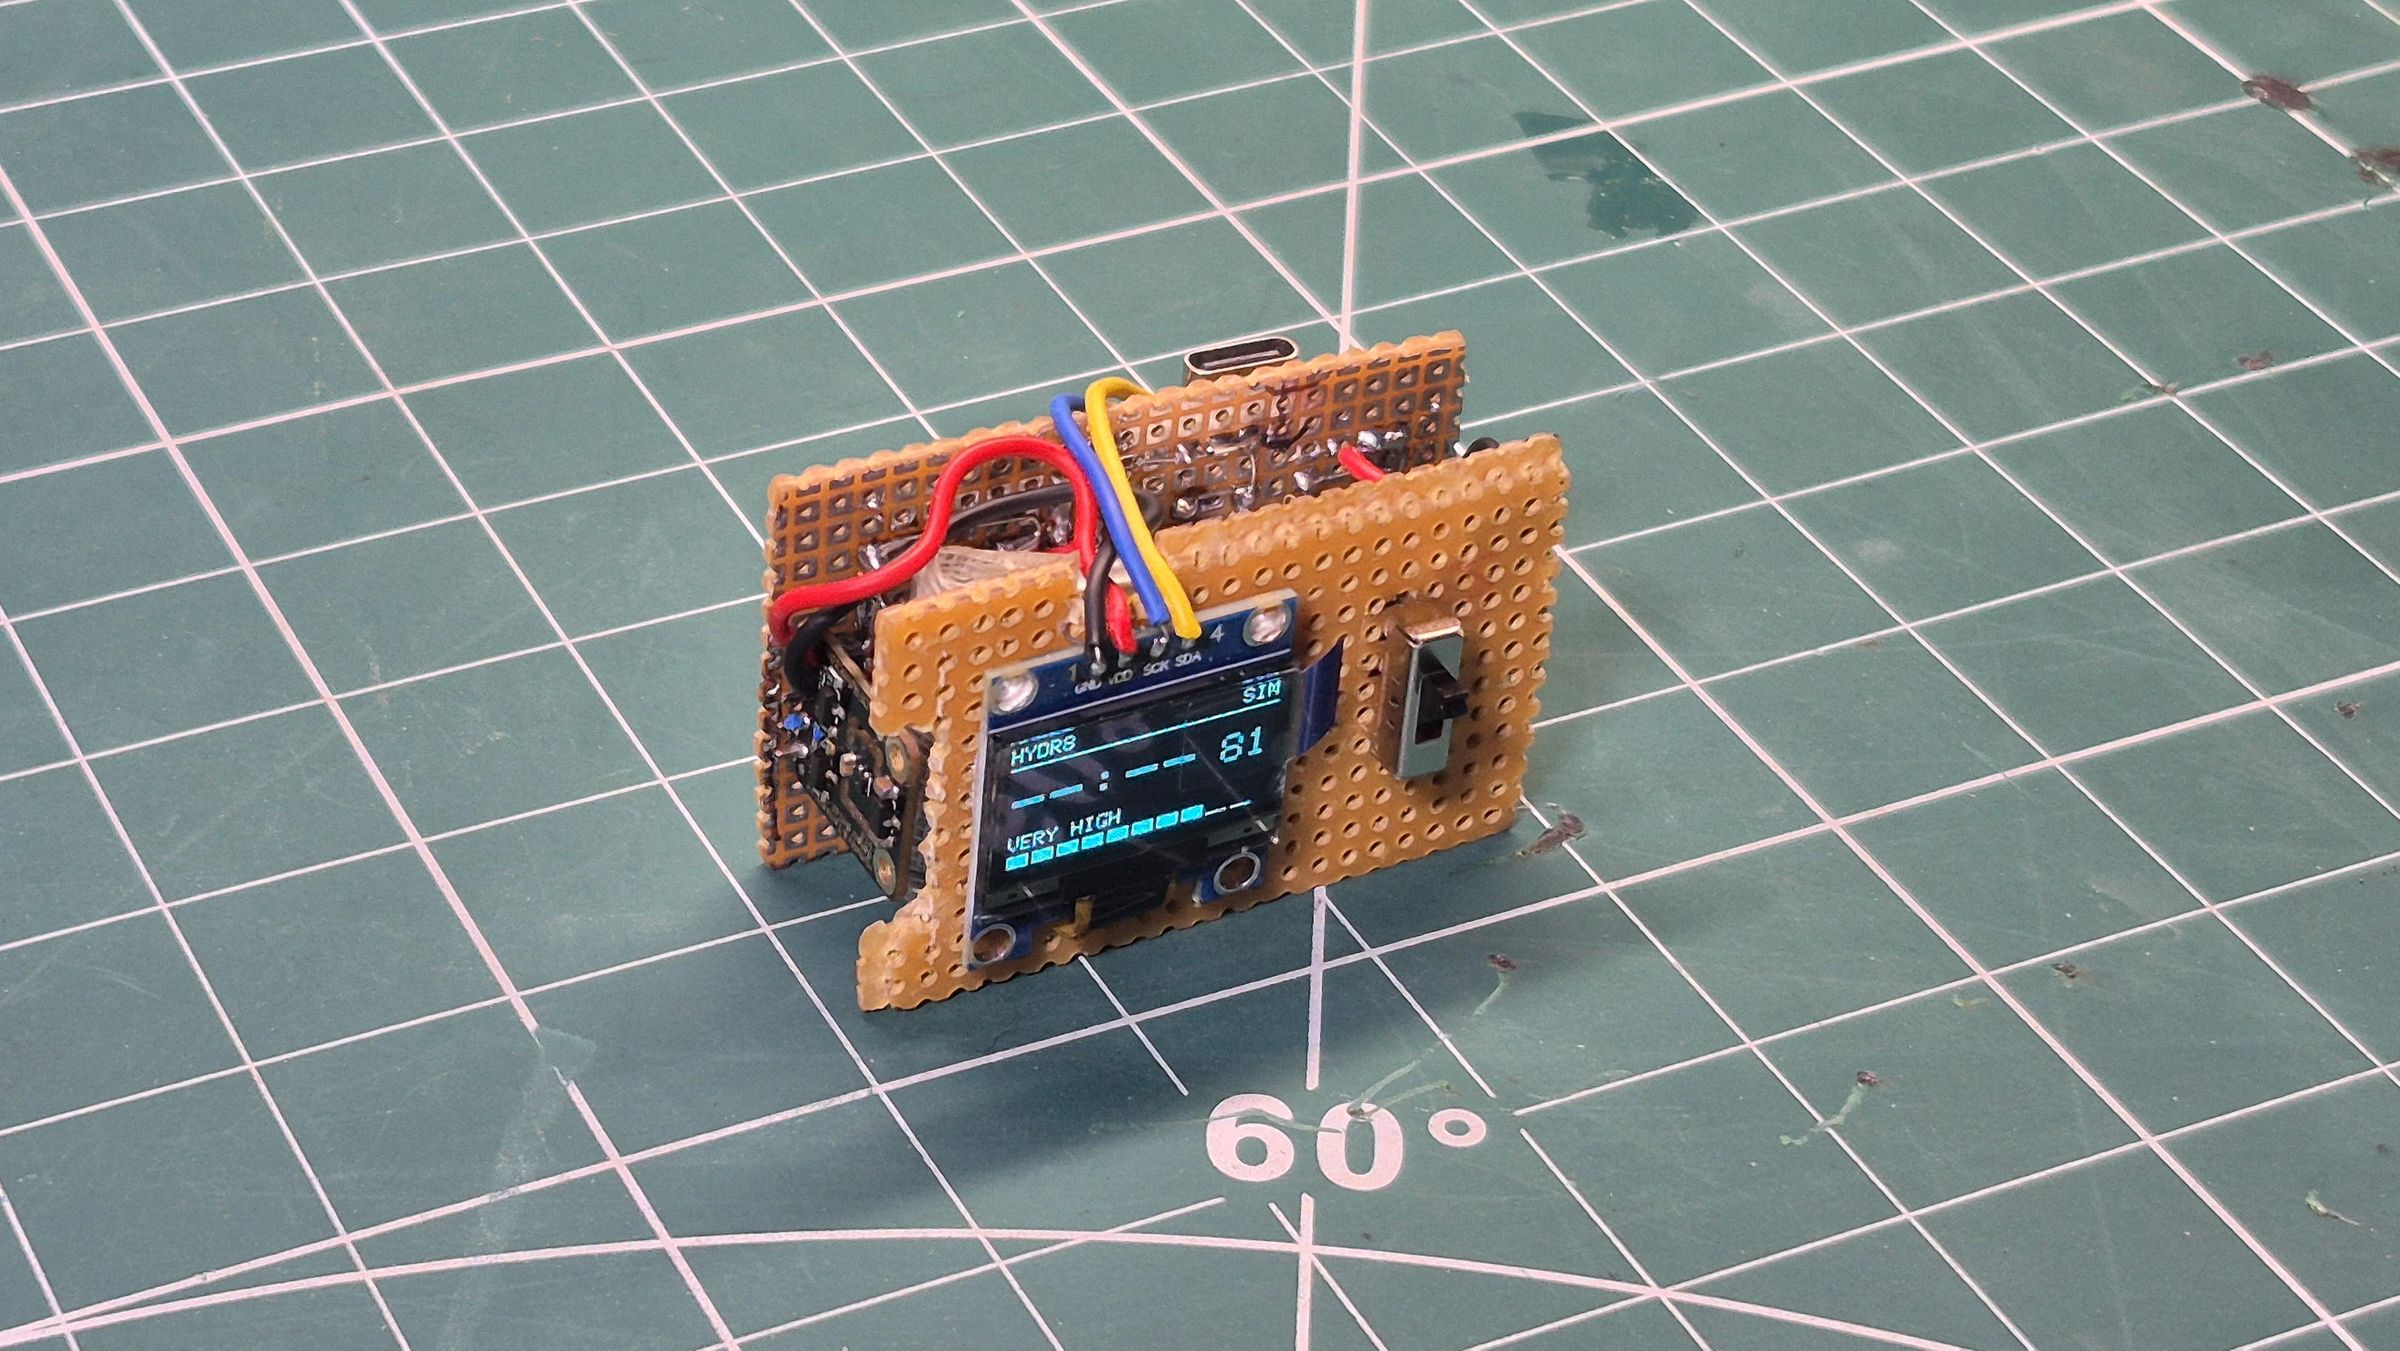
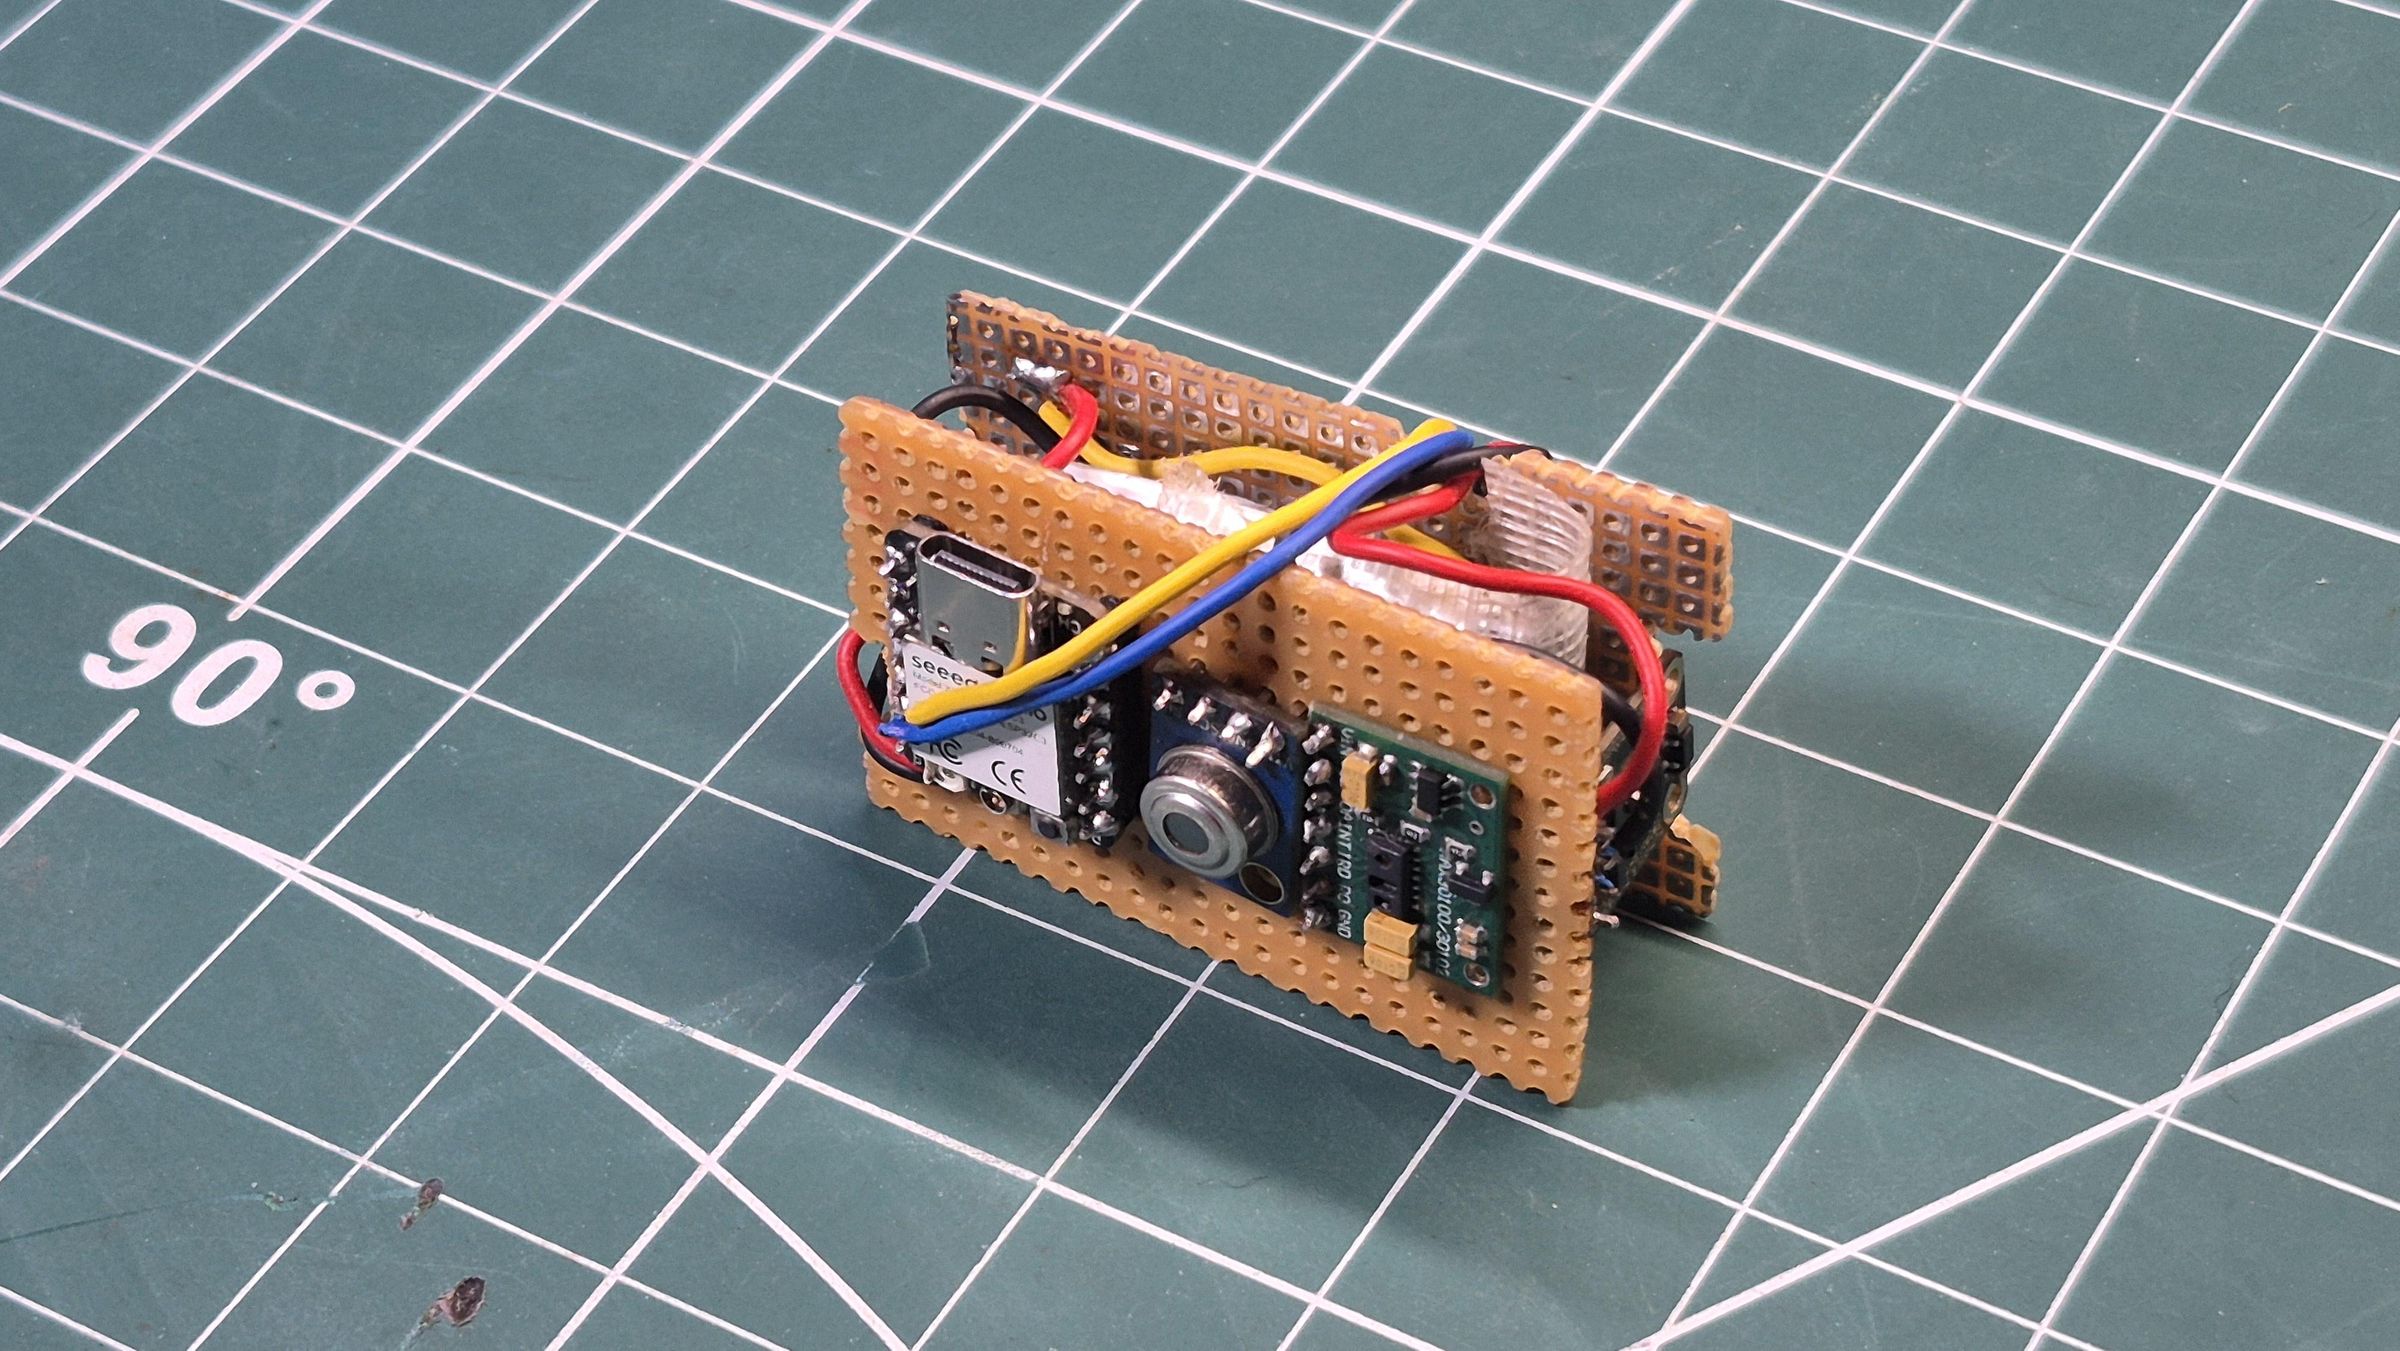
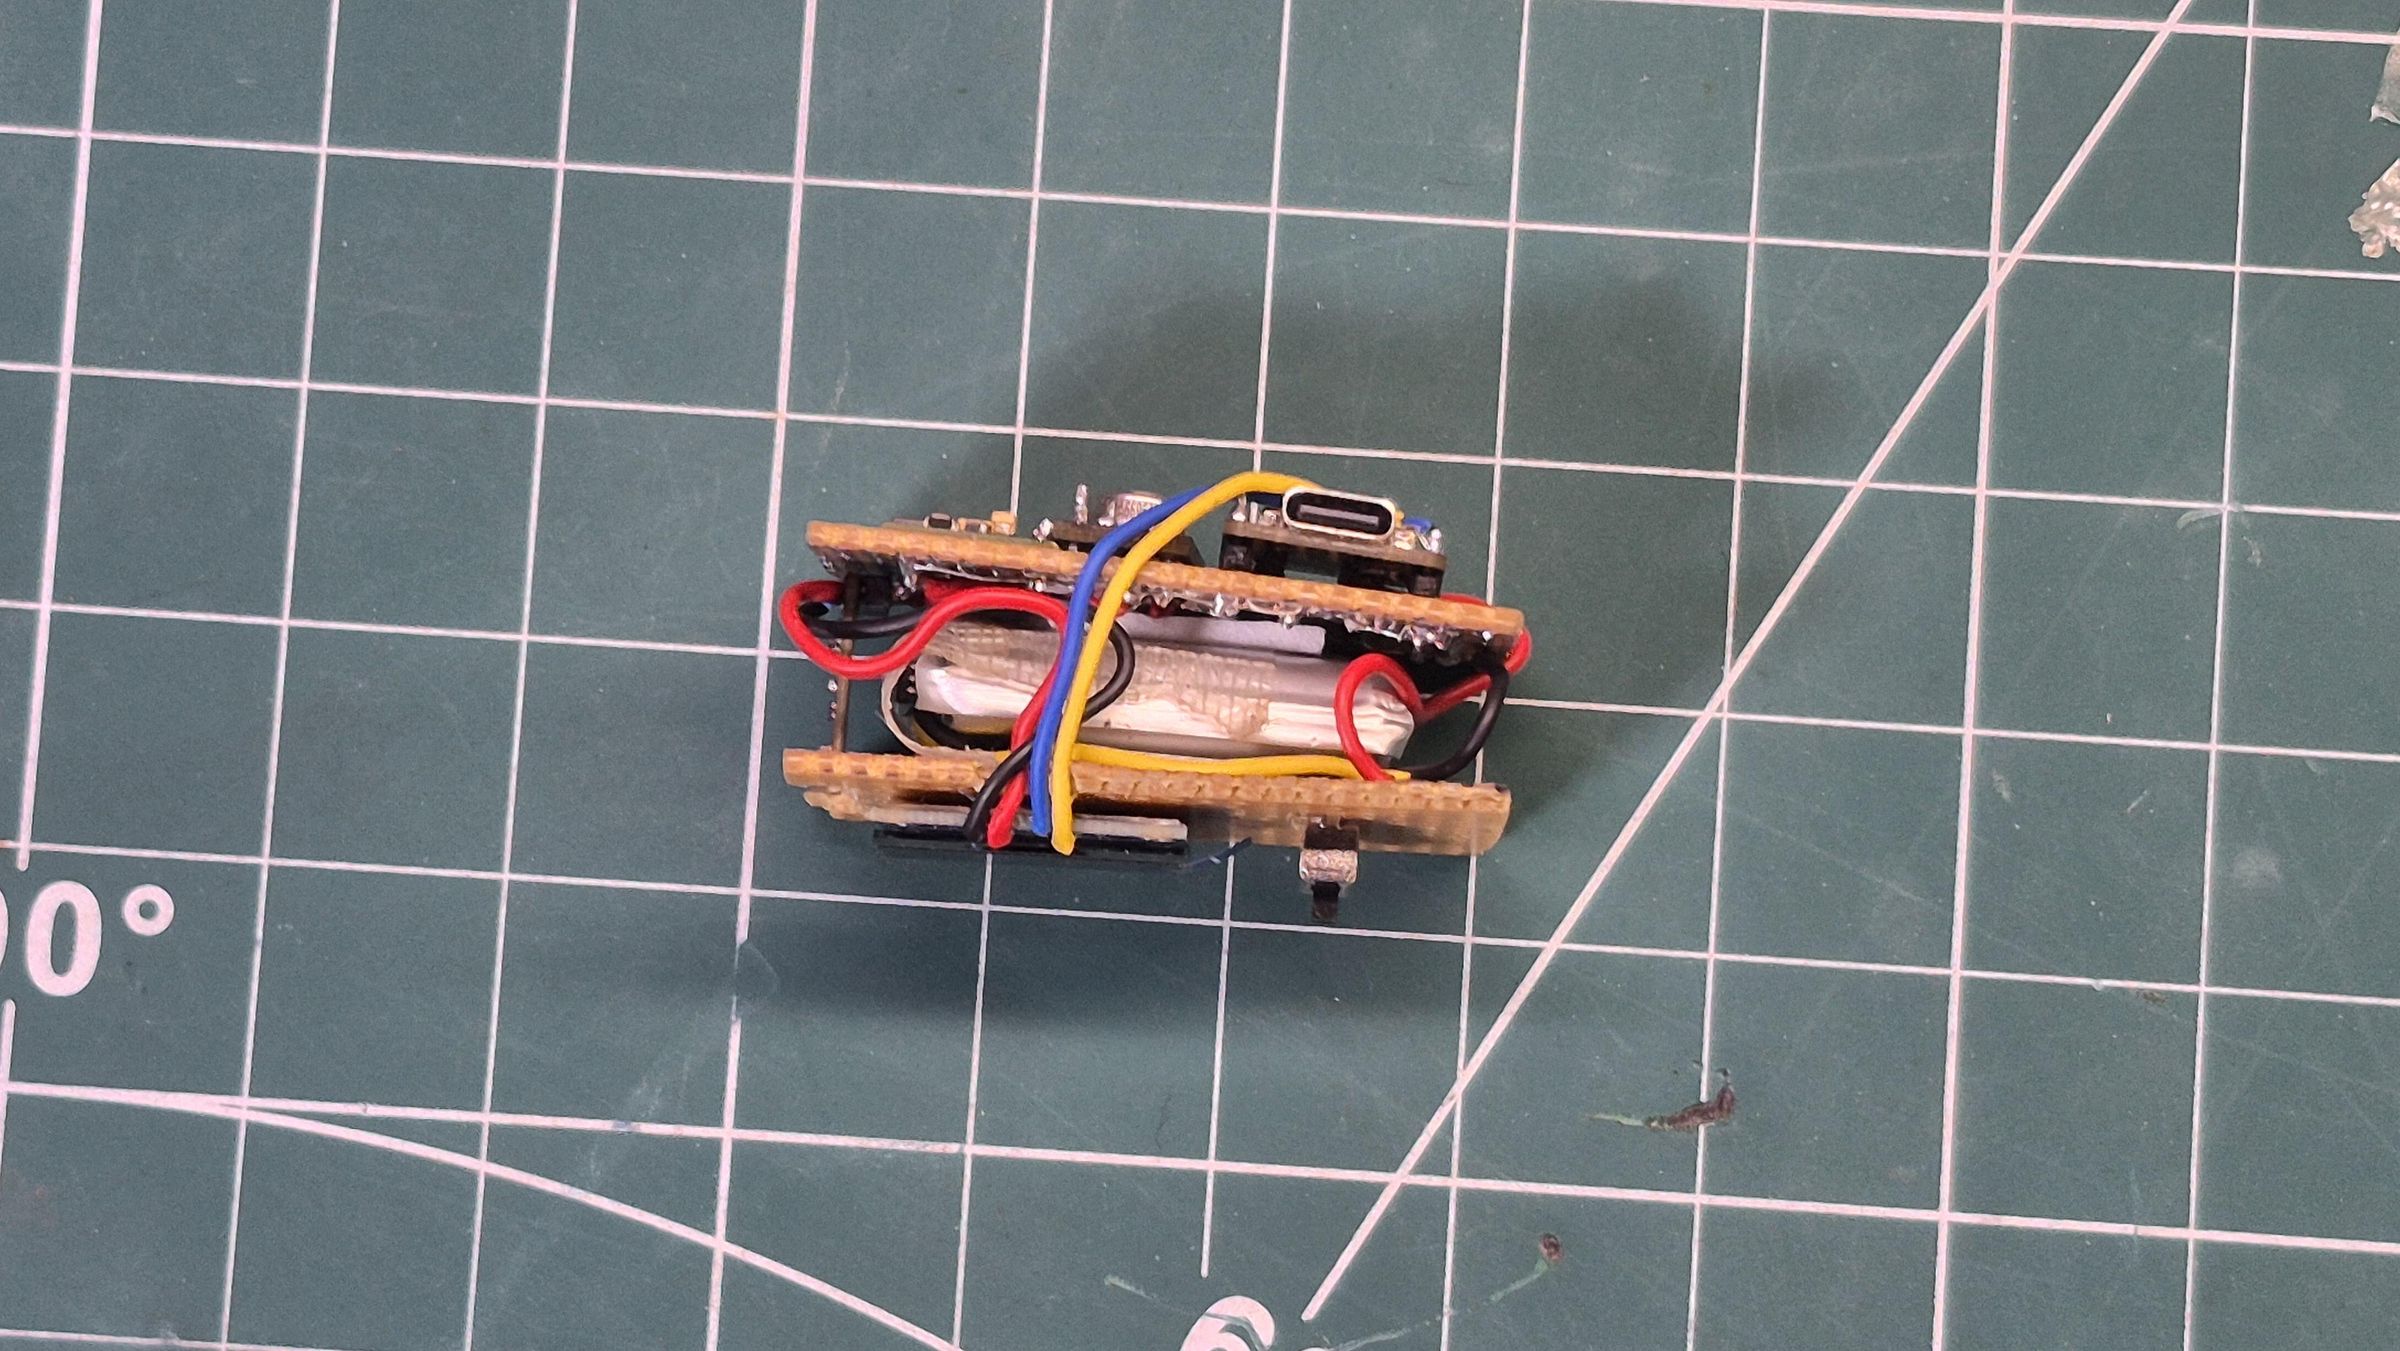
With both boards soldered, I could finally see how the complete electronics assembly would fit together.
The bottom perfboard acts as the main electronics section, carrying the XIAO ESP32-C3 and the sensors. The environmental sensor sits vertically so it can still interact with the surrounding air.
Above it sits the top perfboard, which carries the OLED and switch. The battery sits alongside the assembly and connects to the power section.
The two boards are connected together so they can work as one system while still keeping the wearable compact and organized.
At this point, the electronics were ready to go into the 3D-printed enclosure.
Putting Everything Together
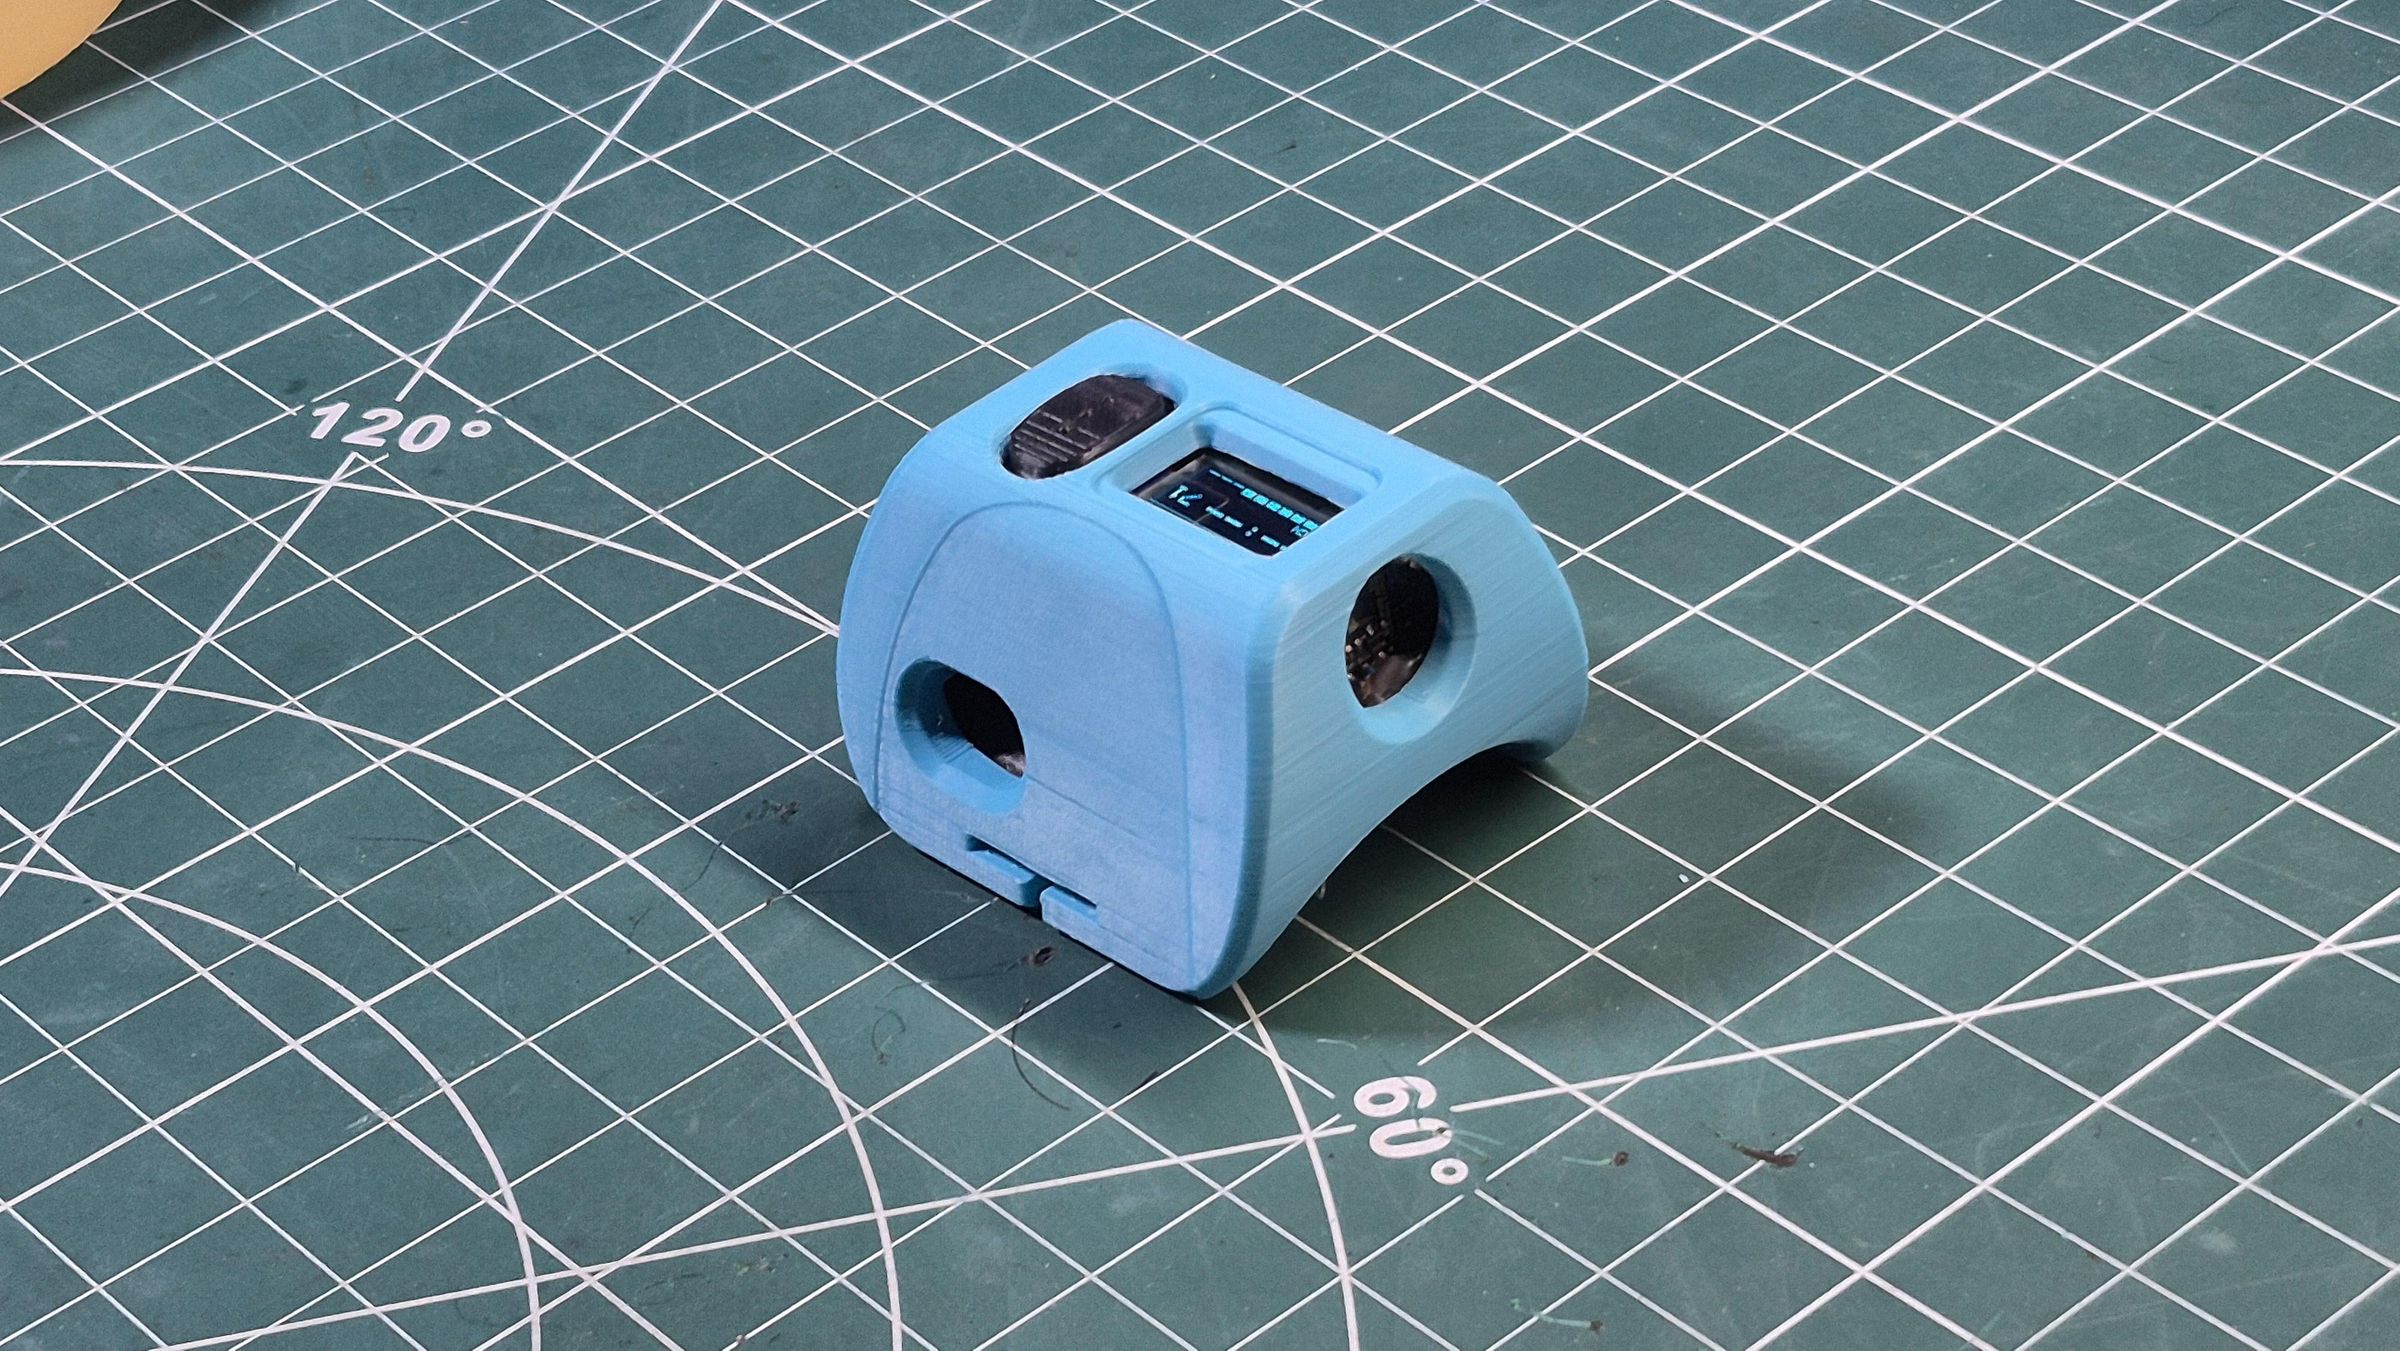
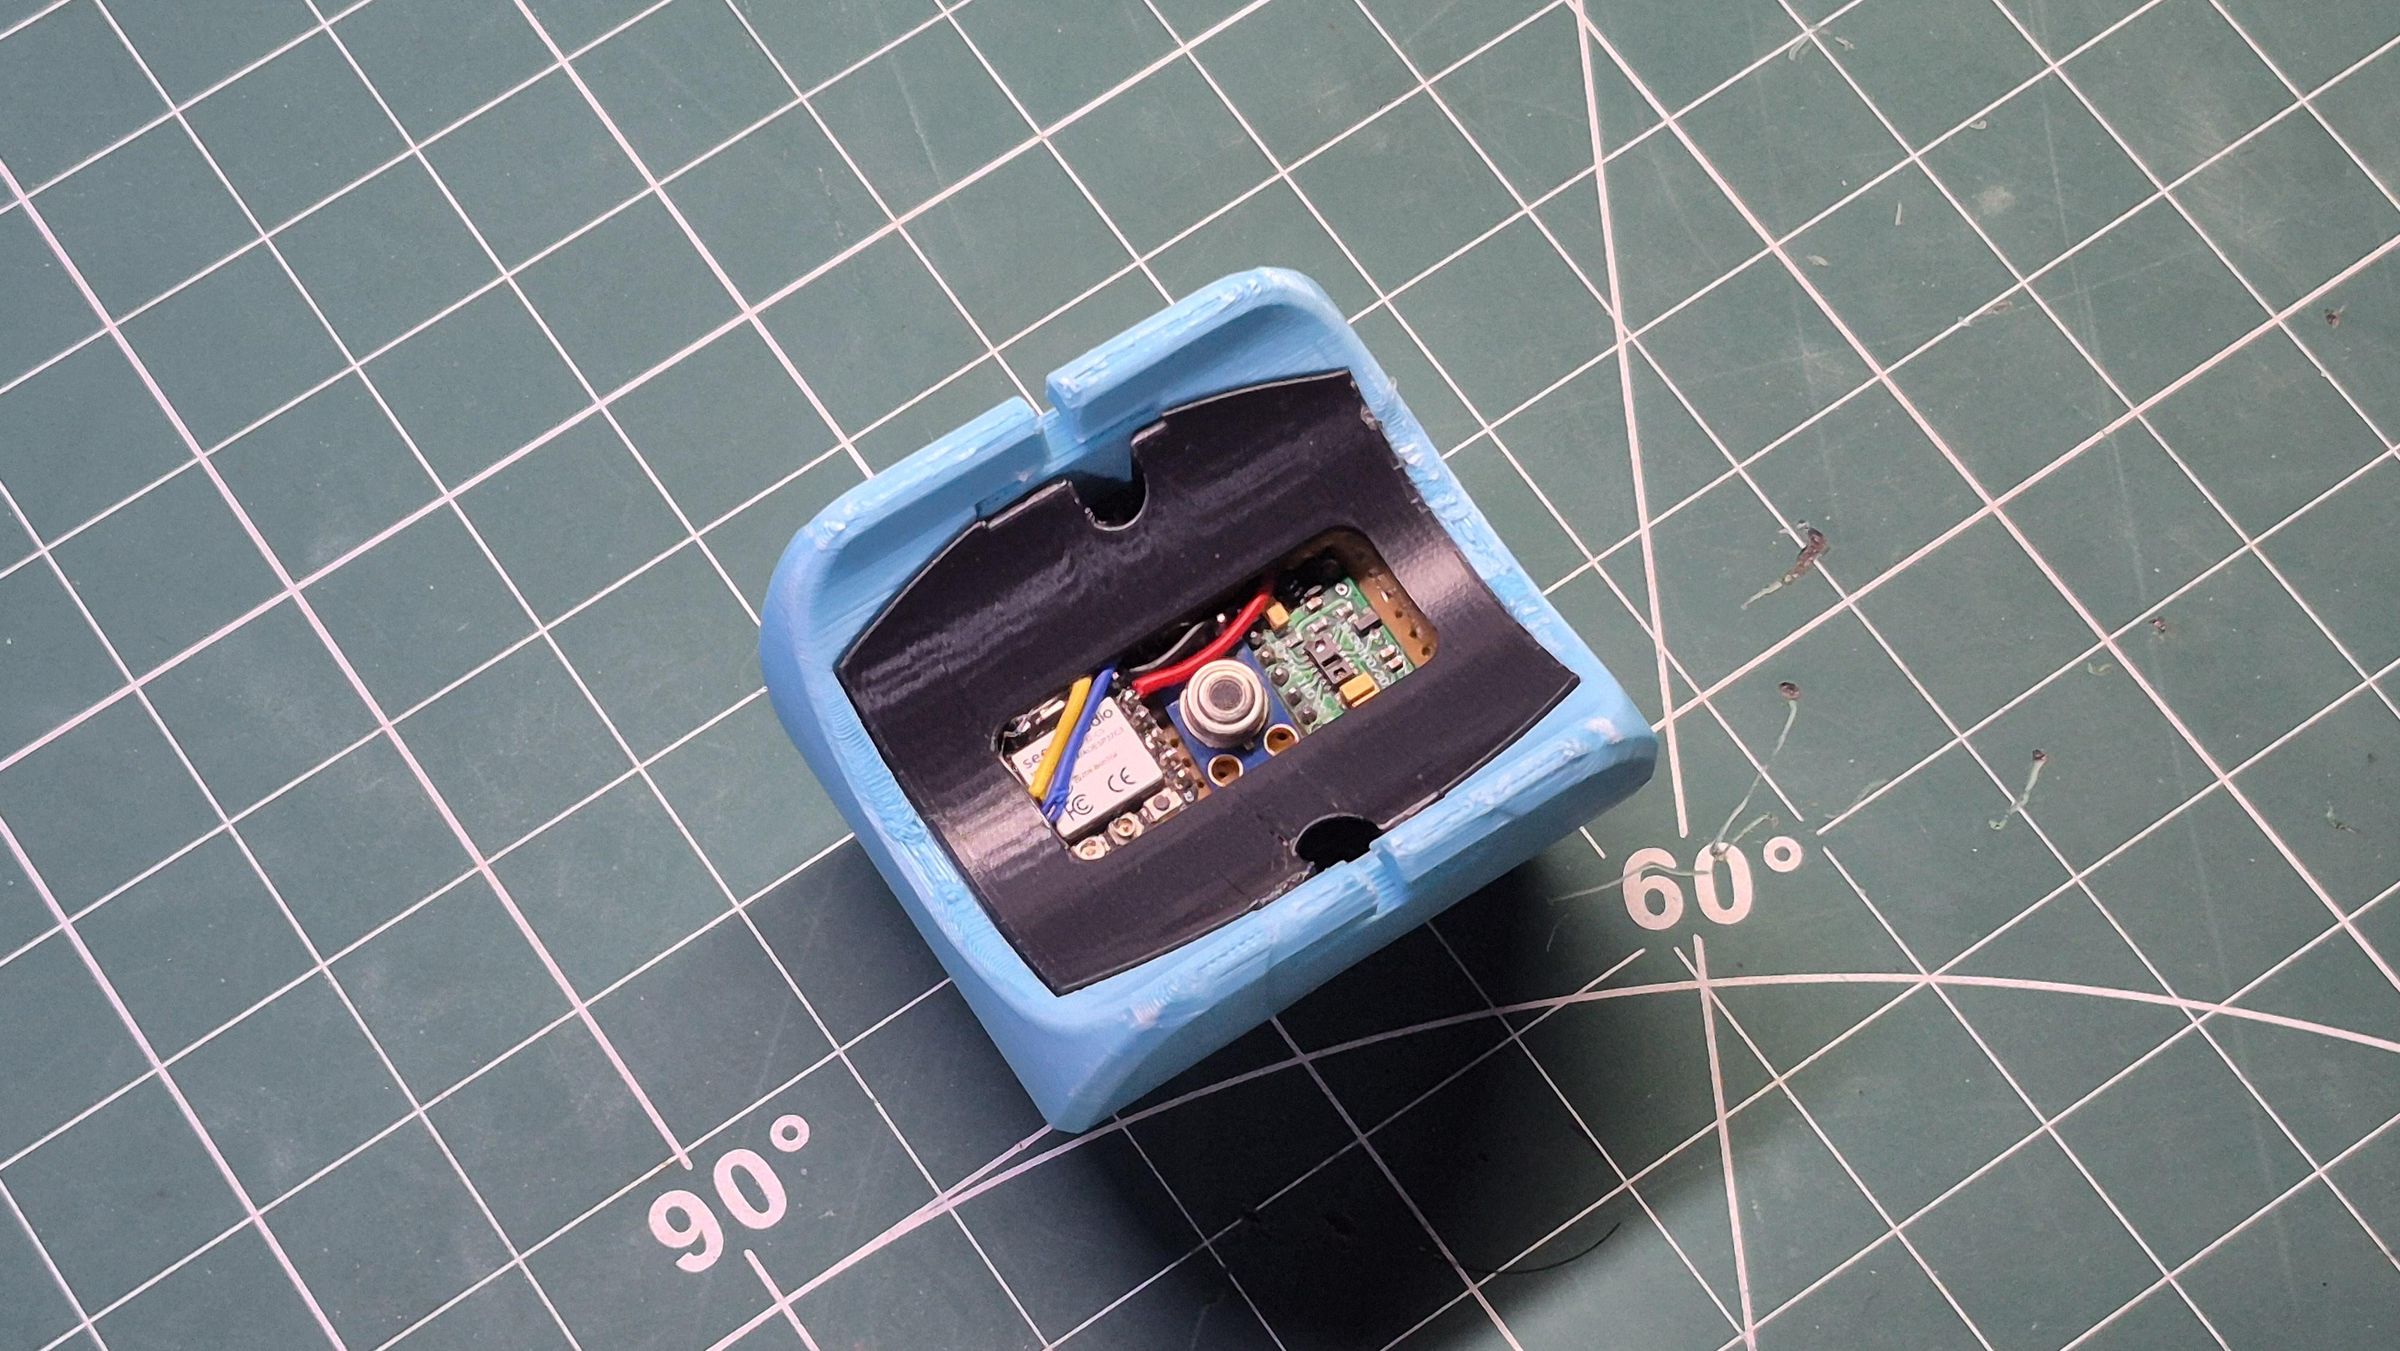
Assembly order matters more than it looks, because a watch-sized case doesn't leave you room to reach past finished work.
The two skin-facing sensors went in first and got checked against their openings before anything else was committed. Then the perfboard, the battery, the switch, and the OLED on top before closing the shell and putting the screws in.
One thing worth checking before you close it for the last time: power it up with the shell together and confirm the MLX90614 still reads sensibly. It's easy for a wire to push the sensor slightly off-axis during assembly and you won't notice from the outside. If the skin temperature suddenly reads a degree or two lower than it did on the bench, something has moved into its line of sight.
And that's the physical build done. From here it's all software.
How the Software Is Organised
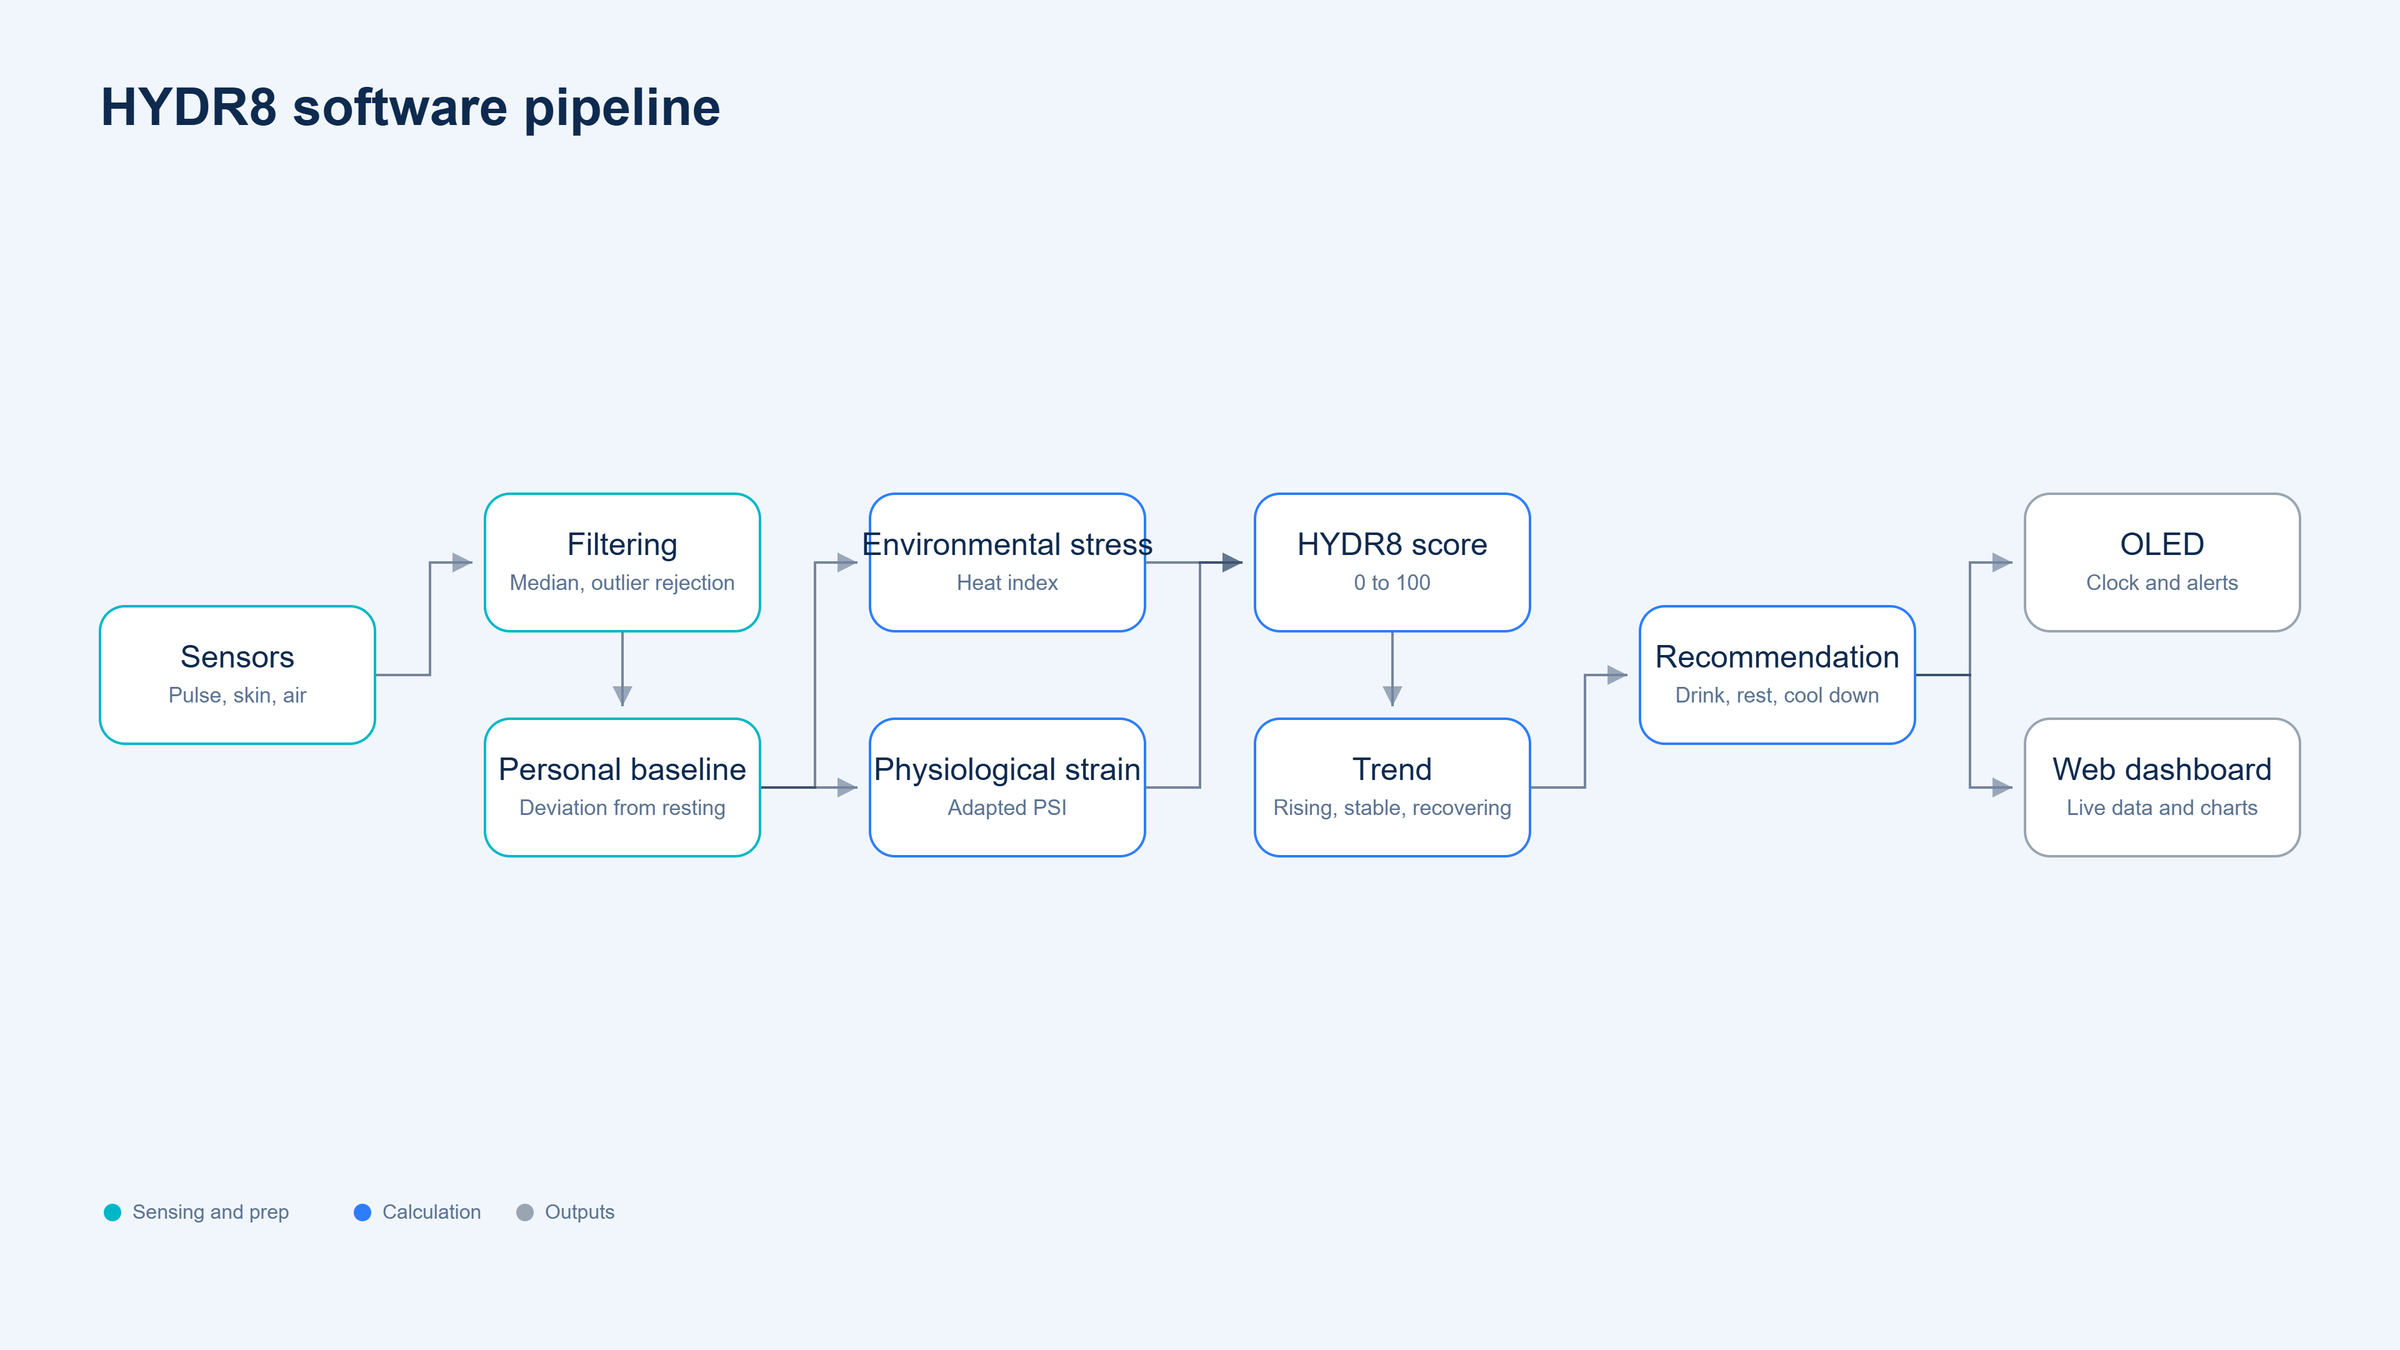
Before any code, here's the shape of it. Data flows one direction, and every stage only knows about the one before it:
My instinct on ESP32 projects is one big .ino file. It works fine for about 300 lines and then becomes miserable. HYDR8 is around 4,000 lines, so it's split into modules, each with a header and an implementation file:
Two rules I stuck to, and both paid off.
config.h holds every tunable number. No magic constants anywhere else. When you're debugging at 2am you want exactly one file to look in.
Headers declare, .cpp files define. A header-only project with fifteen headers including each other hits multiple-definition errors the moment two files need the same global. This still compiles as one flat Arduino sketch, it just actually links.
One Arduino quirk worth knowing: the IDE only compiles files in the sketch root and a src/ folder. I originally put the web assets in a www/ subfolder and spent a while confused about why the linker couldn't find them. Everything is flat now.
The ESP32 Code
9.1 Project Setup:
HYDR8_v2.ino does five things and nothing else: bring up the subsystems, then tick them.
cpp
That Serial wait is not decoration. On the ESP32-C3 the USB port takes a moment to enumerate, and a plain delay(300) races it. You lose every boot message and conclude the board is dead. Waiting for the port with a timeout means it works whether or not a computer is attached.
9.2 Non-Blocking Timing:
Everything else follows from one rule: no delay() anywhere outside setup().
The C3 is single-core. The web server, WiFi stack, sensors and display all share it. One delay(1000) and the dashboard stops responding.
cpp
Each of those returns immediately unless its own interval has elapsed. The pattern inside every single one is the same:
cpp
Unsigned subtraction here isn't style. It handles the millis() rollover at 49 days correctly with no special case.
The yield() at the bottom matters more than it looks. Without it a tight loop starves the async web server and WiFi tasks on a single-core chip, and the dashboard goes laggy in a way that's very hard to trace back to this one missing line.
9.3 Sensor Initialisation
sensors.cpp owns the I2C bus. Nothing else touches the drivers directly.
cpp
That automatic scanBus() on failure has saved me more time than anything else in the project. It dumps every address that answers, so you instantly know whether you have a wiring problem or a code problem:
cpp
9.4 Reading the MAX30102
The MAX30102 provides the heart rate that drives the physiological half of the score.
The tricky part is that Maxim's SpO2 algorithm wants 100 samples at once, and the obvious implementation blocks for two seconds collecting them. That's unacceptable with a web server running. So the FIFO gets drained a few samples per loop:
cpp
Two things doing real work here. guard++ < 8 caps how much one call can do regardless of how full the FIFO is. And delta > 300 && delta < 2000 is a 30 to 200 bpm plausibility gate, because beat detection on a reflective optical sensor produces nonsense regularly and you want it thrown out before it reaches the filter.
The sensor config is tuned for a wrist read:
cpp
50 Hz sample rate, 411 us pulse width, moderate LED power. Green is off because this board doesn't use it.
9.5 Reading the MLX90614
This gives the skin temperature term in the strain calculation.
cpp
A dead MLX90614 doesn't throw an error, it quietly returns NaN or nonsense. Checking isnan() and a plausibility window of 20 to 45 degC catches both failure styles.
9.6 Reading Temperature and Humidity
This drives the entire environmental half of the score.
cpp
9.7 Filtering the Data
Wearable sensors are noisy and a single reading should never trigger anything. Everything runs through a fixed-size ring buffer, templated so each instance is statically allocated. No heap, no fragmentation.
cpp
The interesting method is accepts(), which does outlier rejection using median absolute deviation rather than standard deviation:
cpp
Why MAD instead of standard deviation? Because standard deviation is itself wrecked by outliers. One spike inflates it, which then makes the filter more likely to accept the next spike. The median doesn't care. That 1.4826 converts MAD into something comparable to a standard deviation for normally distributed data.
In practice it means your heart rate doesn't jump to 190 because the sensor caught one bad frame, but a genuine climb still gets through.
9.8 Personal Baseline
A heart rate of 105 means something completely different for me than for a trained athlete. So nothing physiological goes into the score as a raw value. It goes in as a deviation from your own resting state.
Calibration is a 60 second capture, started from the dashboard:
cpp
And critically, the capture is allowed to fail:
cpp
Fewer than 15 clean heart rate samples in 60 seconds and the whole baseline gets thrown away. A confidently wrong baseline poisons every score after it, so refusing to produce one is the safer failure.
Baselines live in NVS and survive reboots.
9.9 Environmental Heat Calculation
Temperature alone isn't enough. 35 degC at 30% humidity and 35 degC at 80% humidity are completely different physiological situations, because sweat only cools you if it can evaporate.
So the environmental half uses the Rothfusz heat index regression, the same apparent-temperature formula weather services use. It's defined in Fahrenheit, so the code converts in and out:
cpp
Then the heat index maps linearly onto 0 to 100:
cpp
9.10 Physiological Strain
This is adapted from the Physiological Strain Index by Moran et al., which combines heart rate and body temperature into a 0 to 10 scale:
The published PSI uses core temperature. I don't have core temperature. An MLX90614 on a wrist gives me skin surface, so I substituted it and dropped the ceiling from 39.5 degC to 38 degC, because skin runs cooler than core.
That substitution is the single biggest reason this is an estimate rather than a measurement, and I'd rather say so plainly than bury it.
cpp
The parts counter is the graceful degradation. If the MLX90614 dies, the heart rate term gets doubled instead of the strain silently halving and the score looking falsely reassuring. A broken sensor should never make things look better than they are.
9.11 The HYDR8 Score
Everything comes together as a weighted sum:
Those weights are experimental prototype parameters, not clinically validated values. I picked them because environment and body felt equally important with direction as a smaller nudge. They live in config.h and you should absolutely tune them.
cpp
That comment about the previous cycle's slope took me a while to get right. If you compute the score, push it into the trend buffer, then read the slope back to compute that same score, you've built a feedback loop that amplifies noise into a wobble. Using the previous cycle's slope breaks the loop.
9.12 Confidence
An honesty mechanism. When sensors are missing or the signal is unstable, the score deserves less trust and the dashboard says so.
cpp
This is not a statistical confidence interval, and the UI labels it as a reliability indicator rather than pretending otherwise.
9.13 Trend Analysis
A score of 70 that's falling needs different advice from a score of 70 that's climbing. Least squares regression over the last 30 score samples:
cpp
Returning STABLE on insufficient data instead of computing a meaningless slope is a small thing that stops the UI flapping wildly in the first ten seconds after boot.
9.14 Recommendation Logic
A score on its own isn't actionable. The recommendation engine looks at where the stress is coming from:
cpp
The envDriven check is the part I'm happiest with in this whole project. If you're baking in the sun but your body isn't struggling much yet, telling you to drink water is the wrong advice. You need shade. Drinking more water does not fix standing in 45 degC sunshine, and a single-number score can't express that difference. Splitting the score into environmental and physiological halves is what makes it possible.
9.15 Adaptive Reminders
No fixed 30 minute timer. The interval scales with your current stress:
cpp
A 30 minute base becomes 45 minutes when you're cool and comfortable, and 7.5 minutes in the very high band. There's an urgent override that skips the schedule entirely:
cpp
And a hard rate limit of three minutes that nothing can bypass. A device that nags every thirty seconds gets taken off and left in a drawer.
9.16 Water Logging
Logging a drink captures the state before it, which is what makes recovery analysis possible later:
cpp
Note ml defaults to 0 for "amount not stated". There's no flow sensor here, so the device only knows what you tell it and it doesn't pretend otherwise.
The log is a rolling 24 events. When it's full the oldest gets dropped rather than the array growing.
9.17 Recovery Analysis
Ten minutes after a logged drink, the recovery window closes and the "after" state is captured:
cpp
Important framing. This shows that your measured state improved after a logged drink. It does not show the water caused it. You might also have stopped moving, stepped indoors, or cooled off naturally. The UI is worded to say only what's actually true:
javascript
It would have been easy to write "drinking water reduced your heat stress by 22 points" and it would have looked more impressive. It also would have been a lie.
9.18 OLED Logic
The band is a notification surface, not a small copy of the phone app. Default state is a clock, and anything important takes the whole screen for eight seconds before handing it back.
Time is large and left aligned so it never reflows as digits change width. Score sits top right. The bottom is a ten segment level bar:
cpp
Segments rather than a smooth bar because a one pixel tall analogue bar turns to mush on a 128x64 panel. Discrete blocks stay readable at a glance.
Alerts invert the entire panel, which is impossible to miss in peripheral vision:
cpp
The screen state machine lives in update() and is deliberately simple: alert takes priority, then calibration, then boot, then fault, then clock.
9.19 The Display Watchdog
This subsection exists because it cost me more time than the entire algorithm.
The symptom: display works perfectly after a fresh upload, then glitches, freezes, and goes black. Meanwhile the web dashboard keeps running perfectly. That last part was the clue. The MCU was fine, only the I2C side was dying.
The root problem was that the display was only ever initialised once, at boot. When a noise glitch scrambled the controller, nothing noticed and nothing retried. So now there's a watchdog:
cpp
That Wire.end() warning is a trap I fell into myself and had to back out of. It looks like exactly the right thing to do when a bus is wedged. It isn't.
The second half of the fix was cutting bus traffic. Every display() call sends 1 KB in one burst, and at 10 Hz that's a lot of transactions and a lot of charge pump current. But the clock face is static for a whole minute at a time. So the code hashes the framebuffer and only transmits when the picture actually changed:
cpp
Hashing 1 KB of RAM is far cheaper than transmitting 1 KB over I2C. This took the write rate from about five per second to roughly one per minute.
There's also a settle delay before init, which turned out to matter:
cpp
The SSD1306's charge pump needs time after VCC rises before it will accept its init sequence. Without this you get a board that comes up fine over USB, where enumeration happens to supply the delay, and blank when power cycled from a battery.
Finally, I2C_FREQ_HZ is set to 50 kHz rather than the usual 100 or 400. On jumper wires with four devices, 400 kHz works right up until WiFi transmit noise corrupts a transaction and wedges the bus.
A recovery counter prints on the serial heartbeat so you can measure this rather than guess:
Zero or one over an hour is fine. Climbing steadily means the watchdog is papering over a hardware fault and you need better pull-ups.
9.20 WiFi With a Hotspot Fallback
For a demo on a table with no router, "connect to WiFi" is a terrible dependency. So the firmware tries to join your network and falls back to hosting its own:
cpp
WiFi.setSleep(false) is worth calling out. With modem sleep enabled the dashboard develops a random 100 to 300 ms lag that feels exactly like a bug in your own code.
So the band is always reachable: at its IP on your network, at http://hydr8.local/, or by connecting your phone to HYDR8-SETUP and opening 192.168.4.1.
9.21 Telling the Time Without an RTC
There's no RTC in this build, but the OLED's main job is showing a clock. NTP would need internet, which breaks the offline requirement.
Solution: the phone is the clock. The web app posts its time on every page load.
cpp
One line on the browser side, inside the WebSocket open handler:
javascript
The timezone offset is subtracted so the device stores local time directly. Drift is a few seconds an hour, which nobody notices on a clock face.
9.22 Web Server and API
The whole dashboard is served from flash. This is what makes a 37 KB web app viable on a chip with 400 KB of RAM:
cpp
beginResponse_P streams straight out of flash, so the page never occupies RAM. Splitting into three files also means the browser caches CSS and JS separately.
The full endpoint list:
9.23 JSON Without String
This is the most important ESP32 memory lesson in the project. No String concatenation anywhere in the request path. It's the single biggest cause of heap fragmentation on ESP32. Everything is built with snprintf into one shared buffer:
cpp
Returning false when the buffer runs out lets the caller stop cleanly instead of emitting truncated JSON the browser can't parse:
cpp
There's one shared 4 KB scratch buffer for all handlers. They all run on the same async task so there's no re-entrancy problem, and it avoids a 4 KB stack allocation on every request.
9.24 History and Insights
120 points, one per minute, statically allocated at about 1.4 KB:
cpp
Temperatures stored as tenths in an int16_t rather than floats halves the memory and loses nothing you'd notice.
Insights are simple rules over that buffer, and importantly they produce nothing when there isn't enough data:
cpp
Building the Webapp
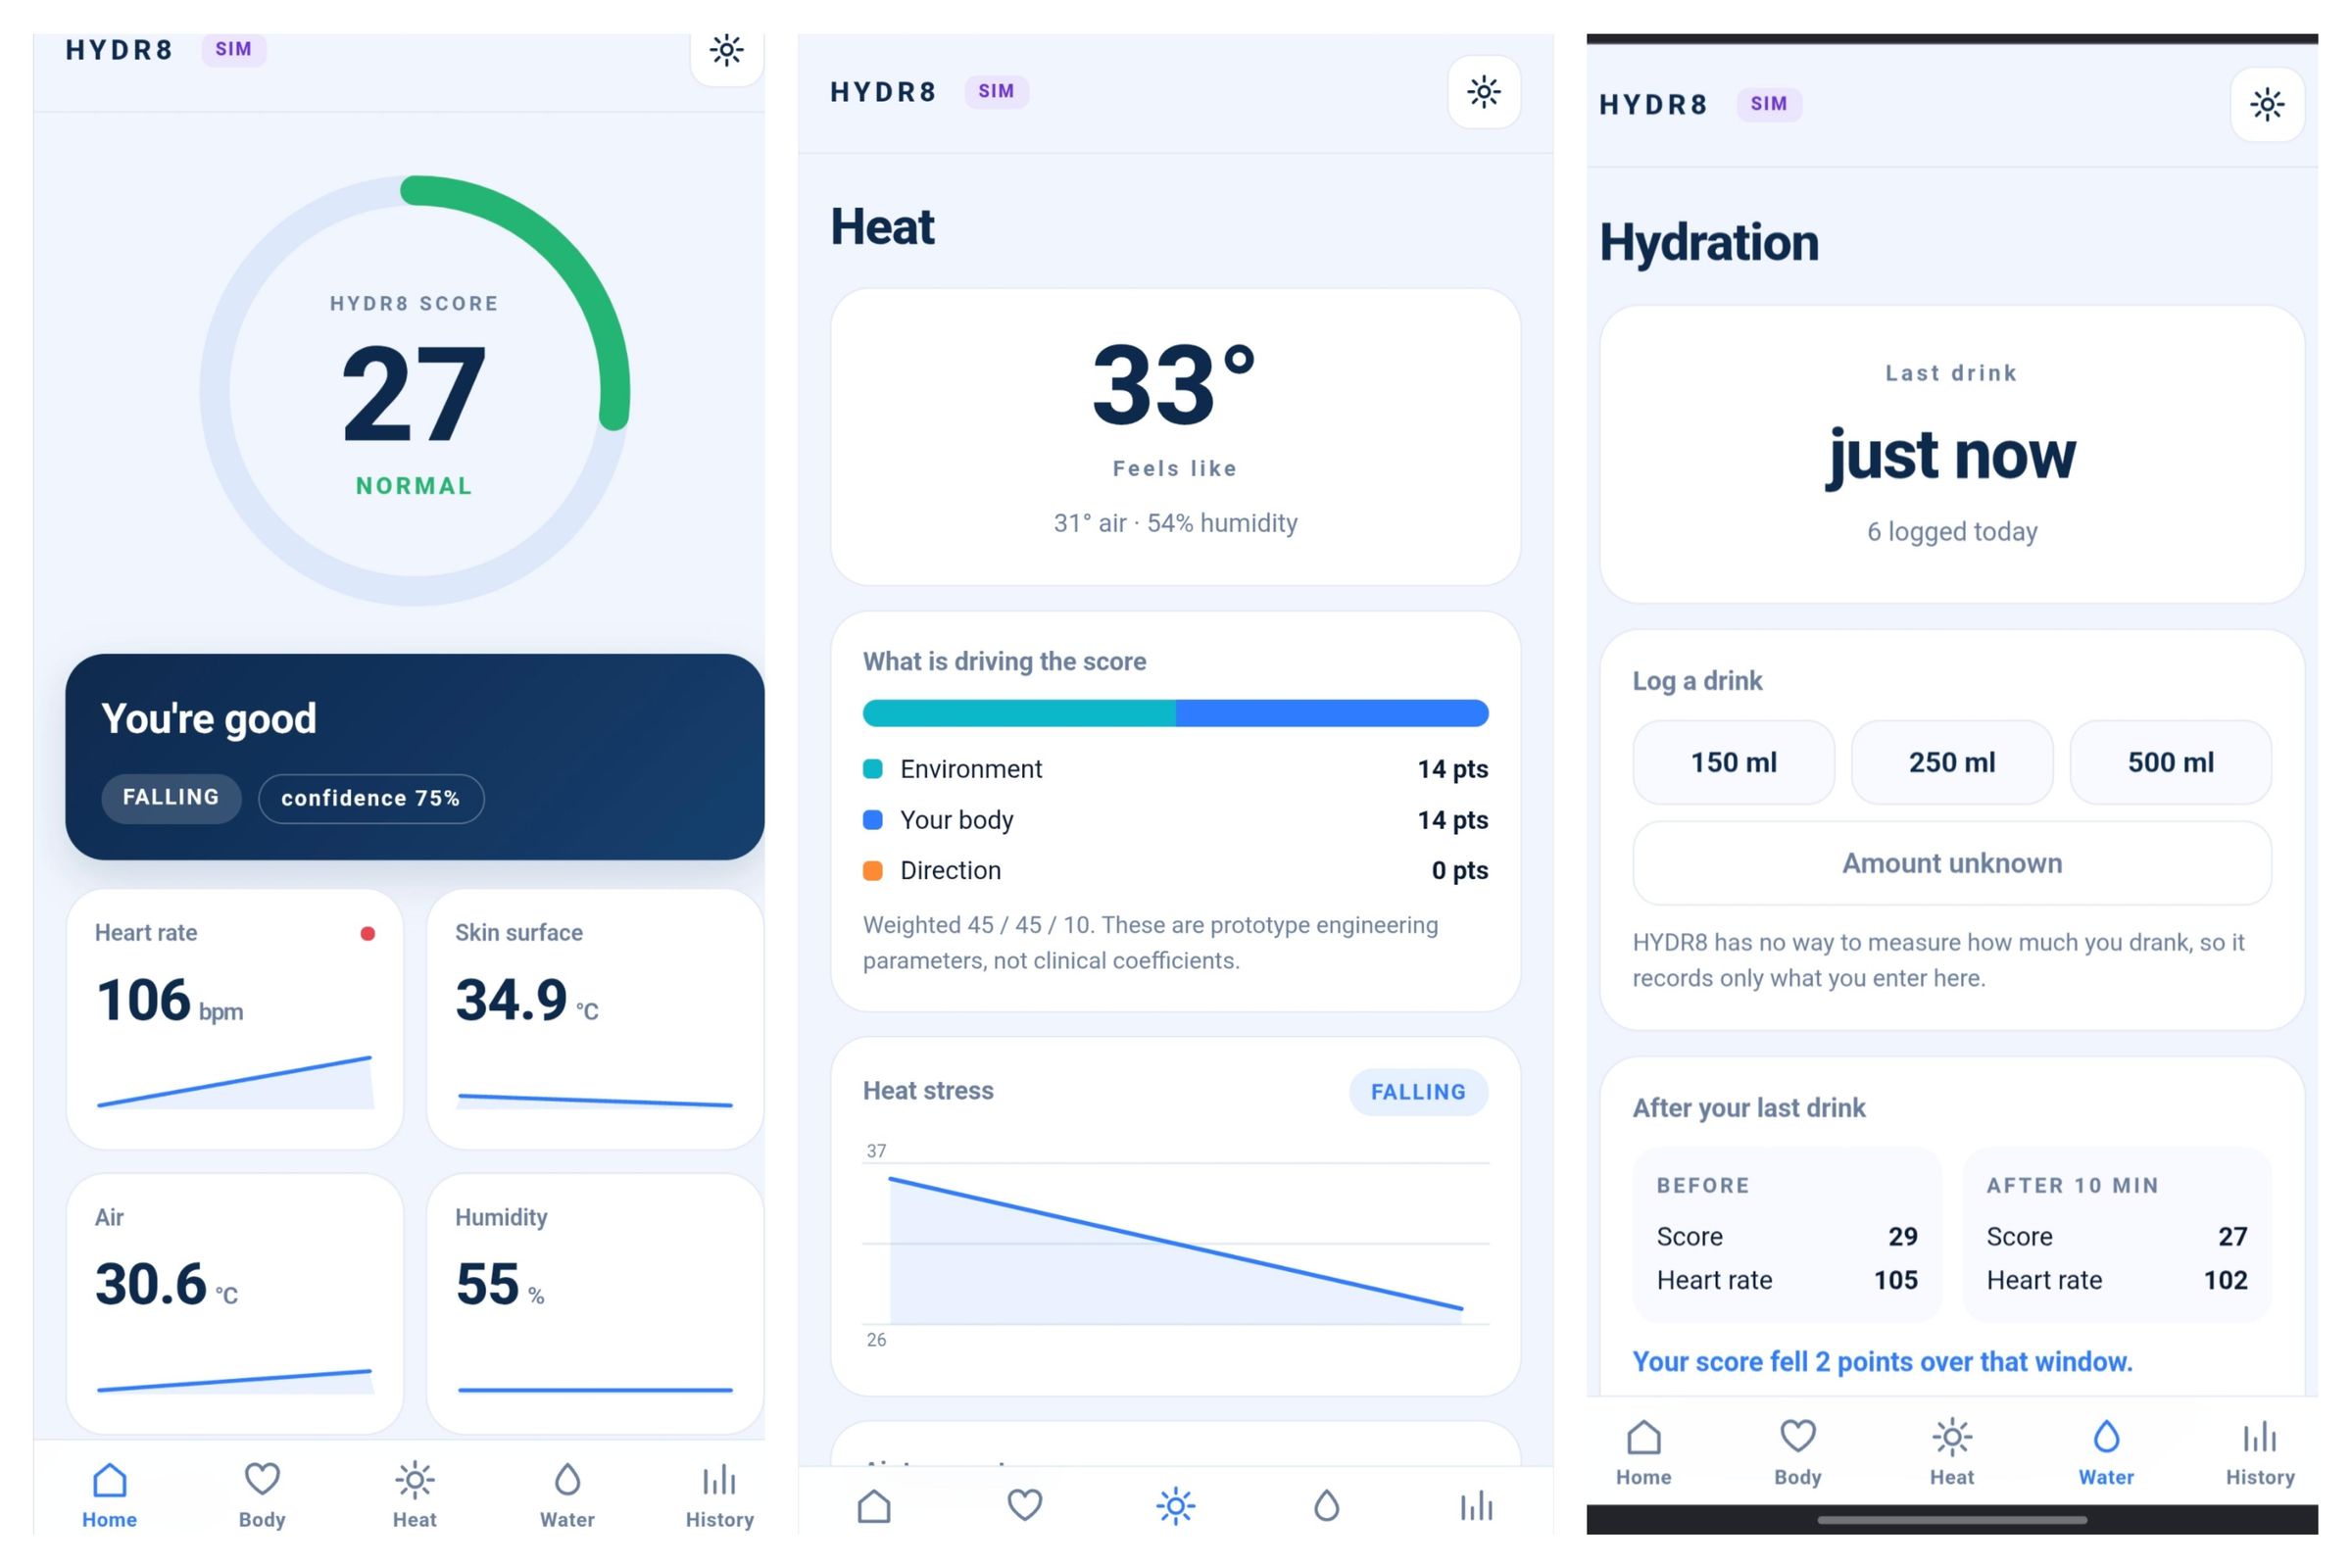
The band deliberately shows almost nothing. Everything interesting lives on a mobile dashboard that the ESP32 hosts itself.
Constraints that shaped it:
No internet. No CDN fonts, no Chart.js, no Tailwind. If it isn't in the flash, it doesn't exist. Everything is vanilla HTML, CSS and JavaScript.
Mobile first. Designed for a 390 px phone screen. Everything else is a bonus.
Small. The whole app is about 37 KB across three files, all in PROGMEM.
Theme
Blue, dark navy text, plenty of white space, rounded cards. Defined once as CSS variables:
css
System font stack, so no downloads and it looks native on both iOS and Android:
css
tabular-nums is a small detail that matters a lot here. Without it, numbers change width as they update and every readout jitters.
Structure and navigation
Five tabs: Home, Body, Heat, Water, History. Plus Settings behind a gear icon. All the pages exist in the DOM at once and get shown or hidden, which is far simpler than routing:
javascript
Bottom nav is fixed with safe-area padding, so it clears the home indicator on modern phones:
css
Live data over WebSocket
The ESP32 pushes a status payload once a second. No polling, no refresh button:
javascript
The backoff matters more than it looks. Without it a disconnected phone hammers the ESP32 with reconnection attempts several times a second, which is exactly when it's least able to cope.
On the firmware side, cleanupClients() runs every second so a phone that stopped reading can't build an unbounded queue and eat the heap:
cpp
The score ring
Pure SVG and one CSS transition. No animation library:
html
css
javascript
Set stroke-dasharray to the circumference, then animate stroke-dashoffset from full to your value. The browser handles the easing on the GPU and it costs you three lines.
The ring colour changes with the band, so the state is readable before you've even read the number:
javascript
The heat contribution bar
This is the piece that makes the algorithm visible. It splits the score into environment, body and direction:
javascript
css
When the cyan section dominates, the heat is coming from outside you and the advice changes accordingly. It turns an abstract number into something you can reason about.
Charts, hand rolled
About 40 lines of SVG path building. No Chart.js, no D3:
javascript
The same function drives the small sparklines on the Home cards and the full charts on Body, Heat and History, just with different dimensions. Sparklines get a filled area underneath by closing the path:
javascript
And when there isn't enough data, it says so instead of drawing a misleading flat line:
javascript
Hydration logging
Four buttons, one fetch, and a small animation:
javascript
css
That void w.offsetWidth line looks like nonsense and isn't. It forces the browser to recalculate layout, which restarts the CSS animation. Without it, tapping the button twice in a row only animates once.
Small touches
The heart rate card pulses in time with a live signal:
css
And the whole thing respects reduced motion, which takes two lines and is the right thing to do:
css
Everything That Went Wrong
1. The display that worked, then didn't:
Problem. The OLED came up perfectly after a fresh upload, ran for a while, glitched, froze, and went black. It stayed black through resets. Meanwhile the web dashboard kept running perfectly.
What I tried. First I assumed the panel was dead and ordered a replacement. Then I assumed it was an SH1106 sold as an SSD1306, which is common and produces exactly this "init succeeds, screen black" signature. Wrote a test sketch for it. Wasn't that either.
The clue I'd been ignoring: the web server never stopped. So the chip was fine and only the I²C side was dying.
What worked. Three things together. The display was only ever initialised once at boot, so when a glitch scrambled the controller nothing ever retried. Adding a watchdog that probes the address every few seconds and re-runs the init fixed the "stays dead forever" half.
Then cutting the traffic. Every frame push is 1 KB in one burst, and at 10 Hz that's constant load on a marginal bus. Hashing the framebuffer and only transmitting when the image actually changed took it from five writes a second to about one a minute.
Then dropping the bus to 50 kHz, adding a 120 ms settle delay before init, and putting proper 4.8 kΩ pull-ups on SDA and SCL.
What I'd tell you. Put the pull-ups on from the start. The days I lost to "the display is broken" were really "the I²C bus is marginal," and the resistors cost about two rupees.
2. A false theory that cost me a day:
Problem. During the above, I convinced myself that Adafruit's display.begin() was the culprit, because its periphBegin argument defaults to true and calls Wire.begin() with no arguments, which sounded like it would re-bind I²C to the chip's default pins.
What I tried. Passed false, false to stop it touching the bus. This broke the display completely, on a board where the original call had worked fine.
What worked. Reverting. On current ESP32 cores, Wire.begin() with no arguments preserves pins that were already set, so the original call was harmless all along.
The irony is that this failure mode is real, just not where I thought. It bites in the recovery path, if you call Wire.end() first, because ending the peripheral genuinely does clear the stored pins. I created the exact bug I'd wrongly diagnosed.
What I'd tell you. "It worked before" is stronger evidence than any theory you can construct about why it shouldn't have.
3. I used a strapping pin:
Problem. I wired the I²C bus to D0 and D1, which are GPIO2 and GPIO3, because it suited my perfboard layout. Intermittent boot failures followed.
What worked. Moving to D4 and D5 (GPIO6 and GPIO7).
GPIO2 is a strapping pin on the ESP32-C3 and is read at boot to decide how the chip starts. I²C pull-ups usually hold it high enough that it mostly works, which is the worst possible failure mode, because you get a board that boots fine four times and then doesn't, and you blame your code.
What I'd tell you. Check the strapping pins before you design your perfboard layout. GPIO2, GPIO8 and GPIO9 on the C3.
4. Serial went completely silent:
Problem. After fixing a bootloader error, the board printed nothing at all. No banner, no errors.
What I tried. Different cable, different port, different baud rate.
What worked. Two things. USB CDC On Boot had reset to Disabled in the board settings, which routes Serial to the hardware UART pins instead of USB, so the board was printing happily into pins I had nothing connected to.
And in the firmware, delay(300) before the first print was racing USB enumeration, which takes up to two seconds on the C3. Waiting for the port properly with a timeout fixed it for good.
What I'd tell you. If Serial is dead on a C3, check USB CDC On Boot before you check anything else.
5. Name collisions in a modular project:
Problem. The project wouldn't compile. TREND_RISING was declared both as a float threshold in config.h and as an enum value in types.h. Since types.h includes config.h, the float won and the enum failed to declare.
What worked. Renaming the thresholds to SLOPE_RISING, SLOPE_RAPID and so on. Two files, eight lines.
What I'd tell you. The compiler flags the line where it noticed the clash, not the line that caused it. The error pointed at types.h, but the fix belonged in config.h. Read the note: previous declaration line, that's the actual culprit.
6. Files getting mixed up between versions:
Problem. Compile errors about constants that definitely existed. An old config.h had survived next to new .cpp files after an extraction.
What worked. Moving display-private constants out of config.h and into oled_ui.cpp, so that file compiles regardless of what config.h it sits beside. And deleting the folder entirely before extracting a new version rather than overwriting.
Adding a version string that prints on boot also helps a lot:
Thirty seconds of work that tells you instantly whether you're running what you think you're running.
What HYDR8 Can Do
Live physiological monitoring. Heart rate and blood oxygen from the MAX30102, skin-surface temperature from the MLX90614, all filtered and validated rather than shown raw.
Environmental monitoring. Ambient temperature and humidity from the SHT31, combined into a heat index so 35 °C dry and 35 °C humid are treated as the different problems they are.
Personal baseline. A 60 second calibration captures your resting heart rate, skin temperature and SpO₂. Everything physiological is then measured as a deviation from your own numbers, not a population average.
The HYDR8 score. One number from 0 to 100 estimating heat and hydration stress, split internally into environmental and physiological contributions so you can see where it's coming from.
Confidence indicator. Drops when a sensor is missing, when the pulse signal is noisy, or when no baseline exists. The dashboard shows it, so you know how much to trust the number.
Trend detection. Five states from STABLE through RAPIDLY RISING to RECOVERING, computed from the slope of recent scores.
Actionable recommendations. Normal, Hydrate Soon, Drink Water, Take a Break, Cool Down, Find Shade. The distinction between "drink" and "get out of the sun" is based on which half of the score dominates.
Adaptive reminders. The interval stretches when you're comfortable and shrinks as stress rises, with an urgent override for high and climbing, and a hard three minute floor so it can never nag.
OLED alerts. Clock by default, full screen inverted alert when something matters, then back to the clock.
Water logging. Log 150, 250, 500 ml or an unstated amount from the dashboard. It records what you tell it and doesn't pretend to know more.
Recovery analysis. Compares your measured state before a logged drink and ten minutes after, worded as an observation rather than a causal claim.
Mobile dashboard. Five tabs, live WebSocket updates, hosted entirely by the ESP32. No app, no account, no internet.
History and insights. Two hours of rolling data at one point per minute, charted, with simple rule-based observations that stay silent when there isn't enough data to say anything true.
Offline by design. No cloud, no telemetry, no account. If your router is off, connect to the band's own hotspot and everything still works.
Was It Worth It?
I still forget to drink water. That hasn't magically changed. But I now have a much better answer to the question that started this, which was less about hydration and more about why every reminder I'd ever used was so obviously dumb.
The thing I'm most pleased with isn't the score. It's the moment the recommendation logic tells you to find shade instead of drink water. That's a small piece of code, maybe fifteen lines, and it only became possible because the score is split into environmental and physiological halves instead of being one opaque number. A better answer came out of a better internal representation, which is a lesson that generalises well beyond this project.
The things I learned that I'll actually reuse: don't concatenate String on an ESP32, ever. Design your enclosure after you know how tall the real stack is. Check the strapping pins before you commit a perfboard layout. And when something worked yesterday and doesn't today, believe the history rather than the theory you just invented.
What I'd improve. The skin-versus-core temperature substitution is the weakest link in the algorithm and I know it. It's defensible for a prototype but it's the thing standing between this and a number that means more. Adding an accelerometer would help enormously too, because a raised heart rate means something completely different when you're running than when you're sitting still, and right now HYDR8 can't tell those apart. GSR would add a real sweat signal rather than inferring one. And the weights are honestly guesses that would benefit from being fitted against actual data rather than my intuition.
Longer term, a smart bottle that logs volume automatically would close the loop properly, since right now the device only knows what you tell it.
And to be clear one more time: HYDR8 is an experimental heat and hydration stress estimator. It does not measure how hydrated you are, it is not a medical device, and it should not be used to make decisions about anyone's health. It's a prototype that estimates stress from signals that relate to it, built by a student who was annoyed at his phone.