Measuring the Magnetism With an Arduino
by 011raw01 in Outside > Survival
811 Views, 2 Favorites, 0 Comments
Measuring the Magnetism With an Arduino
.jpg)
Riley,Mary,Gabe
Research Information


We first established that we wanted to measure the magnetism using the Arduino. The sensor that measures magnetism is the Linear Hall sensor. We then had to find coding and wiring that would work and show data through graphs or numbers.
The next step that we took for our experiment was designing our cubesat. We had to meet all the requirements of not weighing more than 1.33 kg, had to be 10x10x10 with a 10% fail cushion, etc.
Mary
Build and Design Cubestat


For the design of our cubesat we used popsicle sticks, hot glue, hinges, and metal supports for the corners. We first built the sides of the cubesat. We created 4 of the sides to have a cross intersection and then two with an X intersection (6 total sides). After we glued the sides together first and added support on two of the corners, then added the bottom. The last step we took was adding 2 hinges on one of the sides and glued that to the front side so it could open and close (like a door) and then added the top to complete our cubesat.
Materials:
-24 popsicles cut to 10 mm length (for the square shape of each side)
-10 regular length popsicles for the interior cross sections of each square side
-8 10 mm length popsicle sticks for the shelf
-a flat metal piece for the shelf (just has to fit for a shelf/can be bigger or smaller than what we used)
-3 small hinges
-2 metal corner supports
-lots and lots of hot glue
Mary
Wire the Arduino (for Linear Hall)


This is the wiring for just the linear hall.
The orange wire goes to first peg (left on linear hall) to AO on arduino. The green wire goes to 5V on Arduino. The green wire goes to GND on Arduino. The blue wire goes to pin number 3 on the Arduino.
*you can choose to use the LED light but in our final design we did not
This is the only wiring you will have to do for the LINEAR HALL.
Mary
The Final Wiring
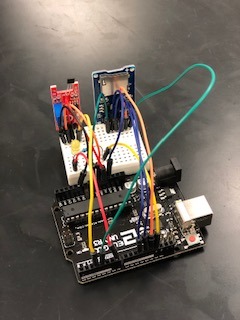

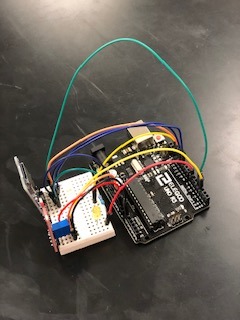
This is the final wiring with the both the Linear Hall Sensor and SD Card.
This will allow it to collect the data while in orbit. You already have the Linear Hall Sensor wired up, you will just have to add the SD Card in now.
SD Card Wiring:
Connect your GND on the SD Card to the Ground on Arduino
Connect VCC on the SD Card to the 5v on Arduino
Connect CS to the 4 on Arduino
Connect MOSI to the 11 on Arduino
Connect the SCK to the 13 on Arduino
Connect the MISO to the 12 on Arduino
Add an LED display on the breadboard as shown in the pictures
add a wire from the left wire of the LED display to pin number 7 on the Arduino
Next attach one side of a resistor to the right wire of the LED display
Finally add a wire to the other end of the resistor and then attach that to GND on the Arduino (look at the fritzing if you need help)
Riley
The Prelim Tests
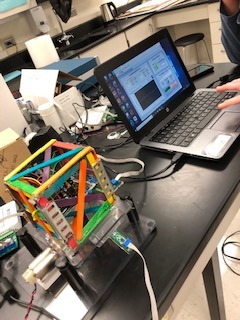

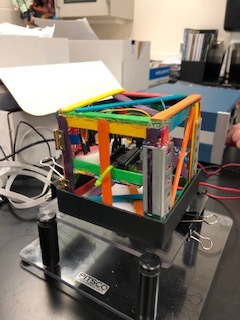
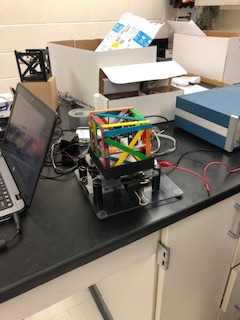
In the Prelims you will have to test the vibrations and the flight with your Arduino and sensors in your Cubestat. Flight test not pictured.
These series of tests were made to determine if your Arduino is ready for flight.The vibrations test is made to see if your Cubestat is ready to fly on a rocket and make it to Mars. Our cubesat vibrated 5 times in one second during the vibrations test. If your Cubestat isn't ready for flight, problems will occur in these tests. These problems can include:
- Your Arduino turns off
- Your battery falls out
-Your Cubestat breaks
- Wires come loose
If no problems occur your Cubestat is ready to fly!
Riley
Fritzing Diagram
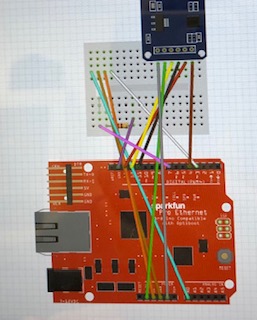
This is the step in our project where we recreate our Arduino wiring through Fritzing.
Fritzing is an open source for anyone to access. It allowed us to transfer our real arduino with wiring, to an online one. Fritzing.com consists of all the tools necessary such as an LED, wires, breadboard, resistors, and more! It also has sensors which help measure specific types of data. This is a great website that allowed our group a quick and easy way to make our arduino and wiring online.
To do this......
1. First we used the search bar to find an Arduino Uno and a breadboard.
2. After placing those on the grid, we searched for Linear Hall Effect sensor and an SD Card reader. Next place those in the same position as they are on the actual arduino.
3. Next, search for the wires and place them in the desired spots. (Change the colors to make it less confusing an more appealing.)
4. The next step it to find an LED and Resistor and place them in the same spots as showed on your own arduino.
5. Your Arduino/Breadboard setup should now look similar to your own; good luck!
Gabe
Coding for Project
#include <SD.h>
#include <SD.h>
#include <Wire.h>
int led = 13 ; // LED on arduino
int digitalPin = 3; // linear Hall magnetic sensor digital interface
int analogPin = A0; // linear Hall magnetic sensor analog interface
int digitalVal ; // digital readings int analogVal; // analog readings
float magnetism; //variable to hold magnetic flux
File magnetData;
void setup ()
{
pinMode (10, OUTPUT); //must set pin 10 to output even if not used
pinMode (7, OUTPUT); //setting pin 7 to light up led
SD.begin(4); //begins sd card with CS set to pin 4
pinMode (led, OUTPUT);
pinMode(digitalPin, INPUT);
pinMode(analogPin, INPUT);
Serial.begin(9600);
Serial.println(F("Magnetism"));
}
void loop()
{
magnetData = SD.open("log.txt", FILE_WRITE); //opens file called "Log" if (magnetData) { //will only do rest if file successfully created
if (magnetData) {
Serial.print("Magnetism = ");
}
// Read the analog interface
analogVal = analogRead(analogPin);
Serial.println(analogVal); // print analog value
}
magnetData.print(magnetism);
magnetData.close();
digitalWrite(7, HIGH);
delay(500); digitalWrite(7,LOW);
delay(500);
}
Collecting Data and Understanding It


This is what we used to measure the amount of magnitude. You will need to use the the same program that you used for the coding (Arduino IDE). When you have the Arduino plugged into a power source and all the lights that are indicating that it is on and working go to "tools" in the top left and click "serial plotter". When that loads a graph like the pictures shown above will pop up.
When no magnetism is being measured the graph will show a straight flat line and the number that appears is 547 (you can look at the number data by going to "tools" and then clicking serial monitor").
When magnetism is being measured it will create spikes and movement
The spikes that are measured below the straight constant line is created by measuring the negative side of the magnet. When the spikes go above the straight constant line the sensor is measuring the positive side.
The bigger the spikes means that a big amount of magnetism is being measured and the smaller the spikes means a small amount of magnetism is being measured.
Finally when the spikes are closer it shows that the magnetism had a really fast movement and got closer or farther in a really abrupt movement (pulled away/closer really fast).
Gabe
Testing Results
The Data that we collected is below. When magnetism wasn't being measured it displayed 547. As you can see the magnetism wasn't that strong and barely changed throughout the whole test. The magnitude increased more at the end of the testing (the smaller the number displayed shows more magnitude being measured). We set the Variac to a speed of 90 and timed it for one minute.
Here is a scatter plot of our results. We tested for 1 minute at a speed of 3.67 using the variac (which showed 90). The scatter plot shows the magnetic fluctuation over a span of about 30 seconds. As you can see it did not fluctuate much.
Riley