Scatterplot Using Python Matplotlib
by matt392 in Circuits > Computers
40 Views, 0 Favorites, 0 Comments
Scatterplot Using Python Matplotlib

# All comments are hand written by Matt R
# import the matplotlib library
# under the variable "plt"
import matplotlib.pyplot as plt
# import the pandas library as variable "pd"
import pandas as pd
#import the numpy library as variable "np"
import numpy as np
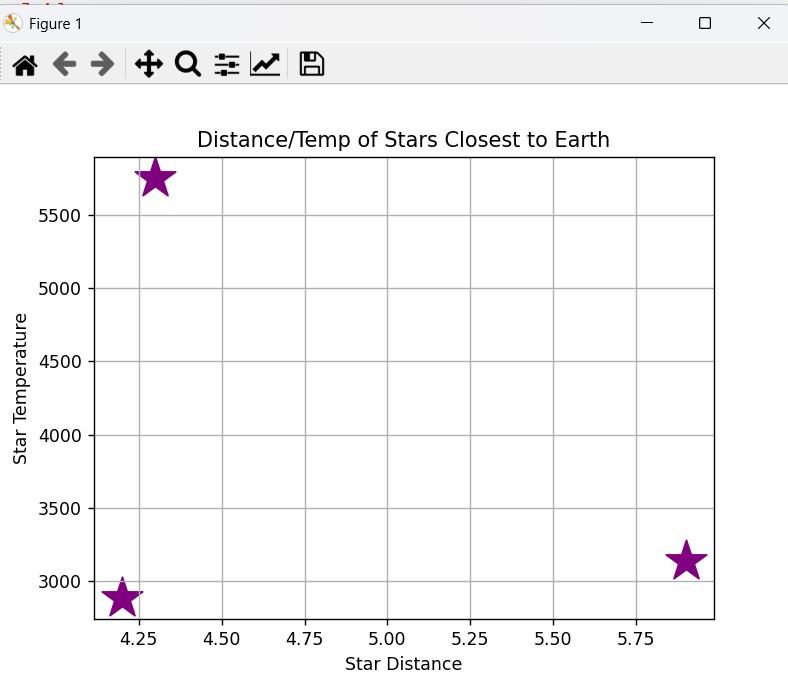
# Data taken from Wikipedia
# 3 stars closest to Earth
lightyears = [4.2, 4.3, 5.9]
temp = [2883, 5753, 3134]
# Scatterplot example
# Subplot creates a figure similar to a painting canvas
fig, ax = plt.subplots()
# Used Claude.ai to assist with next line
# Creates a scatterplot, with the line purple
# Data points marked with "*"
# The "s" parameter makes the star bigger
# The default size is quite small; maybe 20
ax.scatter(lightyears, temp, color='purple', marker="*", s=600)
# Sets title
ax.set_title("Distance/Temp of Stars Closest to Earth")
# Sets x axis name
ax.set_xlabel("Star Distance")
# Sets y axis name
ax.set_ylabel("Star Temperature")
# generate a full grid
plt.grid()
# show plot on screen
plt.show()
Downloads
Supplies

- Python
- Matplotlib library
- Distance and temperature data for 3 stars closest to Earth
Simple Scatterplot Using MatplotLib

# All comments are hand written by Matt R
# import the matplotlib library
# under the variable "plt"
import matplotlib.pyplot as plt
# import the pandas library as variable "pd"
import pandas as pd
#import the numpy library as variable "np"
import numpy as np
# Data taken from Wikipedia
# 3 stars closest to Earth
lightyears = [4.2, 4.3, 5.9]
temp = [2883, 5753, 3134]
# Scatterplot example
# Subplot creates a figure similar to a painting canvas
fig, ax = plt.subplots()
# Used Claude.ai to assist with next line
# Creates a scatterplot, with the line purple
# Data points marked with "*"
# The "s" parameter makes the star bigger
# The default size is quite small; maybe 20
ax.scatter(lightyears, temp, color='purple', marker="*", s=600)
# Sets title
ax.set_title("Distance/Temp of Stars Closest to Earth")
# Sets x axis name
ax.set_xlabel("Star Distance")
# Sets y axis name
ax.set_ylabel("Star Temperature")
# generate a full grid
plt.grid()
# show plot on screen
plt.show()