TAM 335 Lab 6 - Calibration of Flowmeters - an Instructable for a New Hire
by anilam3 in Workshop > Science
23 Views, 0 Favorites, 0 Comments
TAM 335 Lab 6 - Calibration of Flowmeters - an Instructable for a New Hire
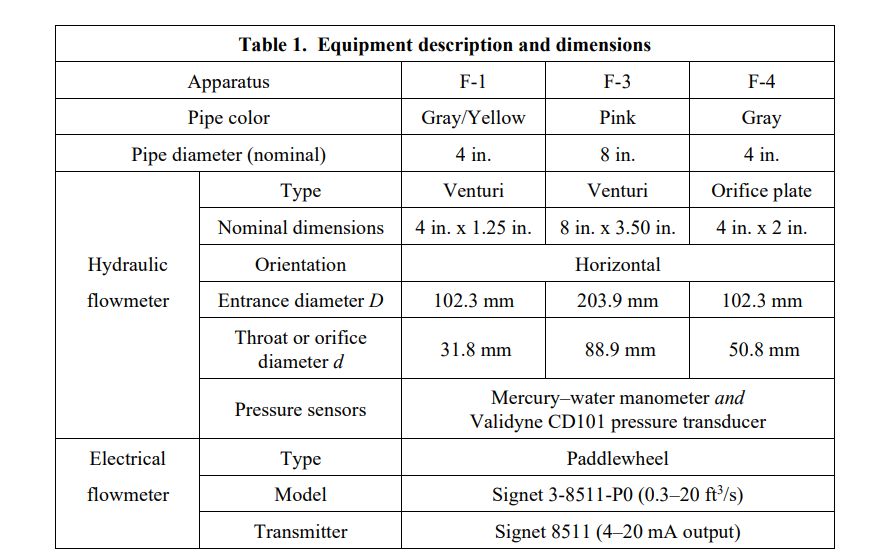
In this experiment, you will be calibrating devices that use pressure differences to determine flow coefficients as functions of the Reynolds number that ultimately measure how much fluid moves during a state known as "bulk-flow," where fluid moves down a pressure gradient (from an area of high pressure to an area of low pressure). The flow coefficients you obtain from your experiments will then be compared with ISO standard values for similar devices. Additionally, you will also calibrate a paddlewheel flowmeter, which measures fluid in the state of bulk flow with an electrical signal.
Supplies
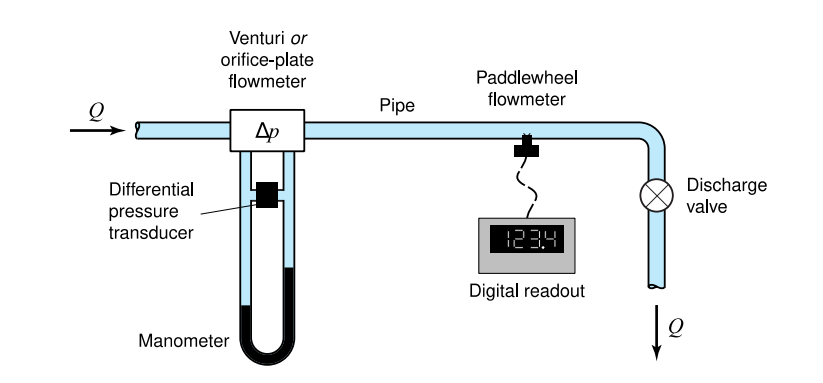
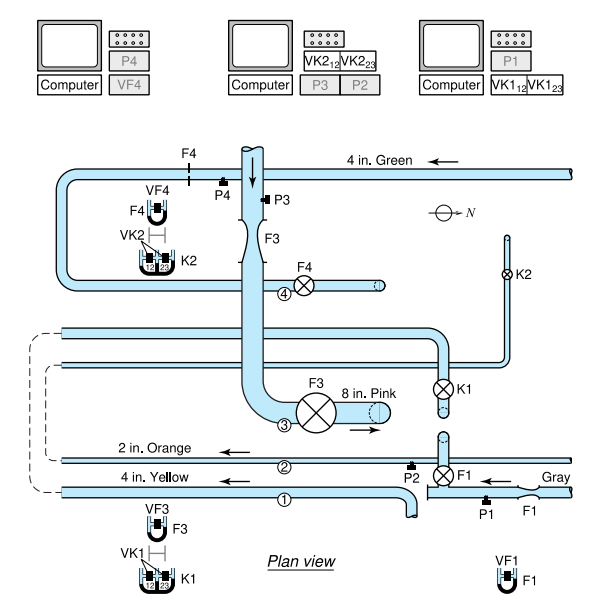
The apparatus for this experiment consists of a pipe on the ceiling of Talbot Laboratory Room 126 fitted with two flowmeters (either a Venturi or orifice-plate flowmeter equipped with a differential pressure transducer, and a paddlewheel flowmeter equipped with a digital display to read the data) as well as a weighing tank located in the basement of the laboratory room.
Procedure
First, calibrate the output voltage from the Validyne differential pressure transducer (attached to the hydraulic flowmeter - either Venturi or orifice-plate). Zero the transducer output on the interface box that is located next to the computer. With the discharge valve closed, open the manometer bleed valve labeled “CAL VALVE” to artificially decrease pressure in one of the manometer lines, and take readings of transducer output (in volts) and manometer levels (in cm) at the same time using LabVIEW software to record the results. Be very careful to not let the mercury overflow into the pipe, as this will ruin the setup and make the rest of the experiment impossible to conduct. Collect five data points from zero pressure differential to the maximum pressure differential possible with the bleed valve fully open. The A/D board cannot accurately read values over 10V, so be careful to ensure you stay under that value. Close the CAL VALVE as soon as all data is collected. You will not touch this valve again.
Next, for data acquisition, ensure that the Gain Adjust control of the paddlewheel flowmeter is set to 6.25 turns for P1 and P4 and set to 3.00 turns for P3. Open the discharge valve (in the middle of the room, on the other side from the computers) slowly until either the valve is fully open, or allowable manometer deflection is reached. Note readings from both the Validyne differential pressure transducer and the paddlewheel's voltage as soon as the Signet paddlewheel voltage takes on a significant nonzero value. At the maximum flow rate, note the manometer readings, note the paddlewheel flowmeter readings, take a weight–time measurement, and, using the LabVIEW software, record the time-averaged 4 pressure-transducer voltages. Make a note of the maximum manometer deflection ∆hmax . For F1 and F3, acquire data only as the flow is going into the weigh tank. As soon as the data is collected, close the discharge valve in order to ensure that the weighing tank in the basement does not flood the basement. Repeat the experiment at slower flow rates so that the ∆h readings read approximately (0.9)2∆hmax, (0.8)2∆hmax, ... (0.1)2∆hmax. Before collecting the data points, ensure that manometer readings are relatively steady.
Linear Scale - Determining If Reliable Relation Exists Between Flow Magnitude and Device Output
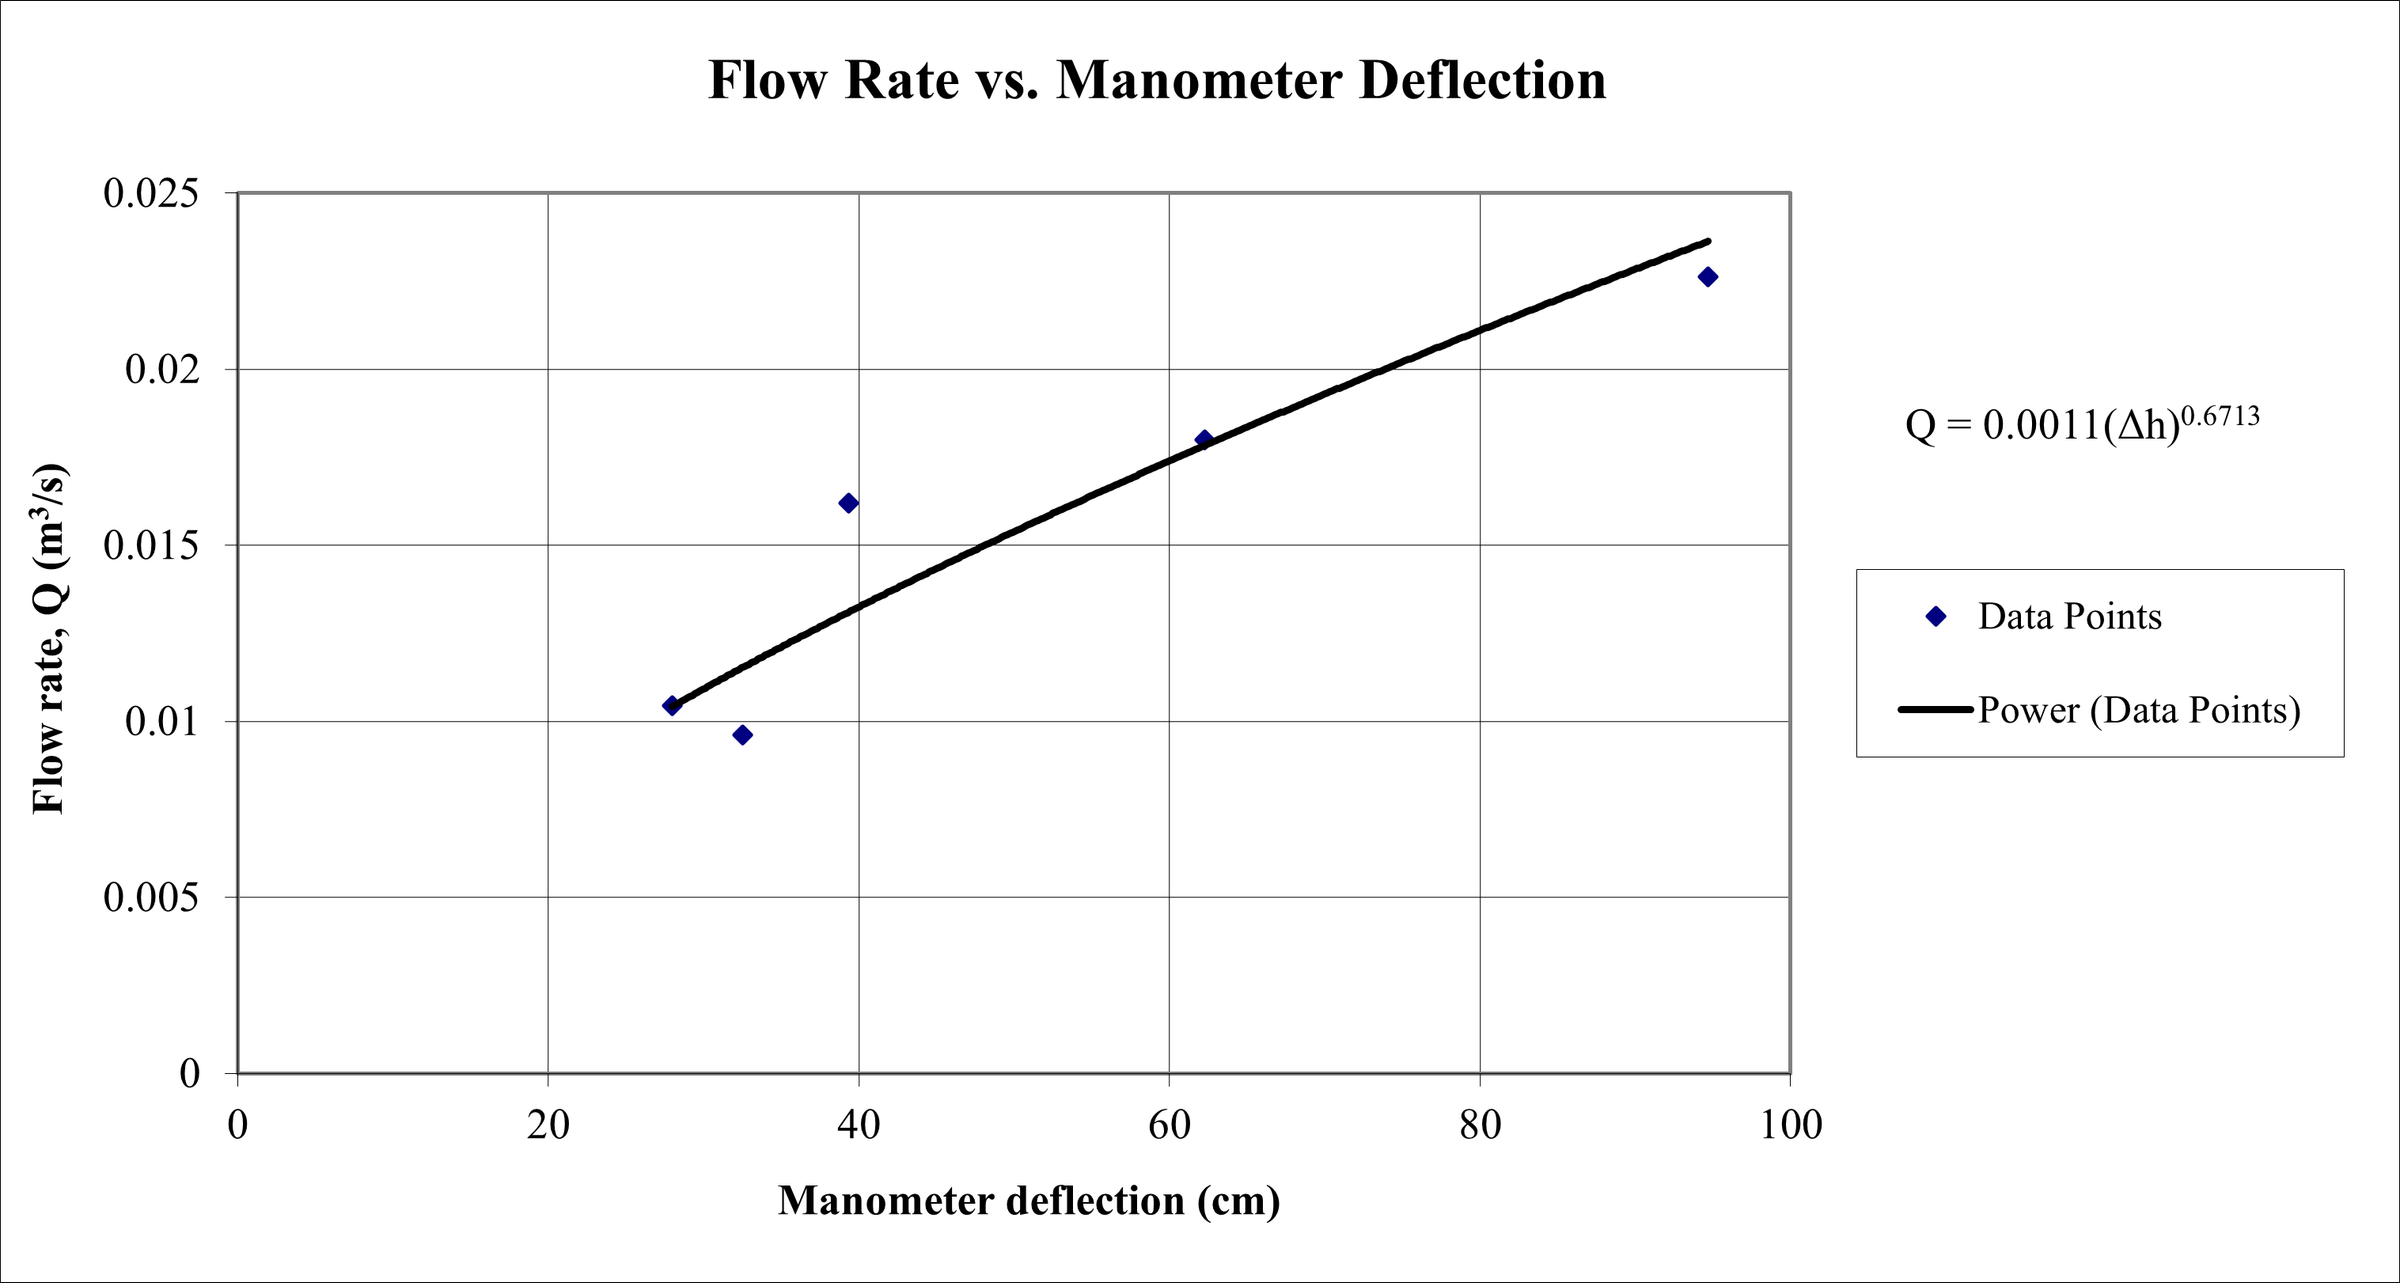
You must determine if a simple, reliable, and consistently increasing/decreasing relationship exists between the flow magnitude and the device's output. The first step in this process is to plot the data points for your measured volumetric flow rate, Q, as a function of the manometer deflection ∆h for the bulk-flow measuring device that relies on pressure changes on a linear scale, and then to pass a smooth curve (not necessarily a linear relationship) through the data. That curve is the calibration curve for the flowmeter.
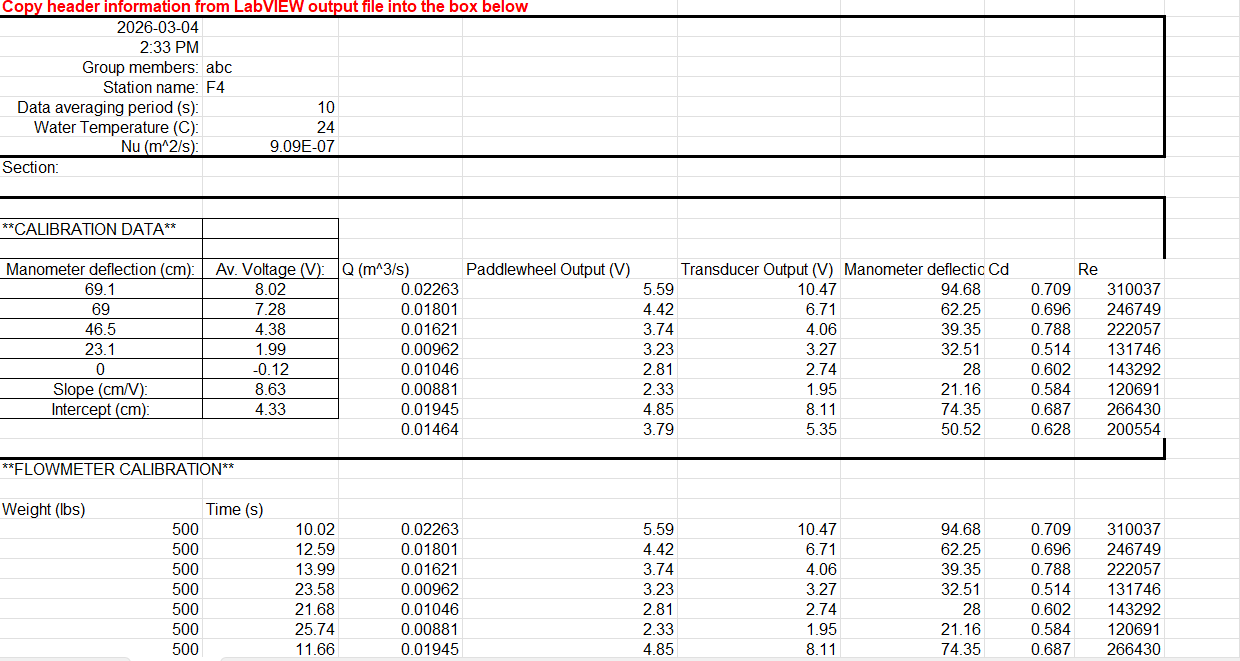
Above is this plot for an experiment conducted on March 4th, 2026.
Logarithmic Scale - Determining If Reliable Relation Exists Between Flow Magnitude and Device Output
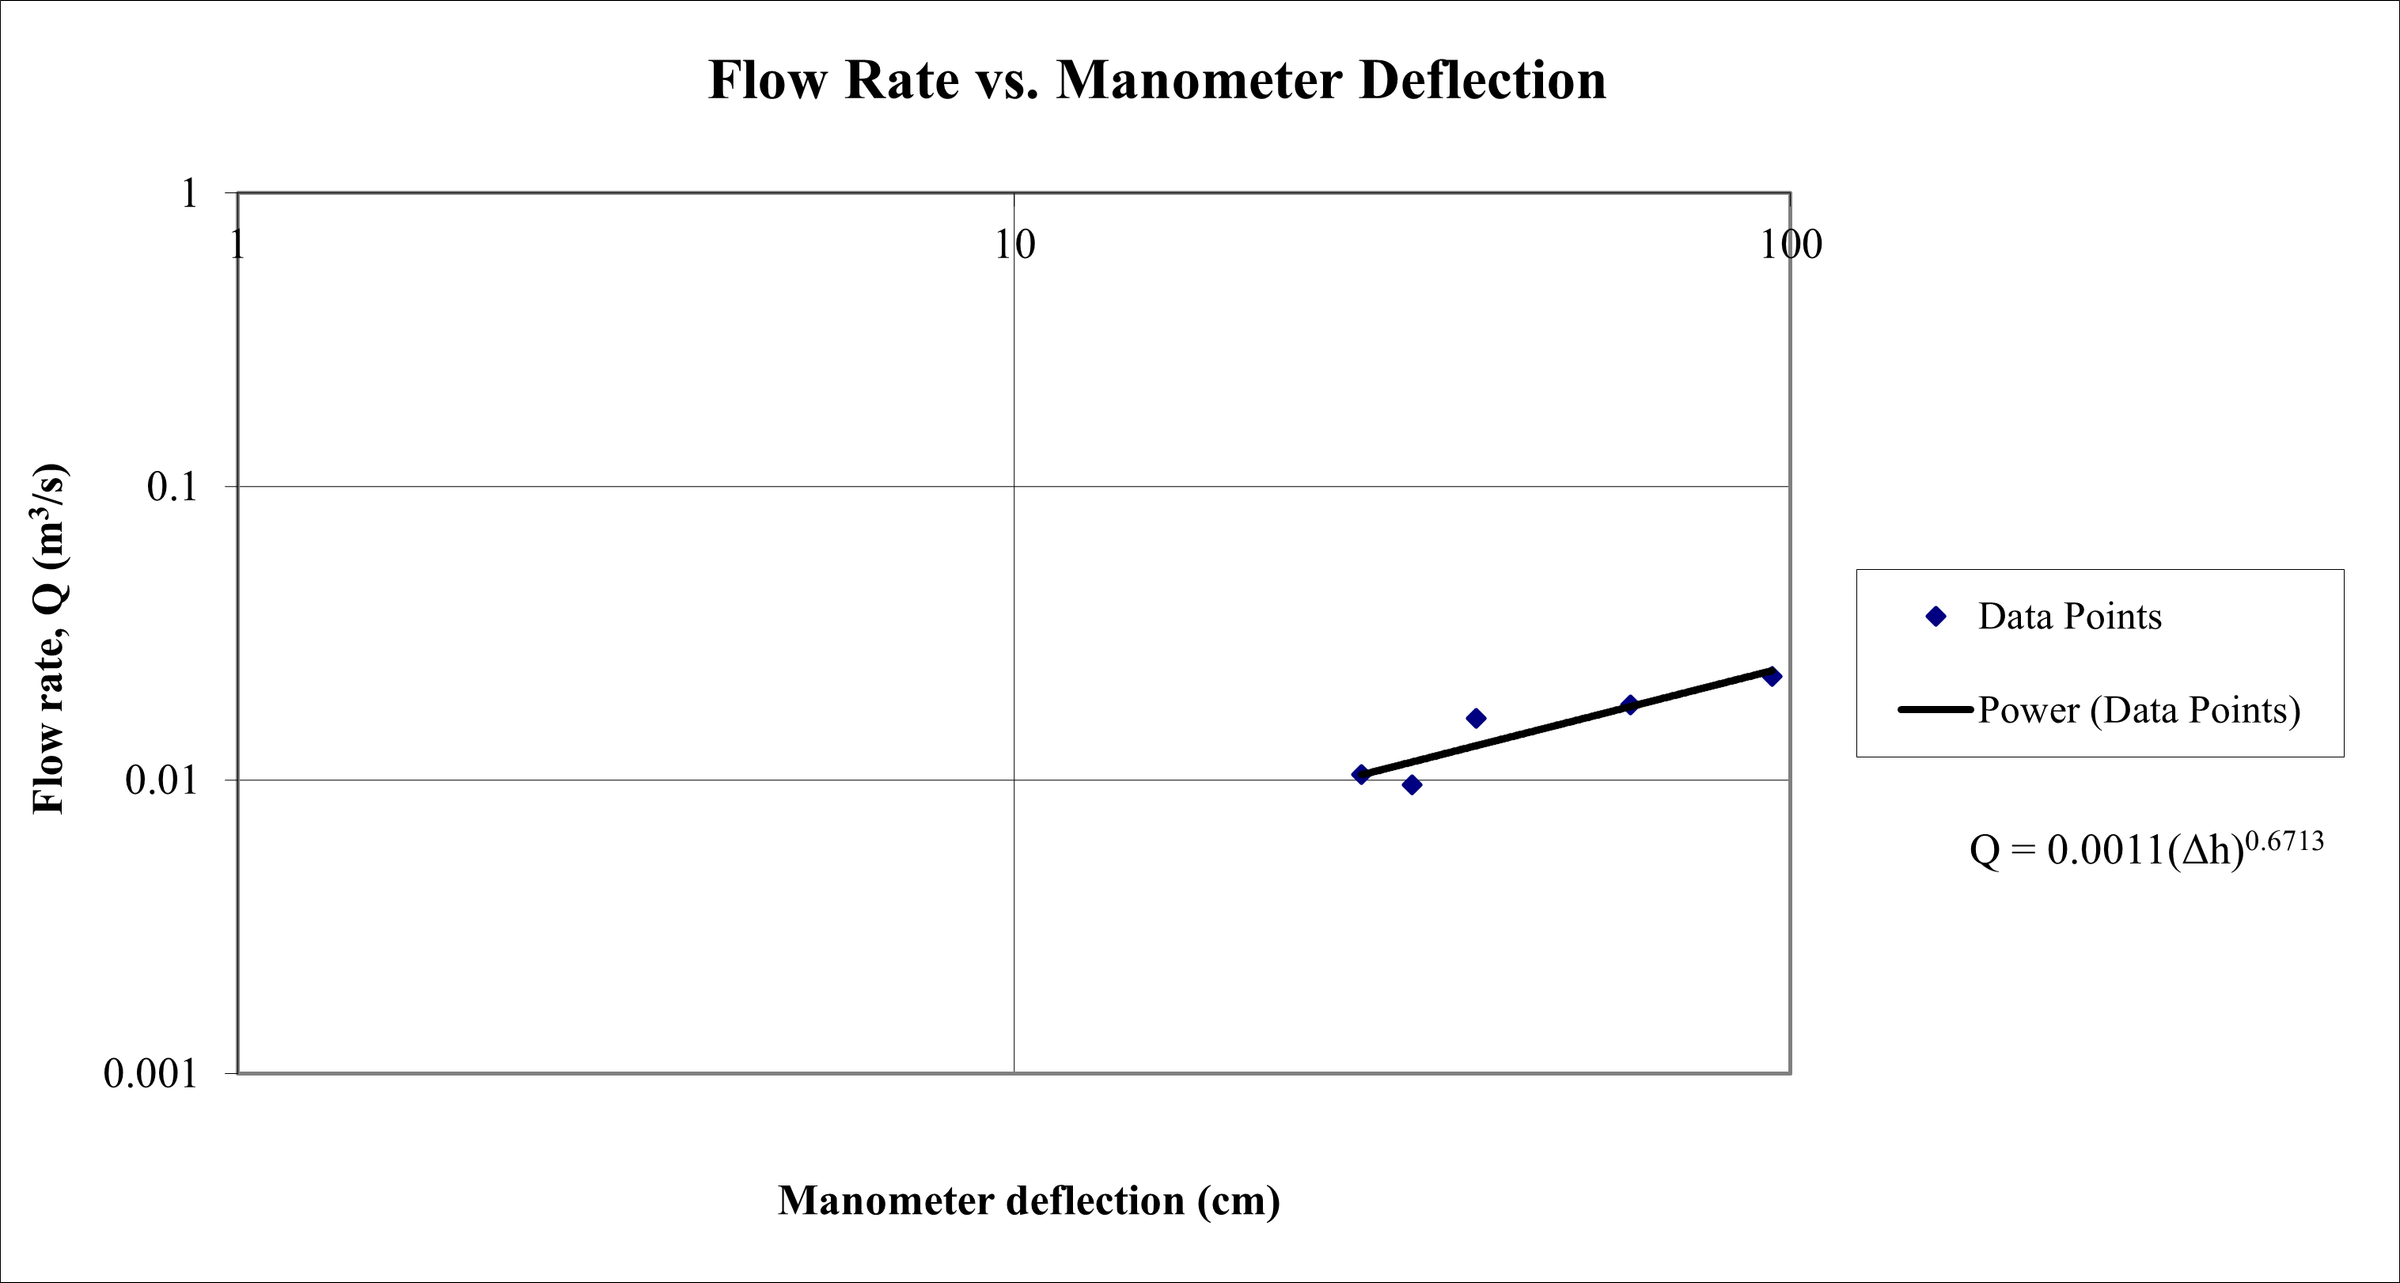
The second step in determining if a sensible relationship exists between the flow magnitude and the device's output is to plot the data points for your measured volumetric flow rate, Q, as a function of the manometer deflection ∆h for the bulk-flow measuring device that relies on pressure changes on a logarithmic scale, and then pass a smooth curve (not necessarily a linear relationship) as before through the data. This curve is an alternative calibration curve for the flowmeter, and you should check to see if the data appears to fall on a straight line. If so, a power-law relation of the type Q = K(∆h)ᵐ may apply.
In the data above, the data does appear to fall on a straight line and that power-law relation appears to apply, where K = 0.0011 and m = 0.6713.
Relation Between Cd and Reynolds Number - Determining If Reliable Relation Exists Between Flow Magnitude and Device Output
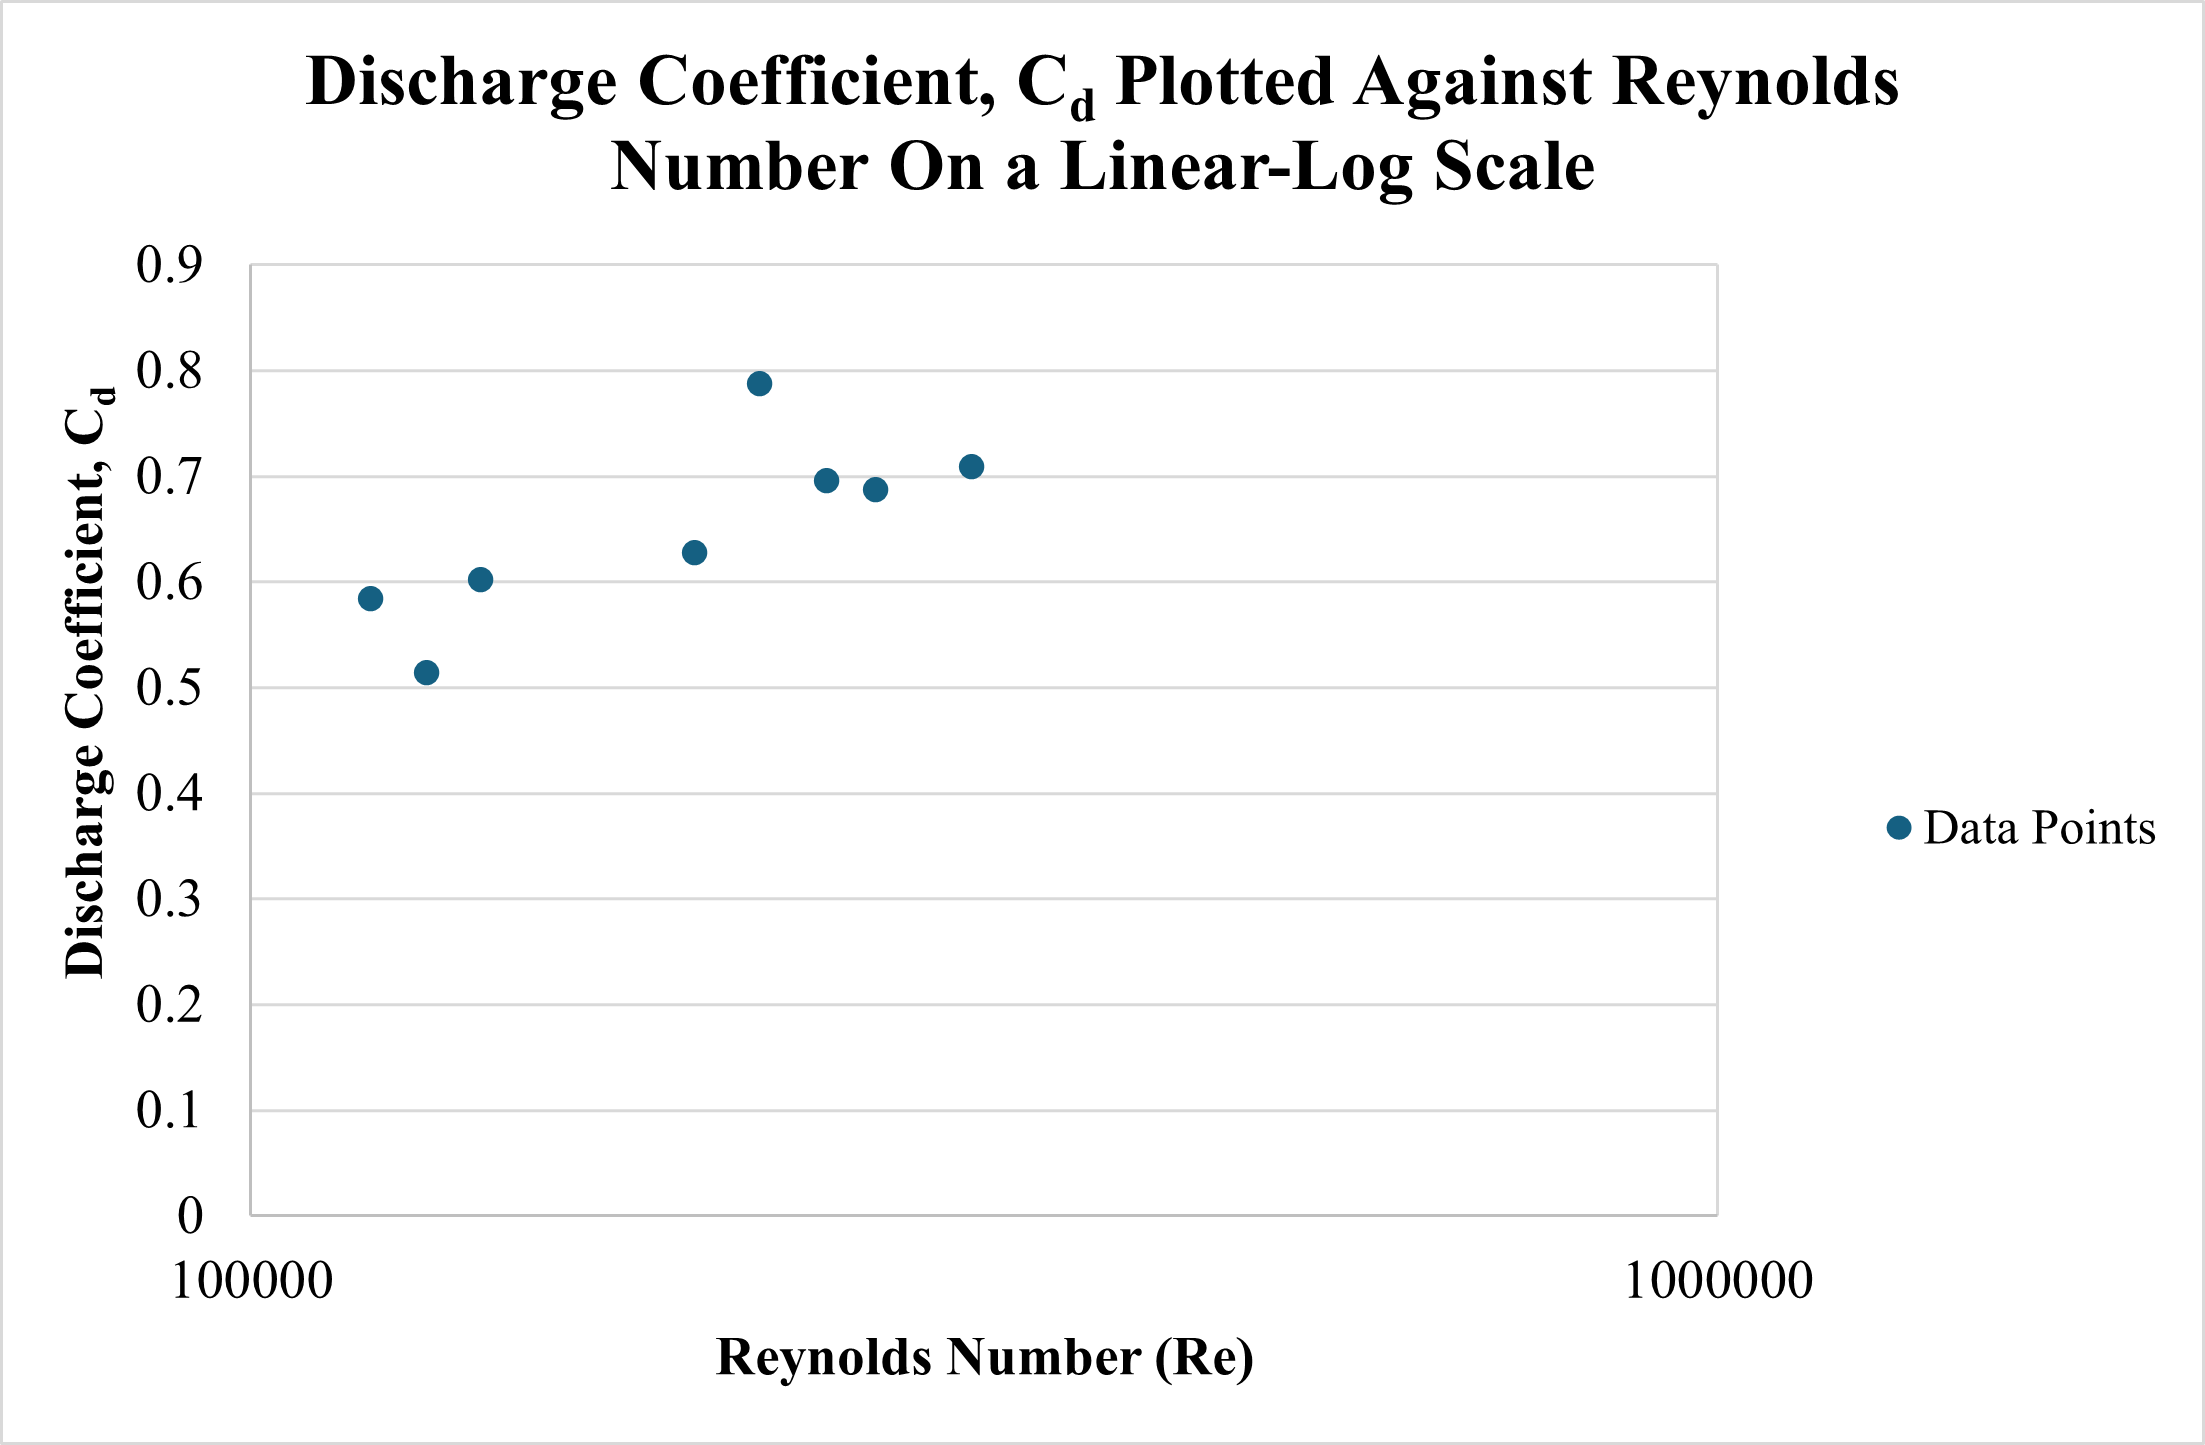
Using the values from the calibration curve (as determined in Step 2), plot the discharge coefficient Cd as a function of the Reynolds number on linear–log scales. Remember that the Reynolds number is calculated using the full pipe's diameter D and the velocity in the pipe V₁ as such: ReD = (V₁*D)/ν, where ν (read as "nu") is viscosity obtained from calculations in the LabVIEW software using the temperature of water obtained during calibration.
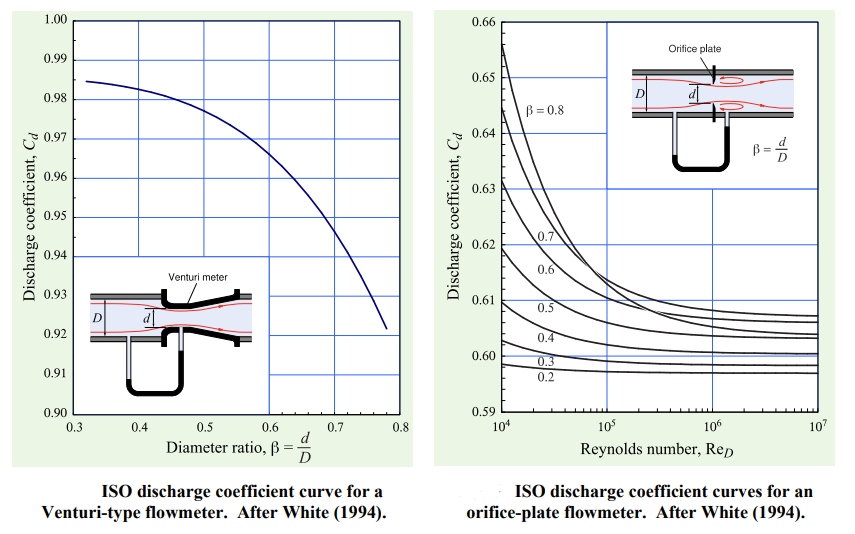
For the data obtained from the experiment conducted on March 4th, 2026, the plot is as above, and can be compared with ISO curves for the Venturi flowmeter and the orifice-plate flowmeter.
Calibration Curve for Paddlewheel Flowmeter - Determine If Voltage Is Proportional to Fluid Velocity in Pipe
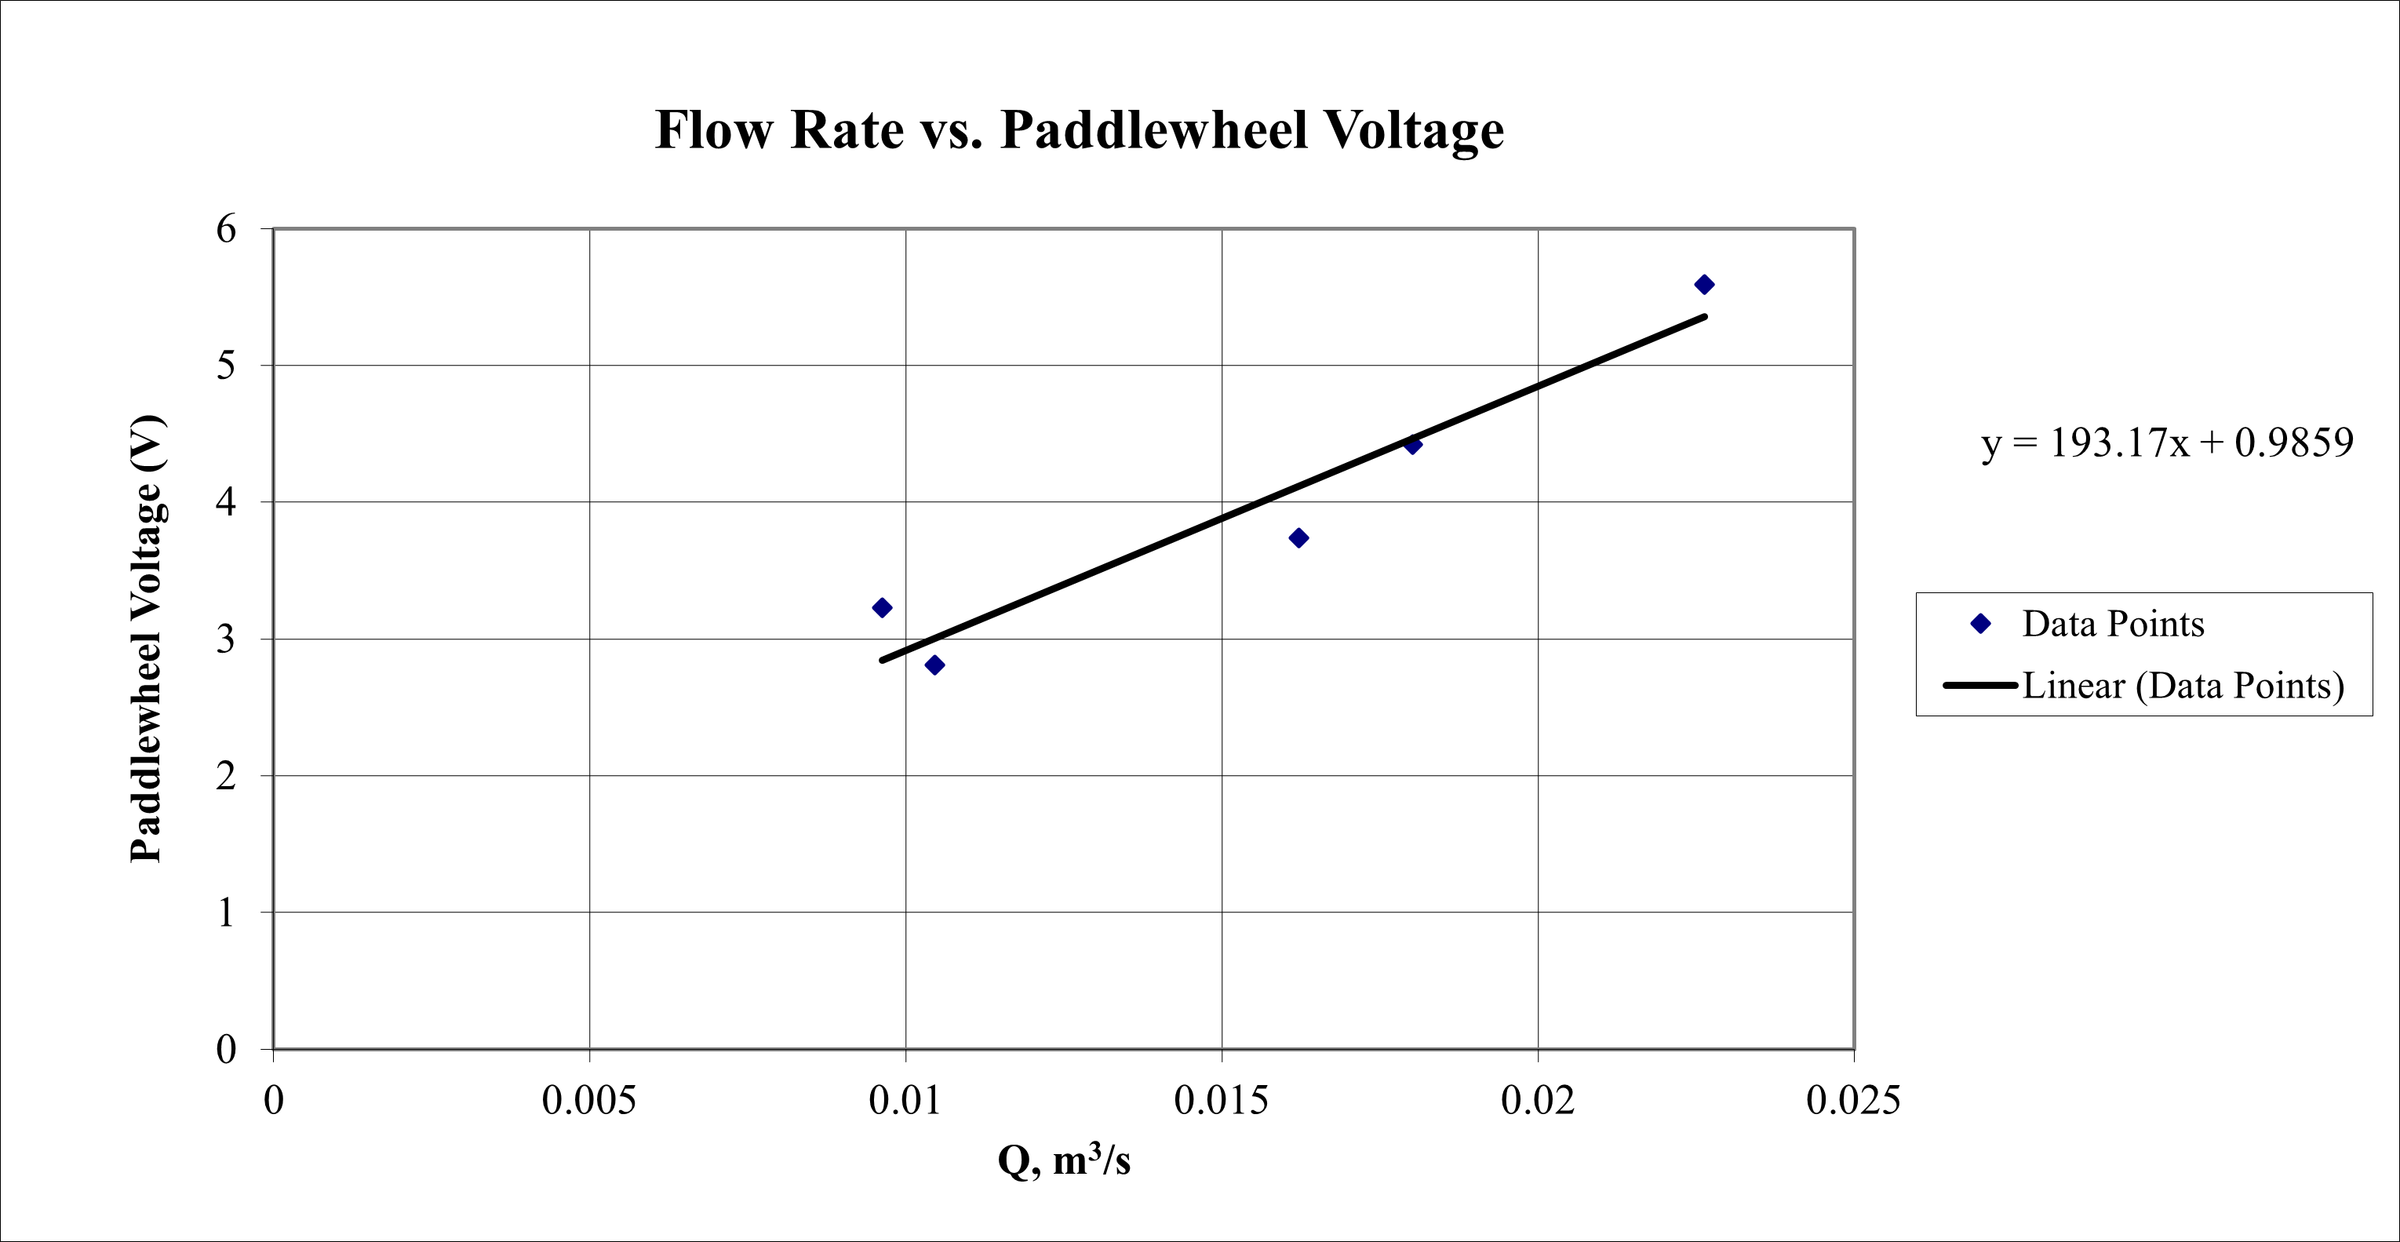
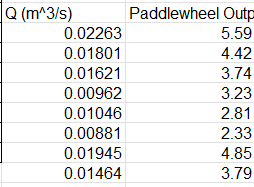
Now, moving onto the paddlewheel flowmeter data, plot the voltage output against the actual discharge rate Q (in m³/s) calculated using weight–time measurements. A smooth line passed through this data will be the calibration curve for the paddlewheel flowmeter. If there are any rising and falling flow cutoff rates below which the paddlewheel seems to not be in motion, indicate them. Then, calculate corresponding cutoff fluid velocities, as well as the maximum fluid velocity achieved in the experiment.
For the above data, there are no rising and falling flow cutoff rates below which the paddlewheel seems to not be in motion. Thus, we cannot determine the corresponding cutoff fluid velocities. The maximum fluid velocity achieved in the experiment is calculated with V=Q/A, where A is the area of the pipe and is (π*d2)/4. d=4 in. = 0.1016 m, and the maximum Q is 0.02263, so Vfluid, max = 0.02263*4/π*(0.1016)2 = 2.791304763 m/s.
Analyze Discharge Coefficient

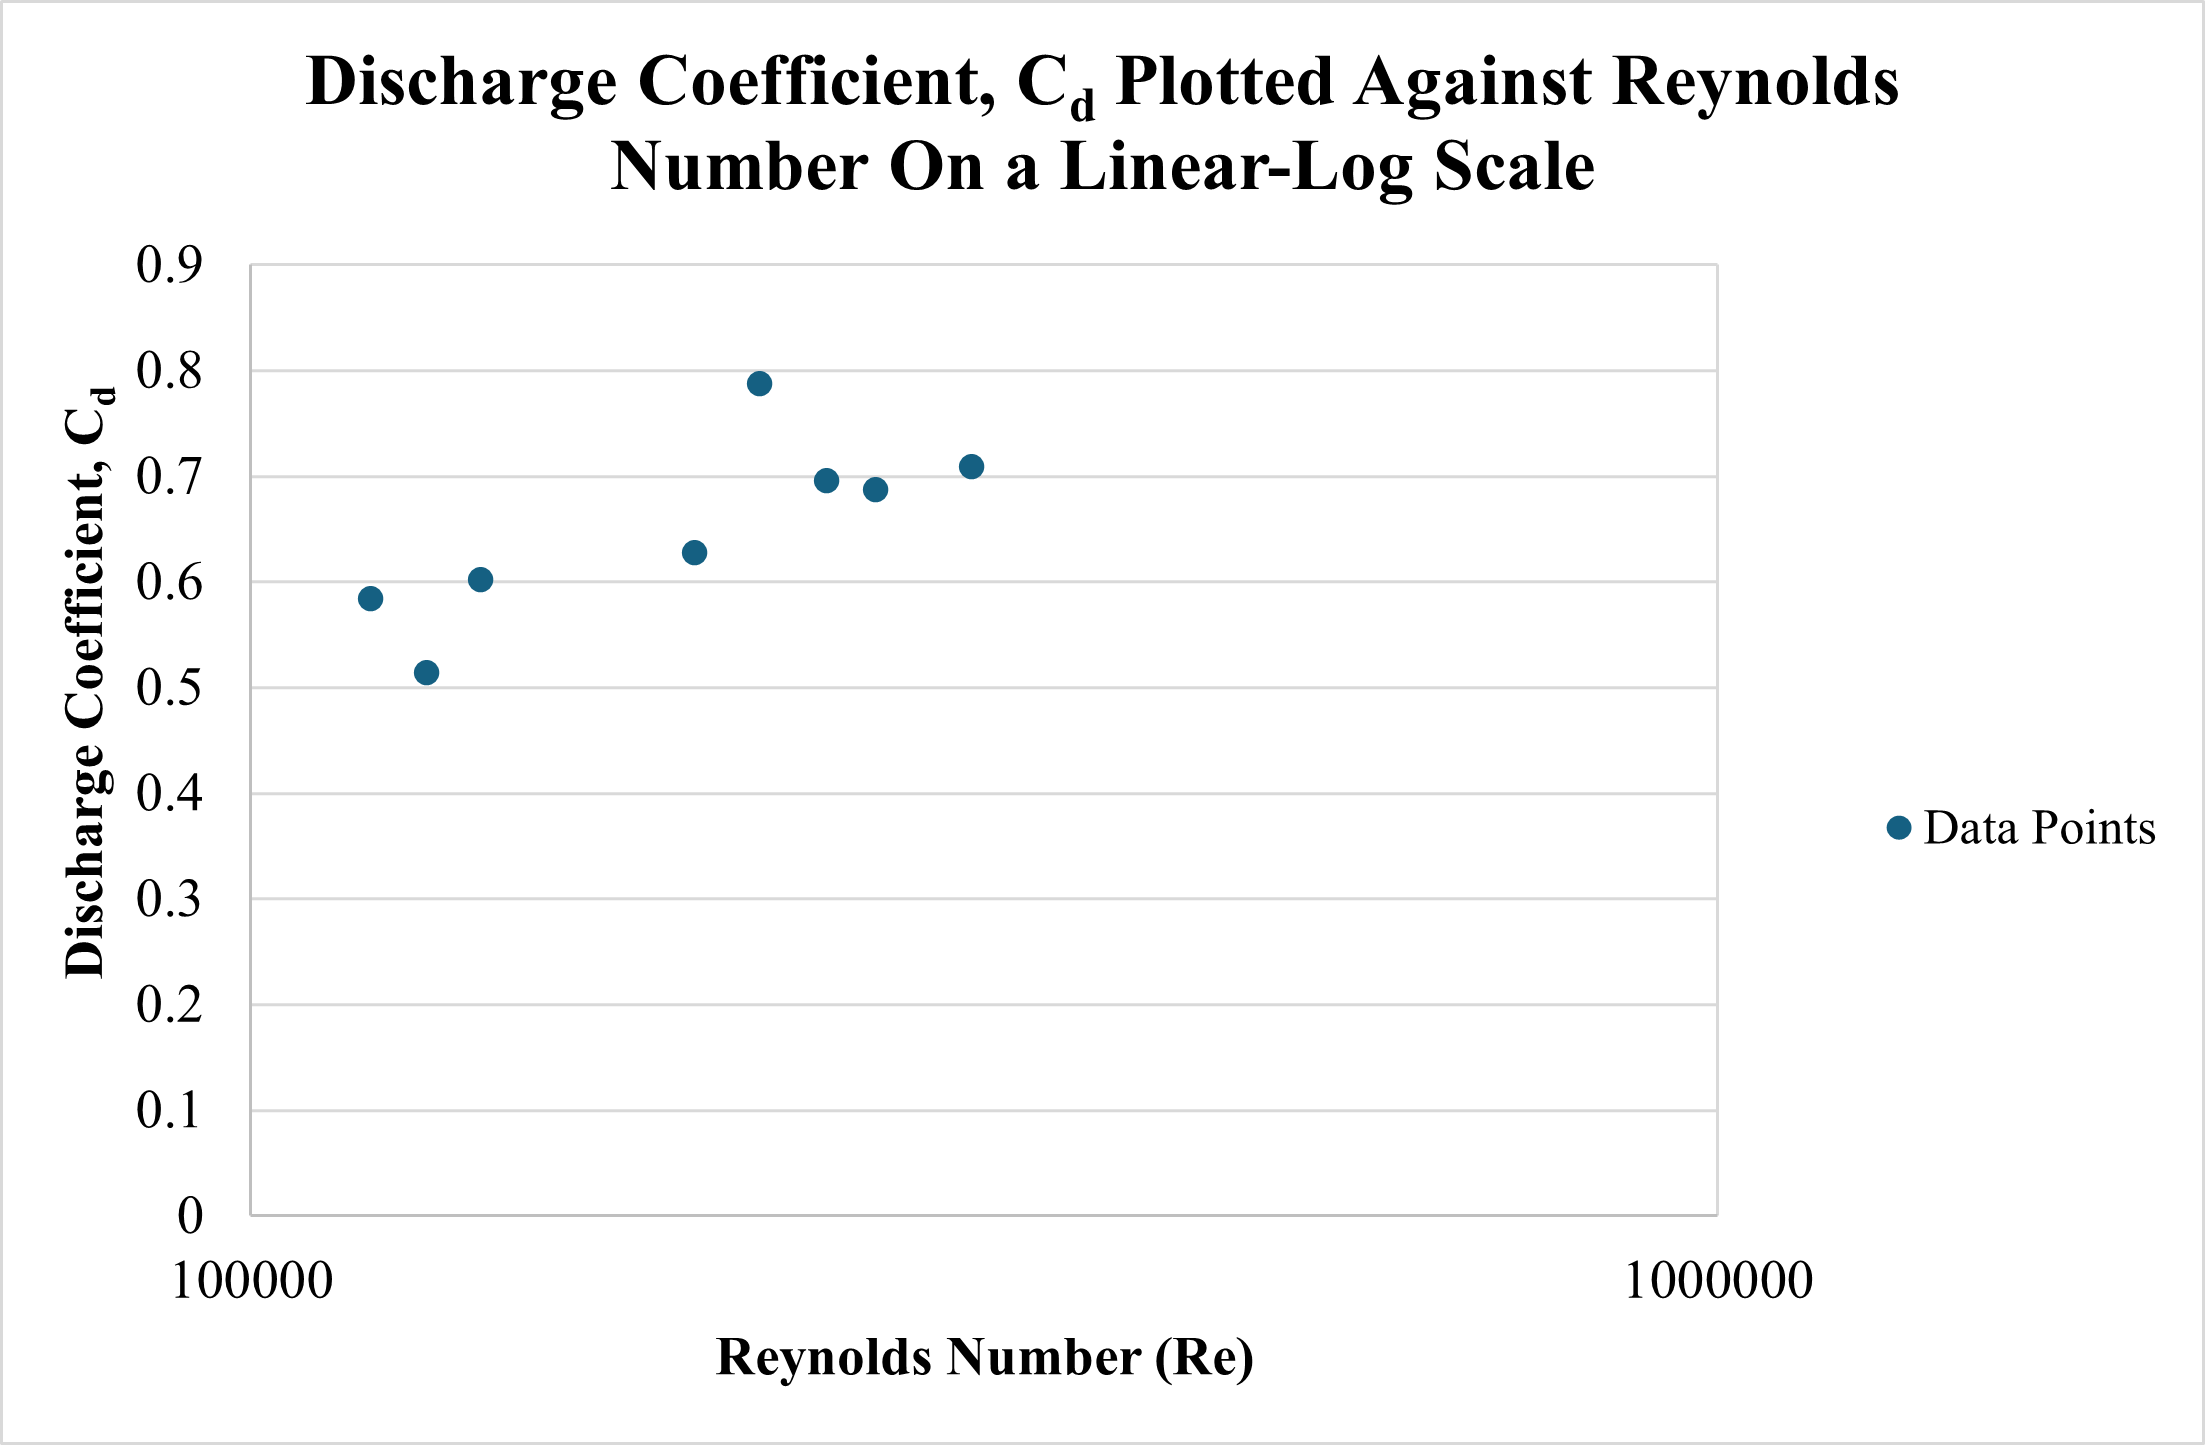
Determine whether the discharge coefficient is basically constant over the range of Reynolds numbers tested. Next, determine whether the experimentally measured values for the discharge coefficient are close to the ideal value of unity derived theoretically as given above. If there are any corrections that need to be made to the theory to obtain more realistic values for the discharge coefficient, indicate them.
For the attached data, the discharge coefficient is not basically constant over the range of Reynolds numbers tested and is not close to the ideal value of unity derived theoretically. In order to obtain more realistic values for the discharge coefficient theoretically, there needs to be some sort of logarithmic relationship made between Reynolds numbers and the coefficient of discharge.
Determine Reliability of Paddlewheel Flowmeter
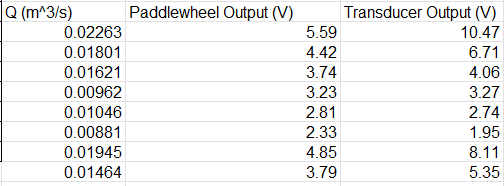
Determine if the paddlewheel flowmeter is reliable or not, and if the readings are more accurate at higher or lower flowrates.
To determine if the paddlewheel flowmeter is reliable for this data, we will compare the paddlewheel flowmeter data with the transducer data. As the chart above shows, the paddlewheel flowmeter is not reliable. The readings seem to be more accurate at lower flowrates.