Using Machine Learning to Optimize the Best Urban Wind Turbine
by avidgamer in Workshop > Energy
1188 Views, 7 Favorites, 0 Comments
Using Machine Learning to Optimize the Best Urban Wind Turbine
Disclaimer I: This tutorial can only be followed on a Linux or Windows. As of 7/24/2026, Qblade does not offer a Mac version.
Disclaimer II: This is a semi-advanced level tutorial. I will provide as much explanation as possible, but some configurations will need to be done.
Have you ever wanted to build a wind turbine, but you weren't sure how it would perform? With this guide, you can use the power of machine learning model that looks through tens of thousands of datapoints to ensure that you build the best wind turbine for your home!
Designing an efficient urban Vertical Axis Wind Turbine (VAWT) is incredibly difficult. Finding the perfect combination of blade Twist, Solidity, and Tip Speed Ratio (λ) usually requires thousands of hours of brute-force computational fluid dynamics (CFD) simulation.
In this Instructable, we will build an AI-driven Surrogate-Based Optimization engine. We will use simulation data to train an AI "brain" (a Gaussian Process Regressor) that learns the physics of the turbine. Then, we will use an evolutionary algorithm to mathematically hunt down the absolute optimal aerodynamic design.
Supplies
- Qblade community edition
- Python
- Scikit-Learn
- Fusion360
- CAD model of your house (even simplistic will do)
Getting Qblade
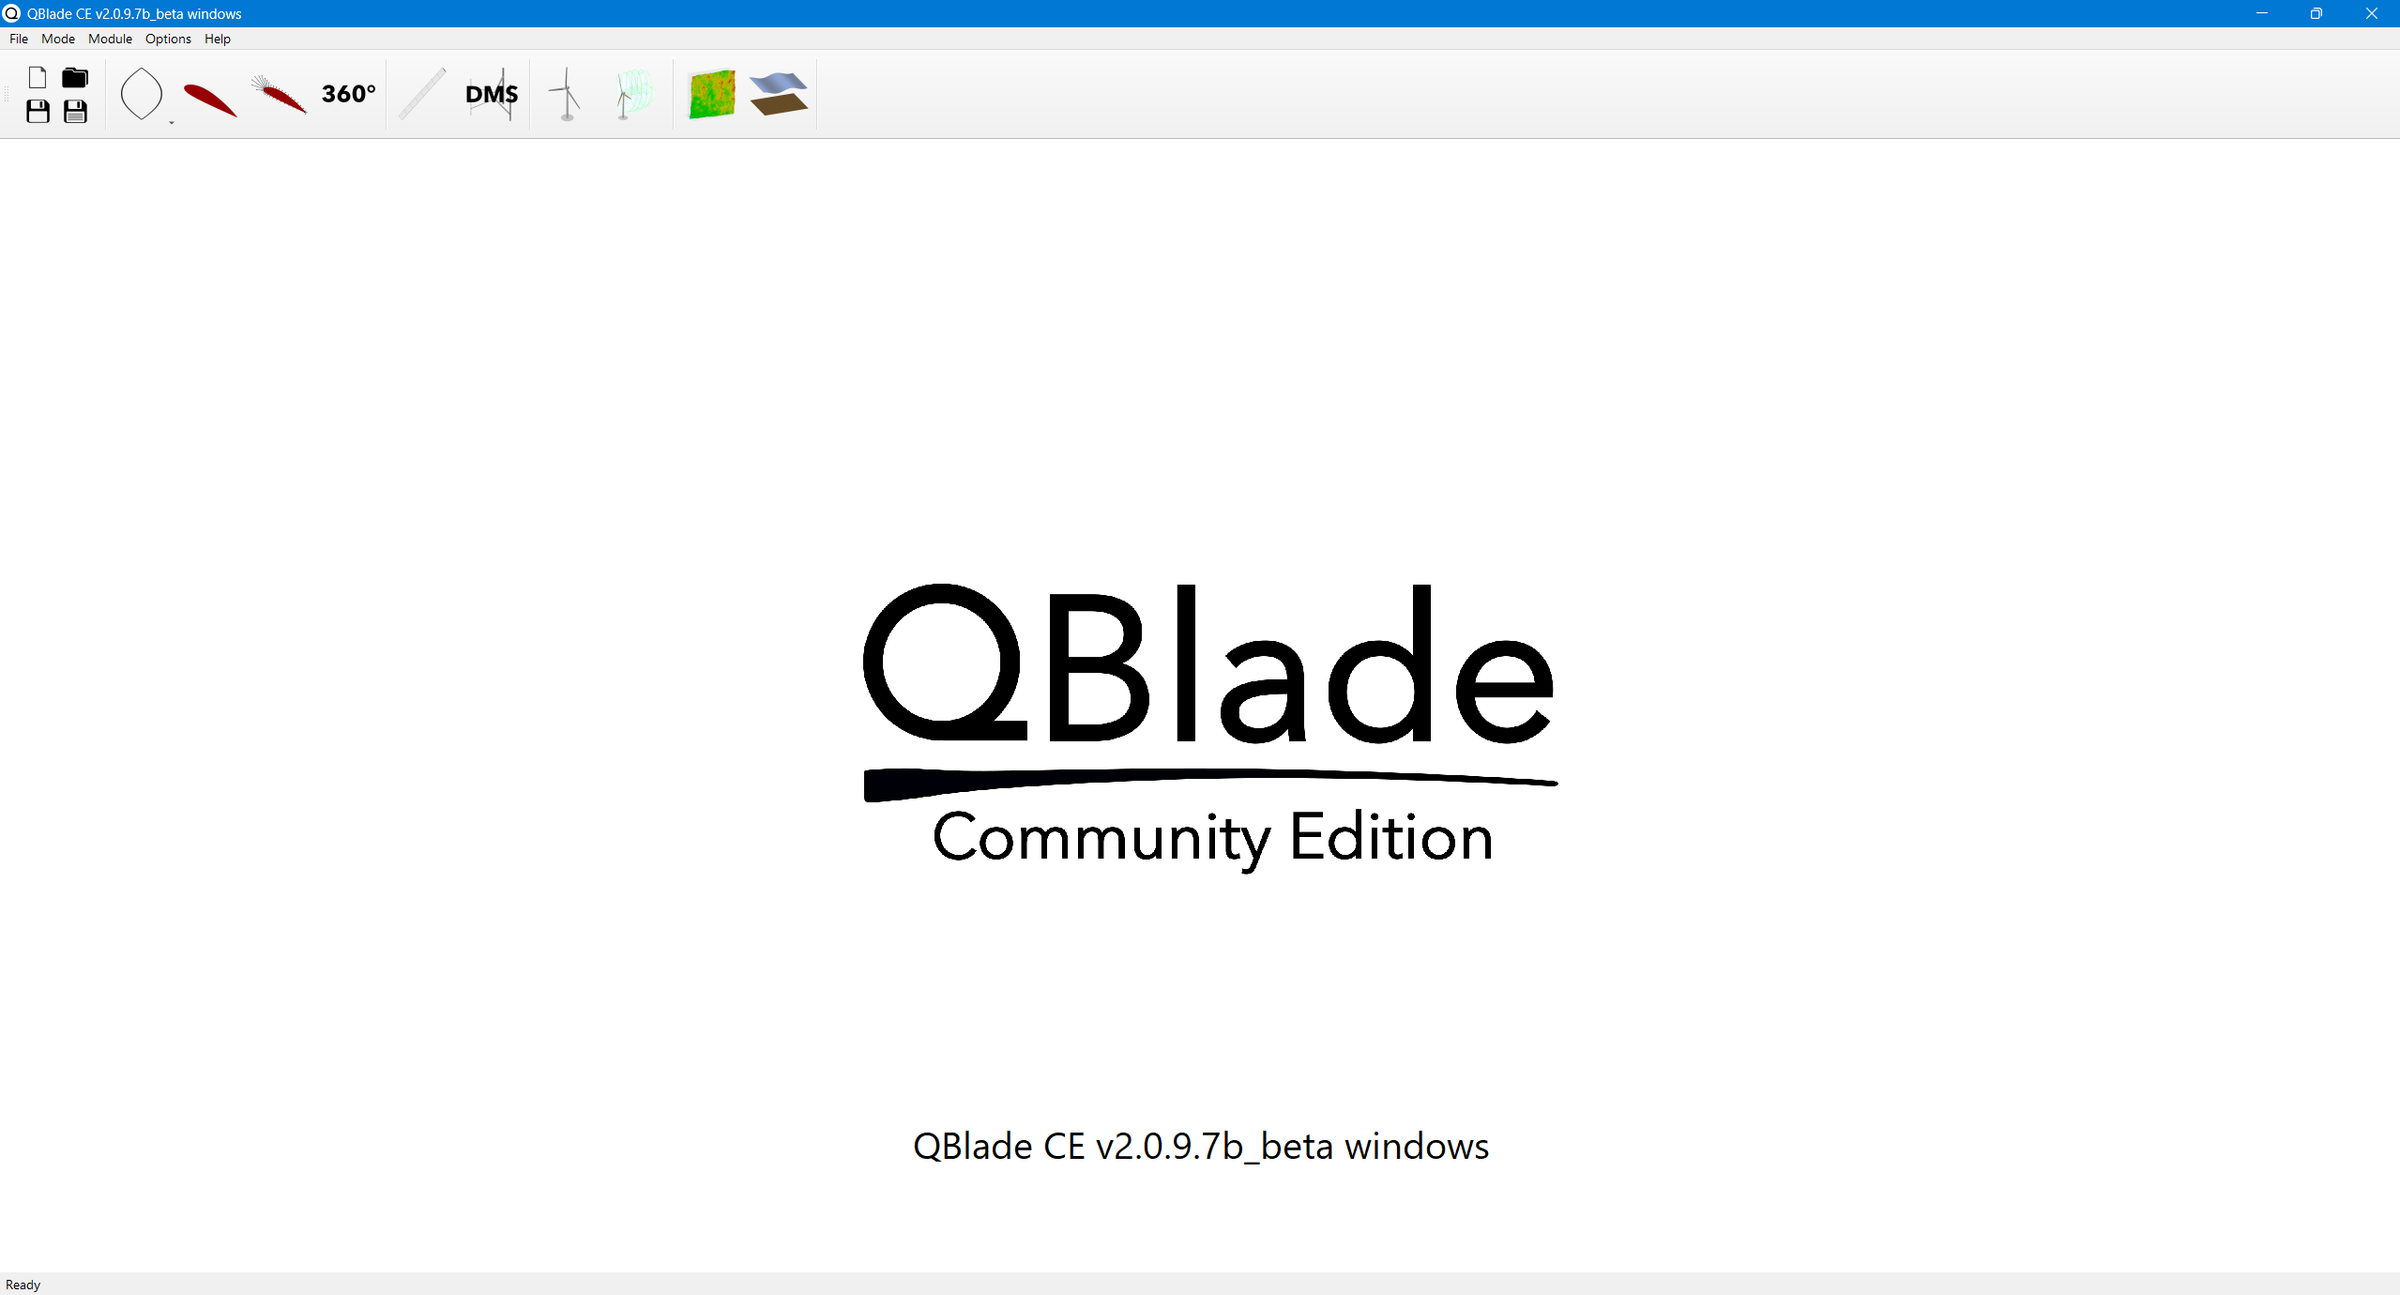
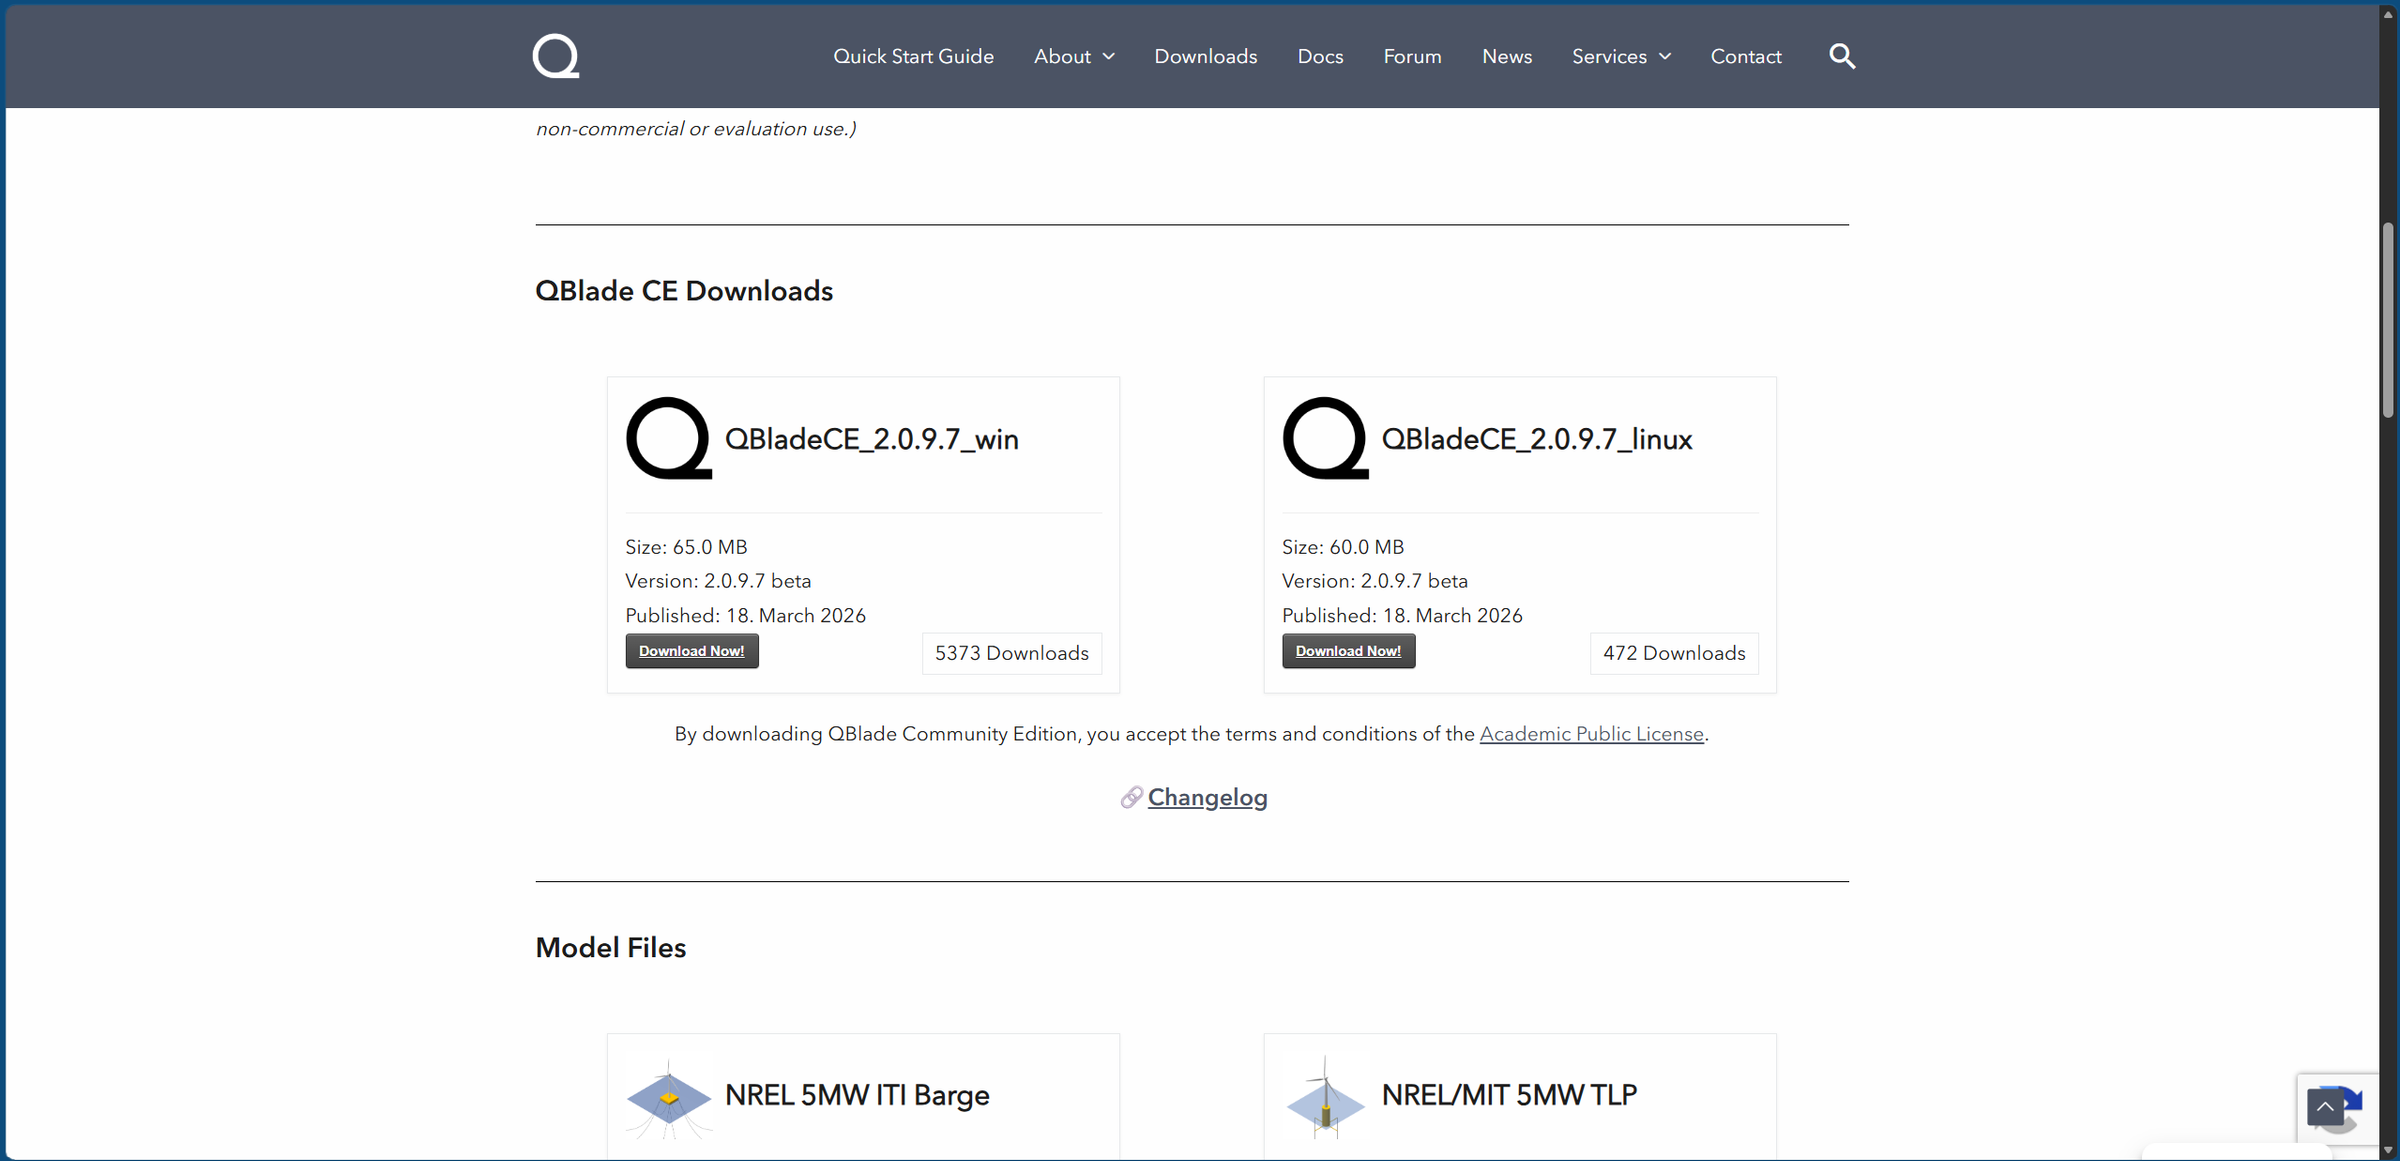
To start you will need to download Qblade community edition. Qblade is an industry level software that in their own words is a "wind turbine simulation code, covering all aspects of wind turbine design, analysis, and certification."
Downloading Python
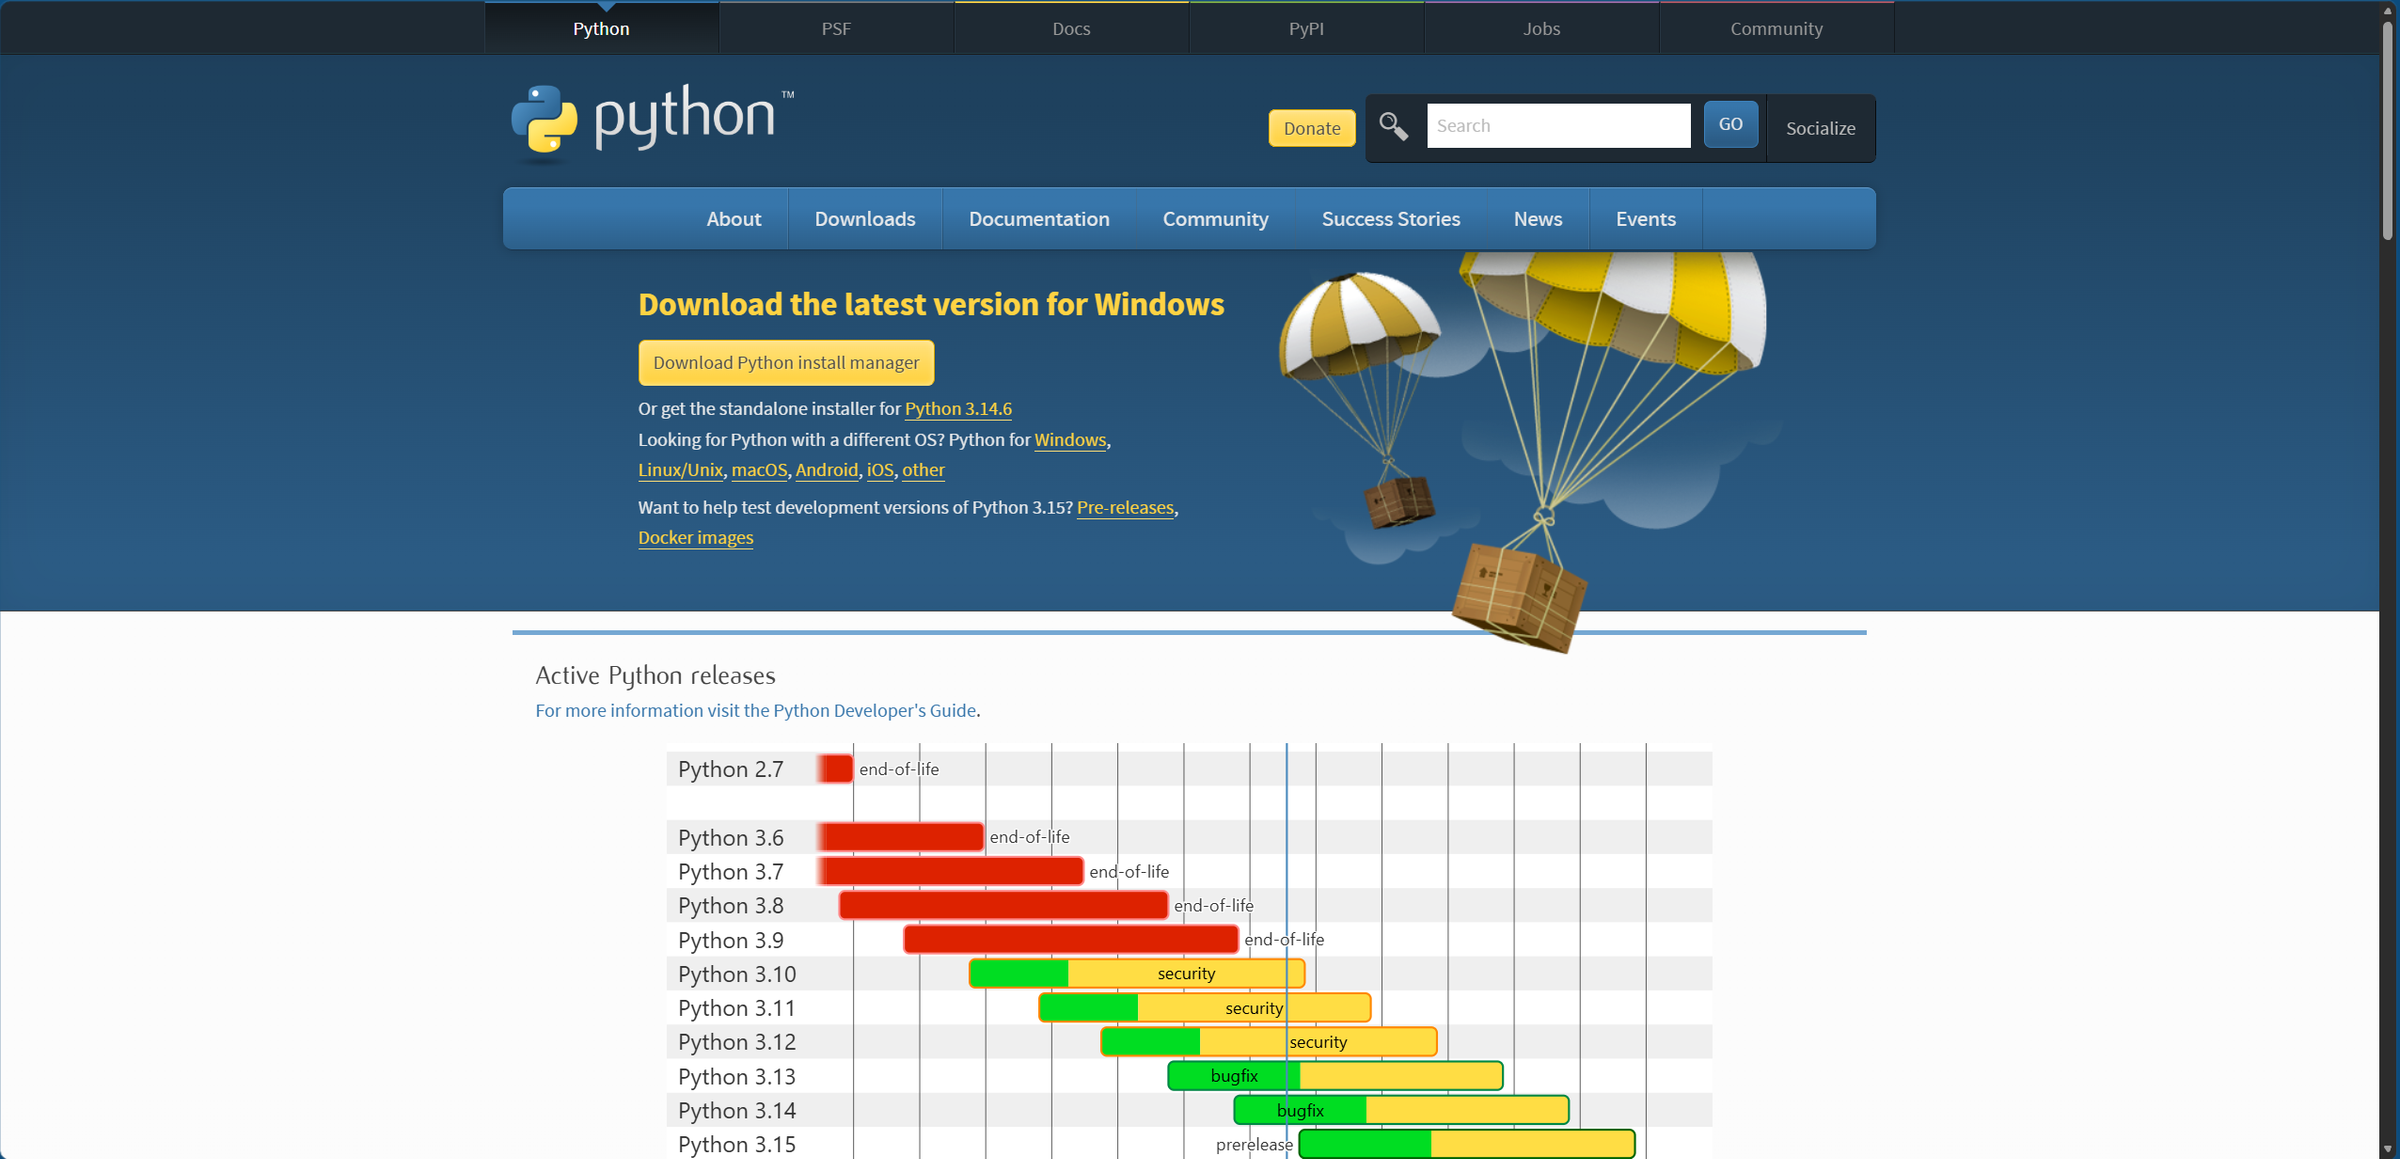
You will then need to download the latest version of python.
Getting Scikit-Learn
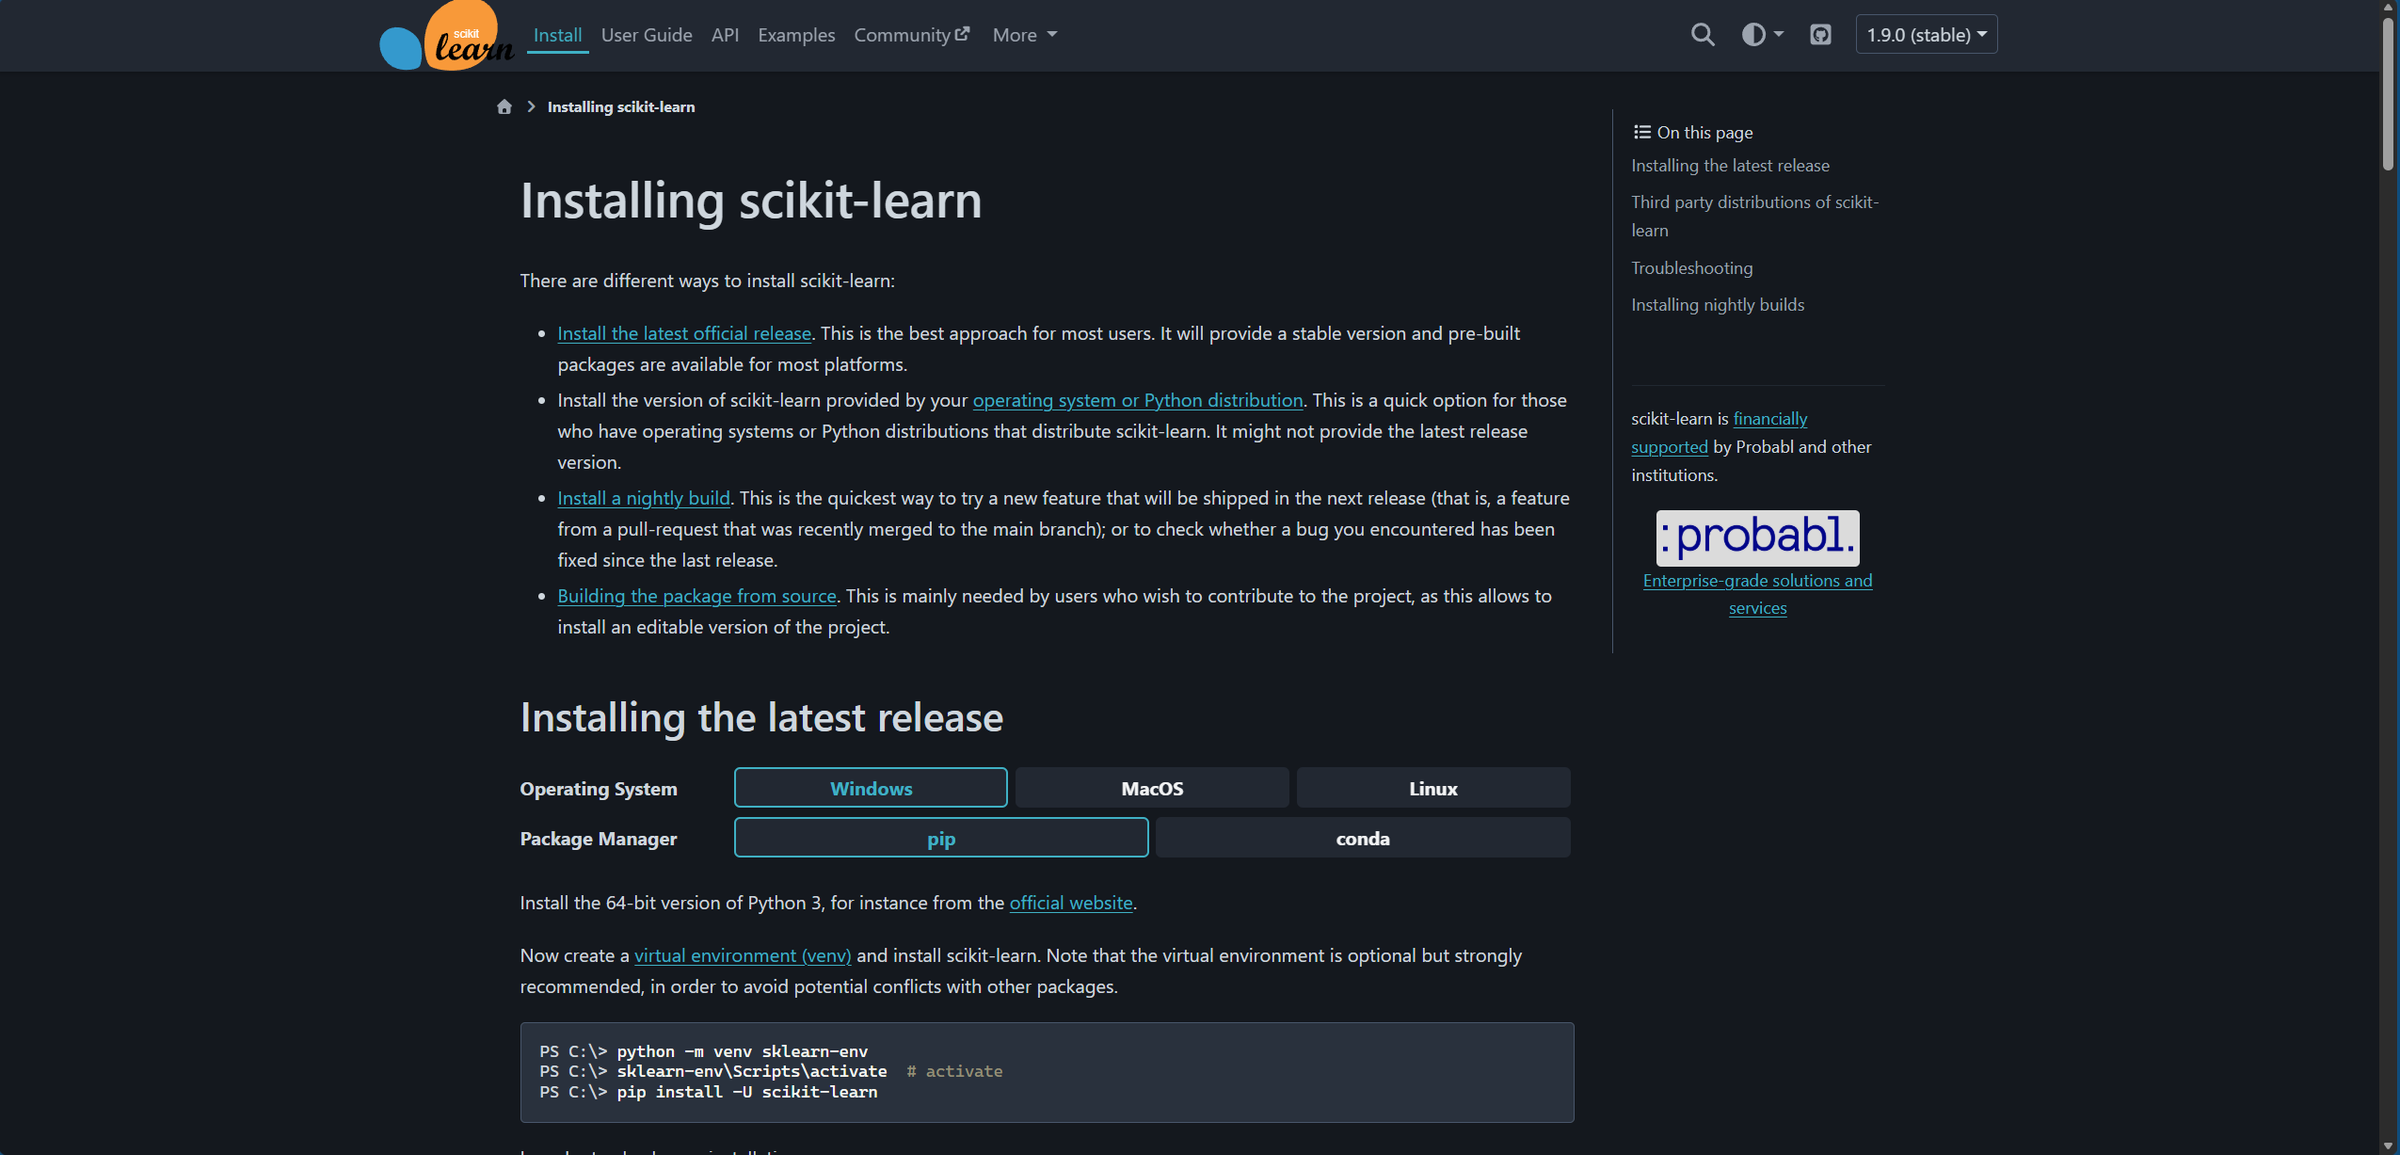
Once you have Python, you will need to get Sckit-Learn, the machine learning library we will be using. Simply open up the command prompt. I would heavily recommend creating a virtual environment (venv).
What Is a GPR Model?
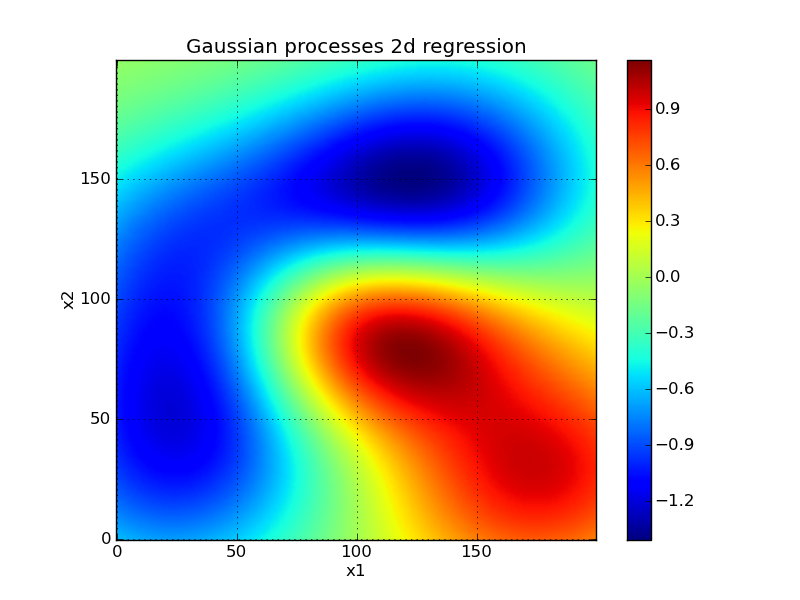
I will now explain the ML concepts we will be employing, if you already know ML, feel free to skip this part.
Imagine you have a scatter plot of data points, and you want to draw a line through them to predict future values.
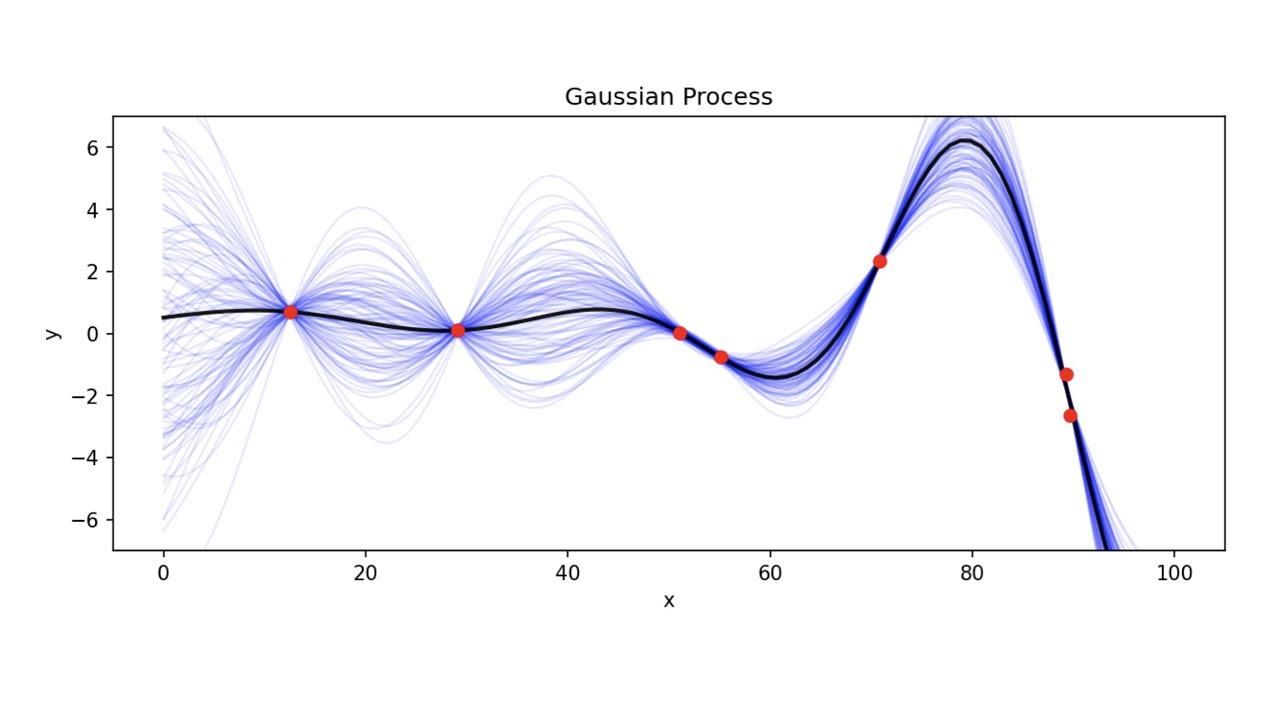
In standard regression (like linear regression), you are forcing a single, rigid shape (like a straight stick) through the data. Gaussian Process Regression (GPR) takes a completely different approach: instead of guessing one rigid line, it considers an infinite number of curvy, flexible lines that could possibly fit your data.
Because GPR considers all possible lines that could fit the data, it doesn't just give you a single prediction. It gives you two things:
- The Mean (The Best Guess): The average of all those infinite possible lines. This is your actual prediction.
- The Variance (The Uncertainty): A shaded area around the best guess that shows how confident the model is.
What Is an Evolutionary Model?
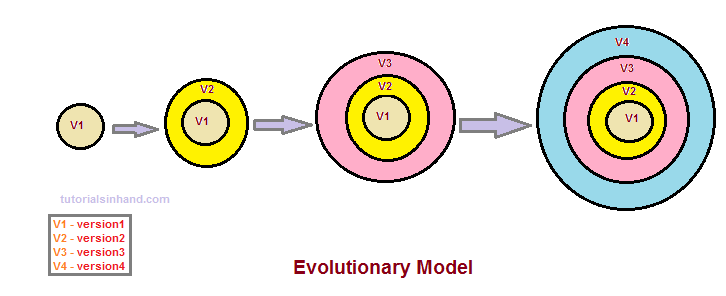
I will now explain the ML concepts we will be employing, if you already know ML, feel free to skip this part.
If standard machine learning is like a student studying a textbook to find a mathematical pattern, an Evolutionary Model (or Evolutionary Algorithm) is like breeding the ultimate racehorse using "survival of the fittest."
Instead of using complex calculus to calculate the perfect answer, it borrows the rules of biological evolution—mutation, reproduction, and natural selection—to "evolve" the best solution over time.
It solves problems by repeating a simple, four-step cycle:
- The Population: The model generates hundreds of random, mostly terrible solutions to a problem.
- The Fitness Test: It tests every solution and gives each one a score based on how well it performed.
- Selection: The worst performers are "killed off," while the top scorers are chosen to be parents.
- Reproduction & Mutation: The model combines traits from the winning parents (crossover) and throws in tiny random changes (mutation) to create a new generation of solutions.
You repeat this for hundreds or thousands of generations. The bad traits die out, the good traits compound, and eventually, the population evolves into a highly optimized solution.
Airfoil
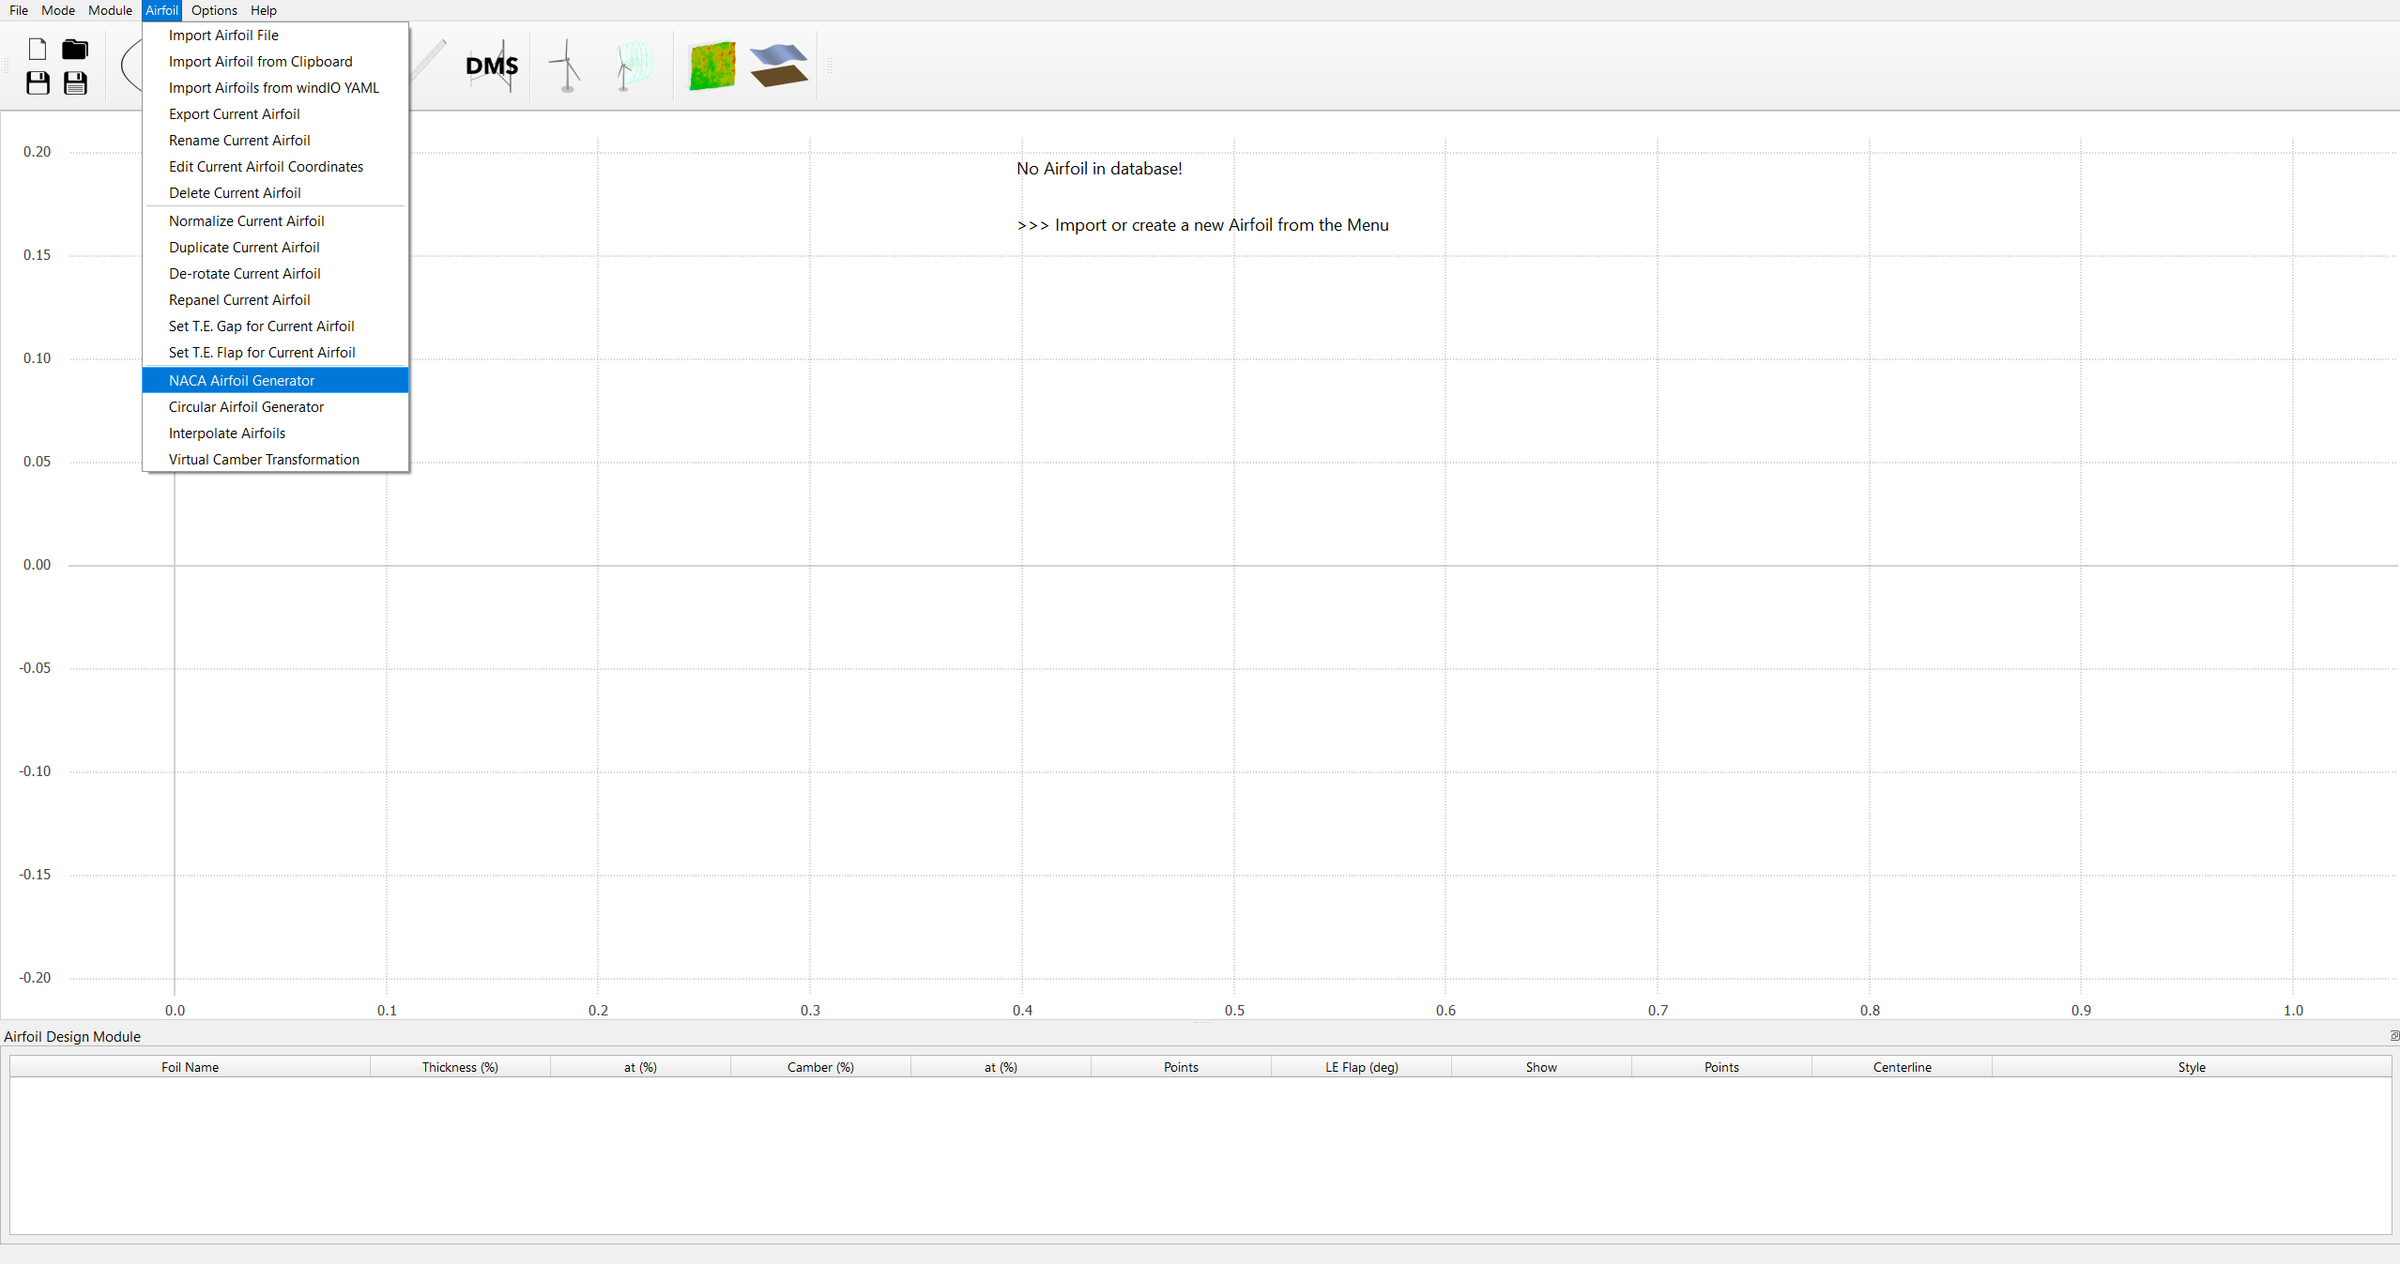
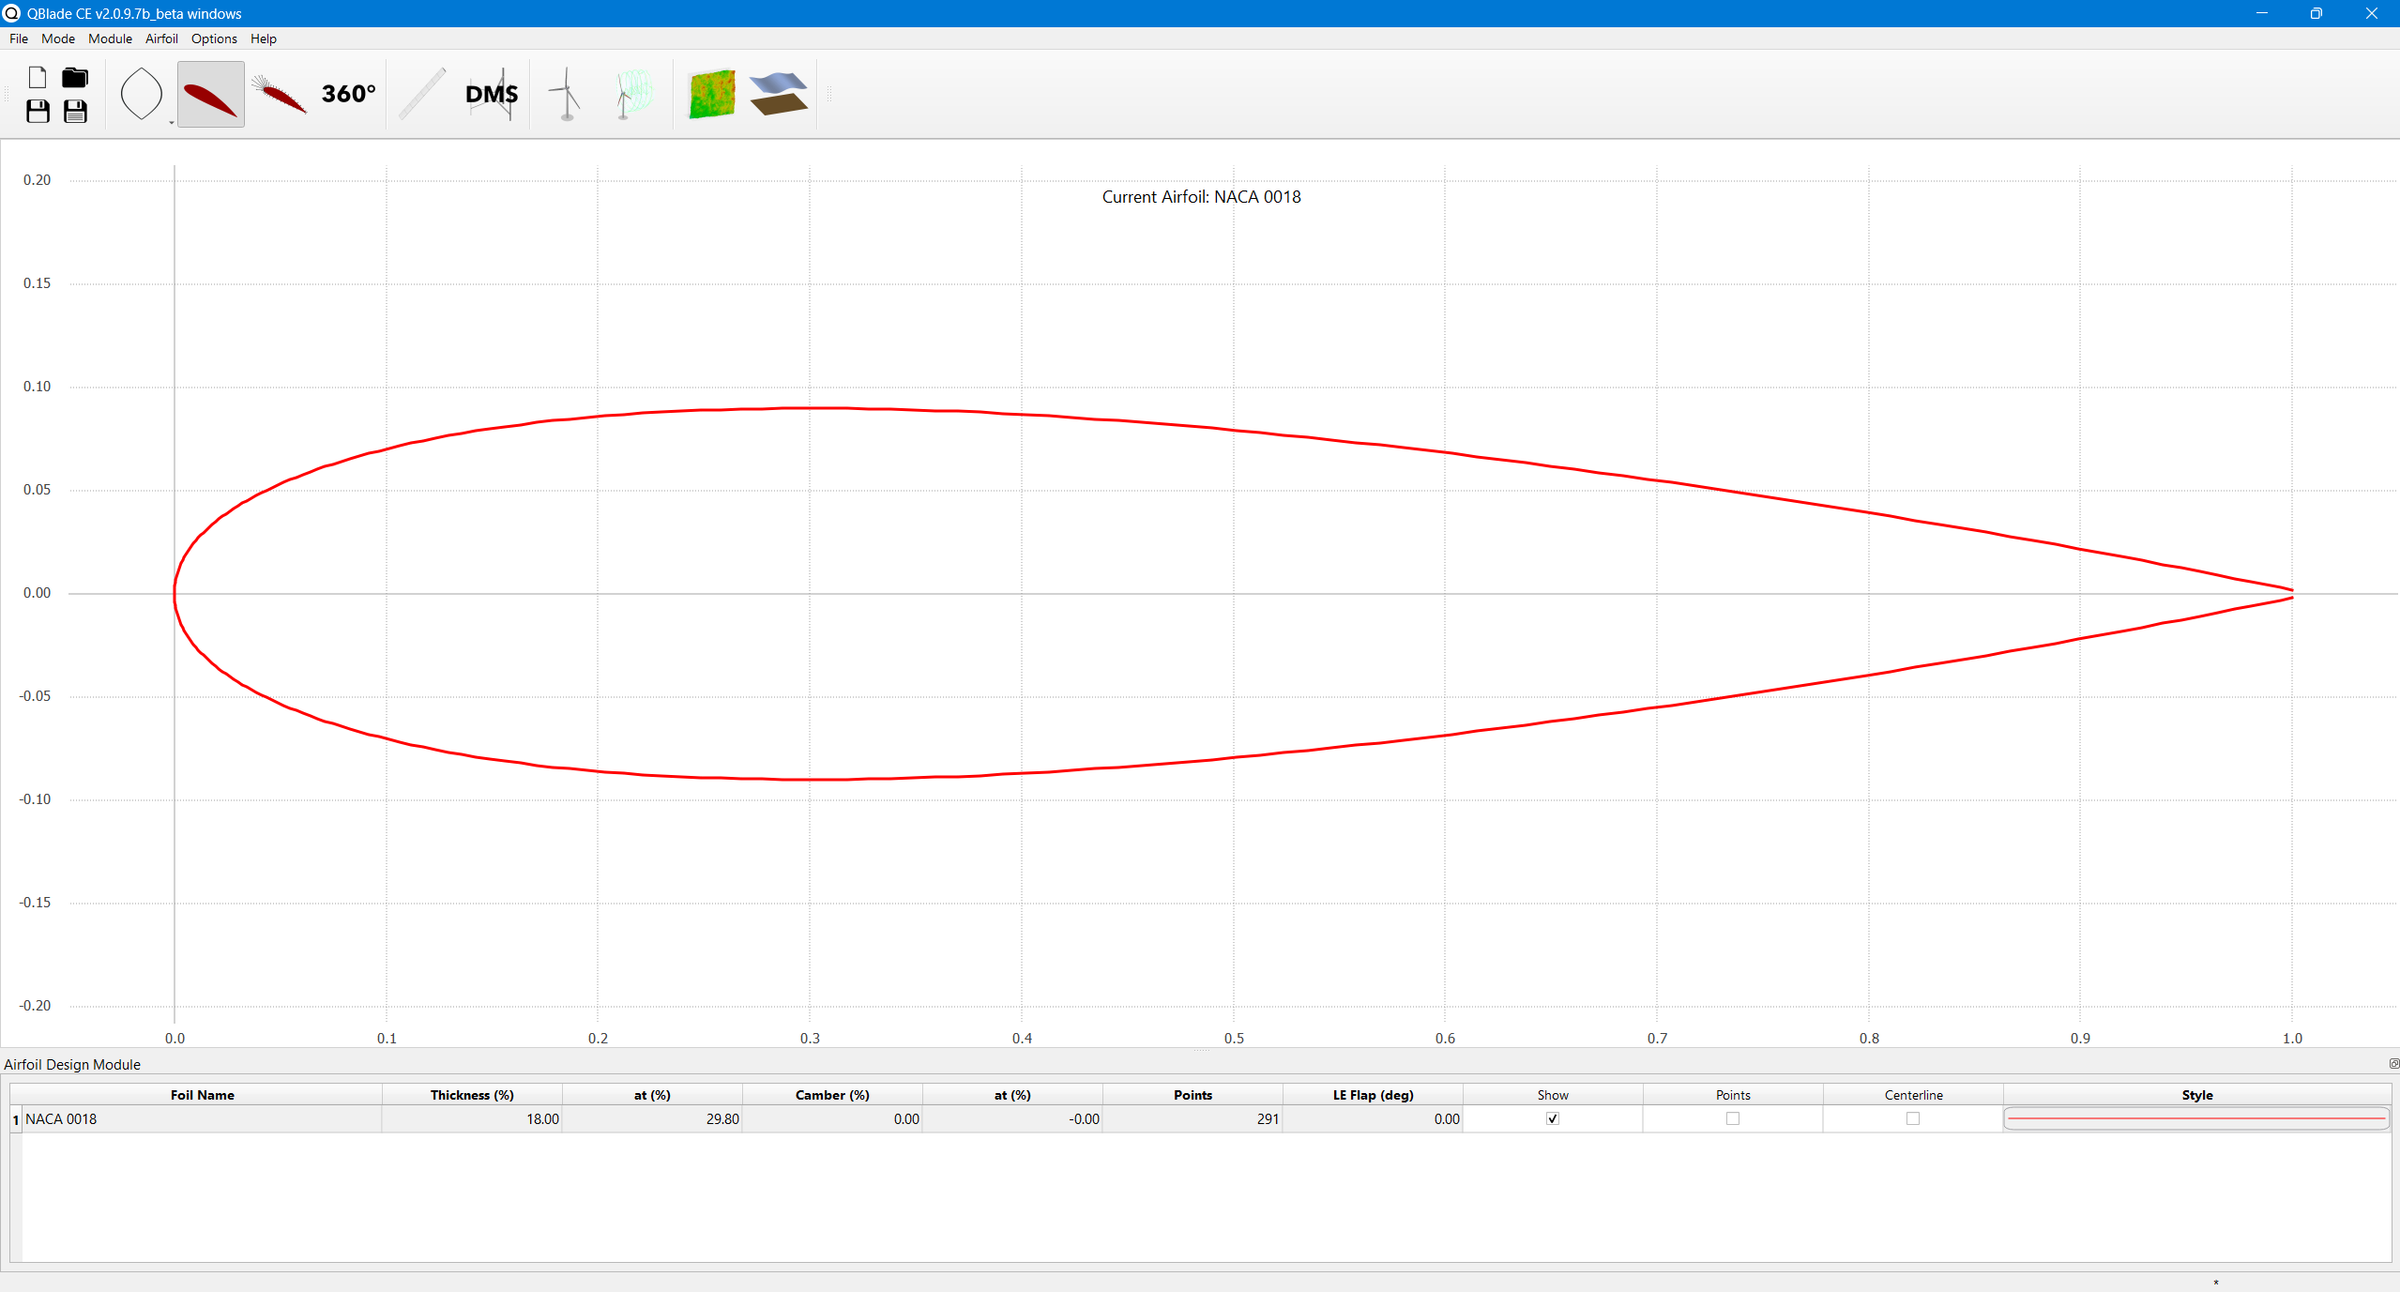
We want to select the NACA 4-digit series 0018 airfoil and the NACA 0015. These are generally the best airfoils for urban VAWTs.
Quick history lesson: The NACA 4-digit airfoil series was developed in the 1930s by the National Advisory Committee for Aeronautics (NACA), the predecessor of NASA, to provide a systematic way to describe airfoil shapes for aircraft wings. Each airfoil in this series is defined by four digits, which encode the airfoil's key geometric properties: camber, position of maximum camber, and thickness.
Airfoil Analysis
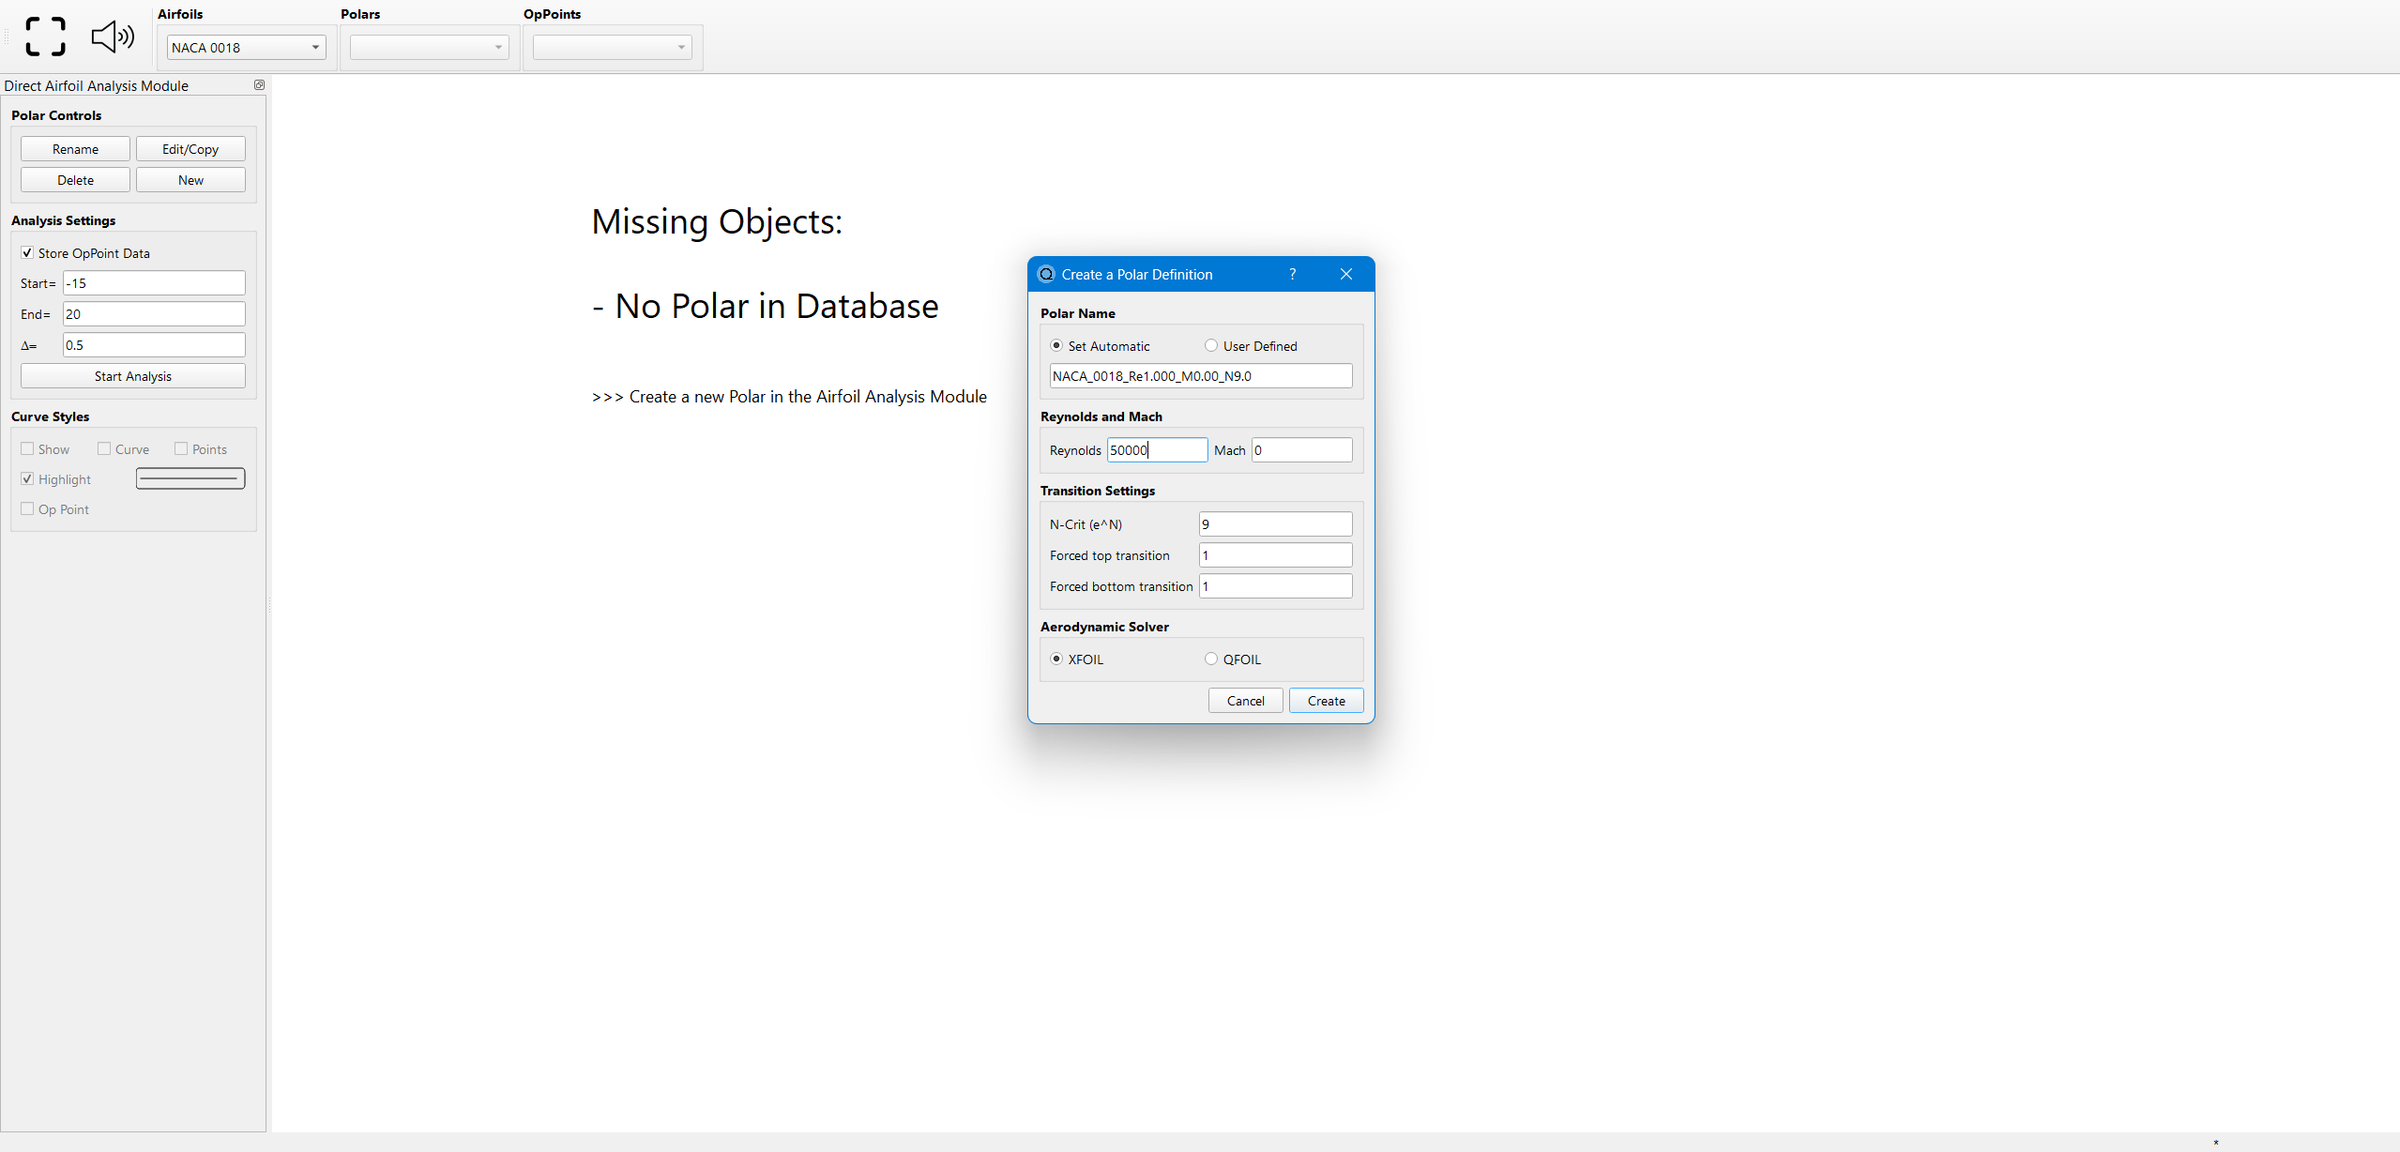
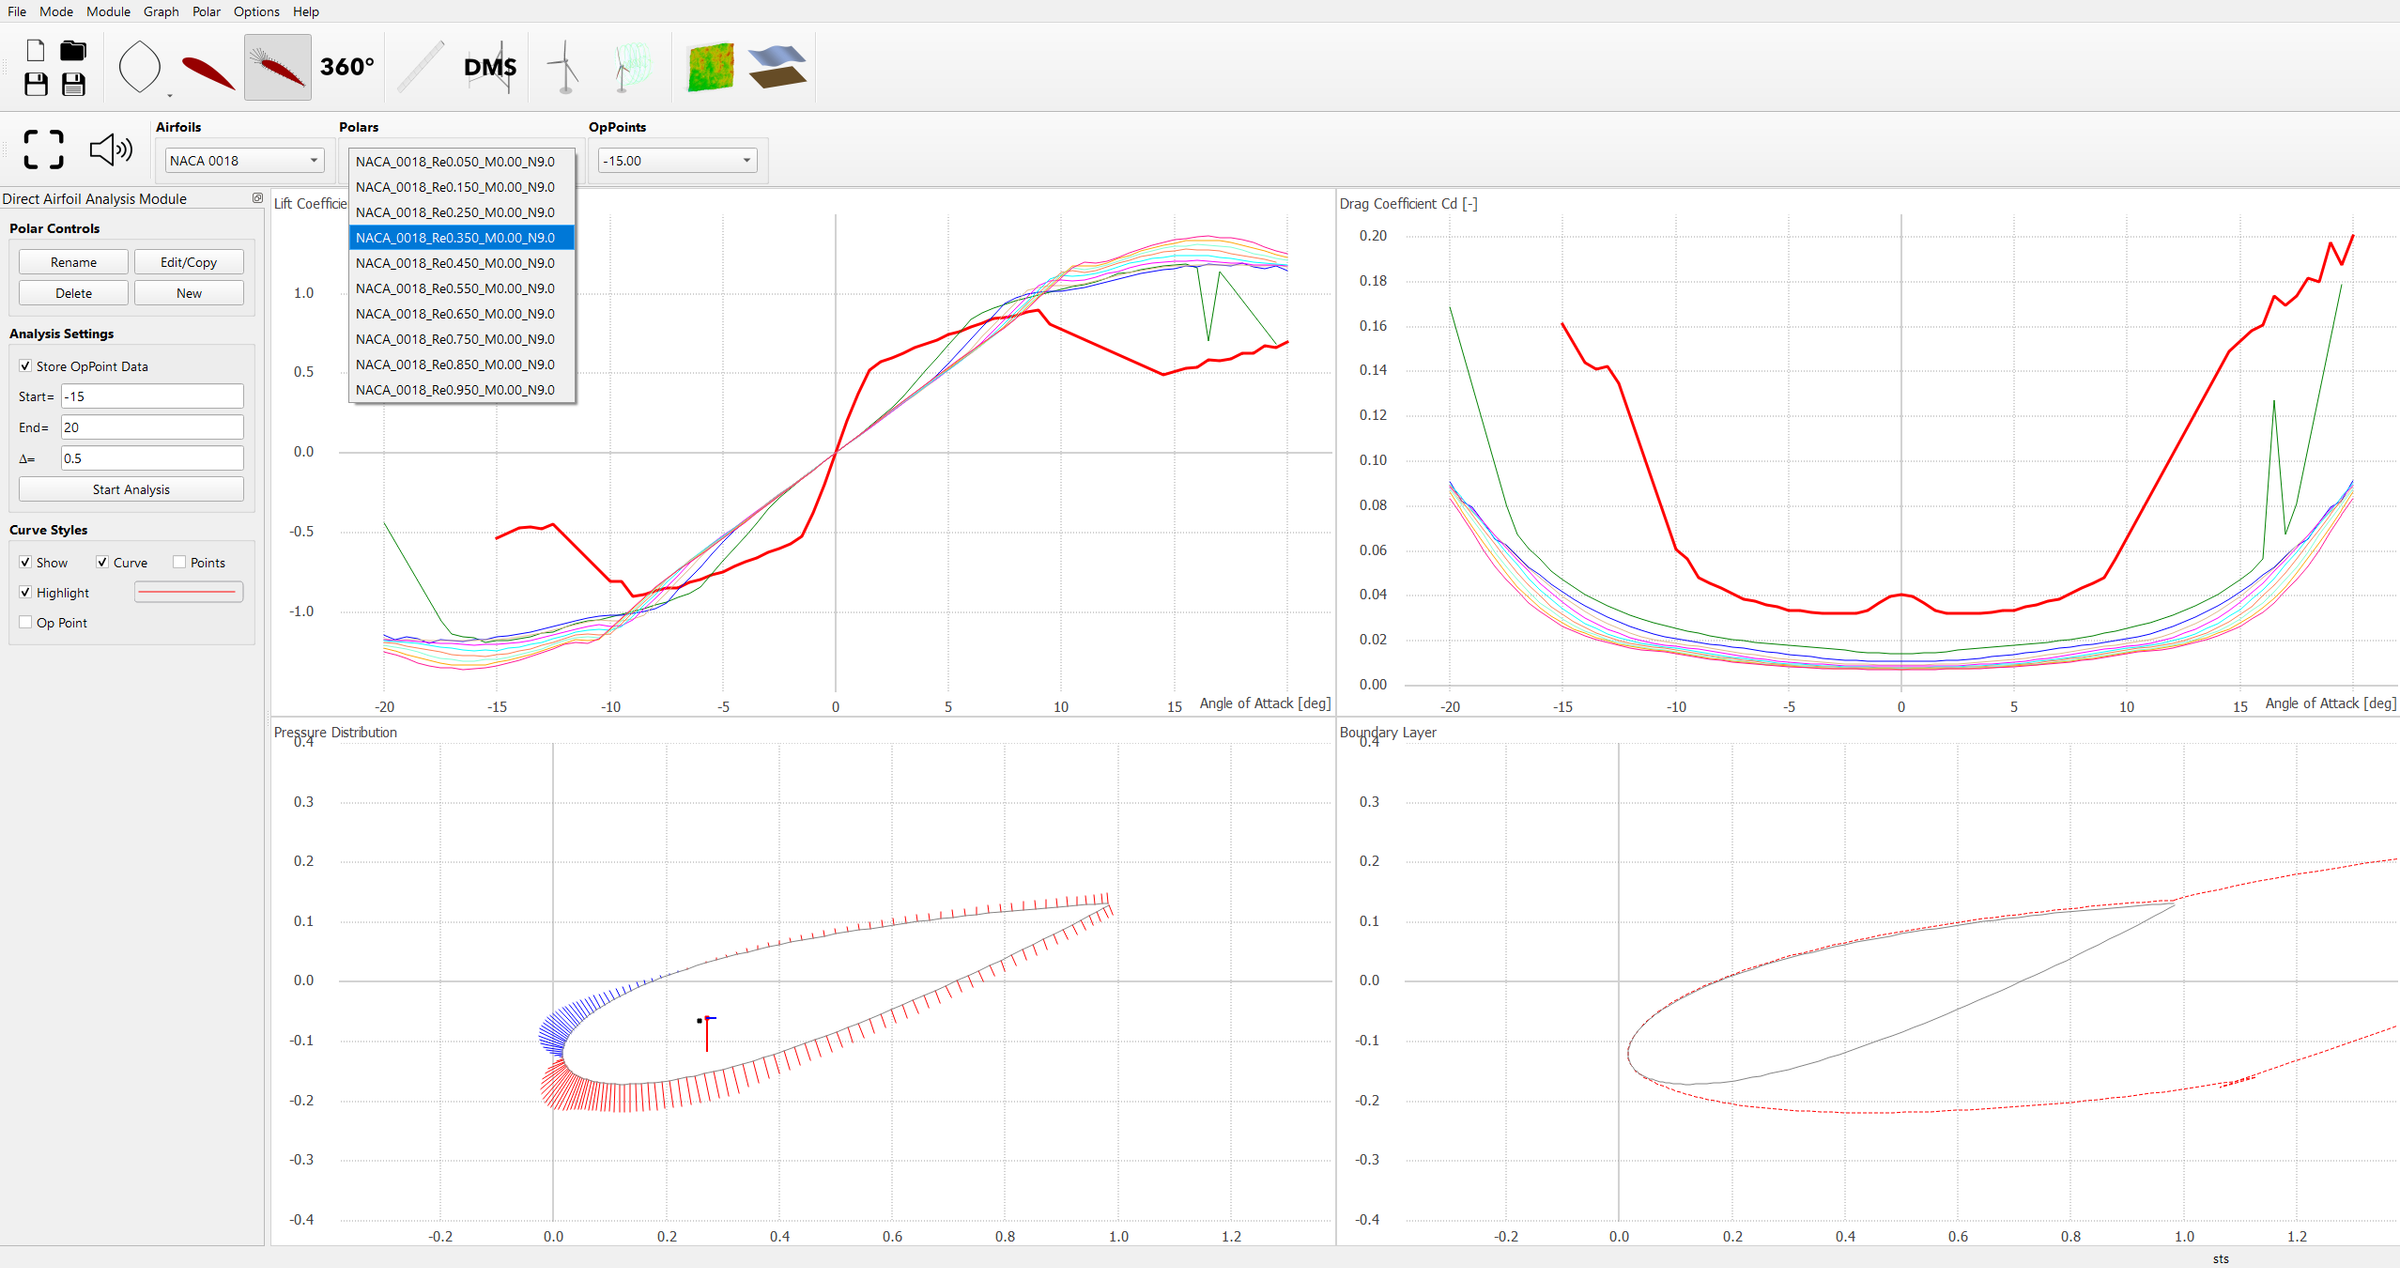
We then want to run Airfoil Analysis for each Reynolds number from 50,000 to 1,000,000 in increments of 100,000 for each of the two airfoils.
Polar Extrapolation
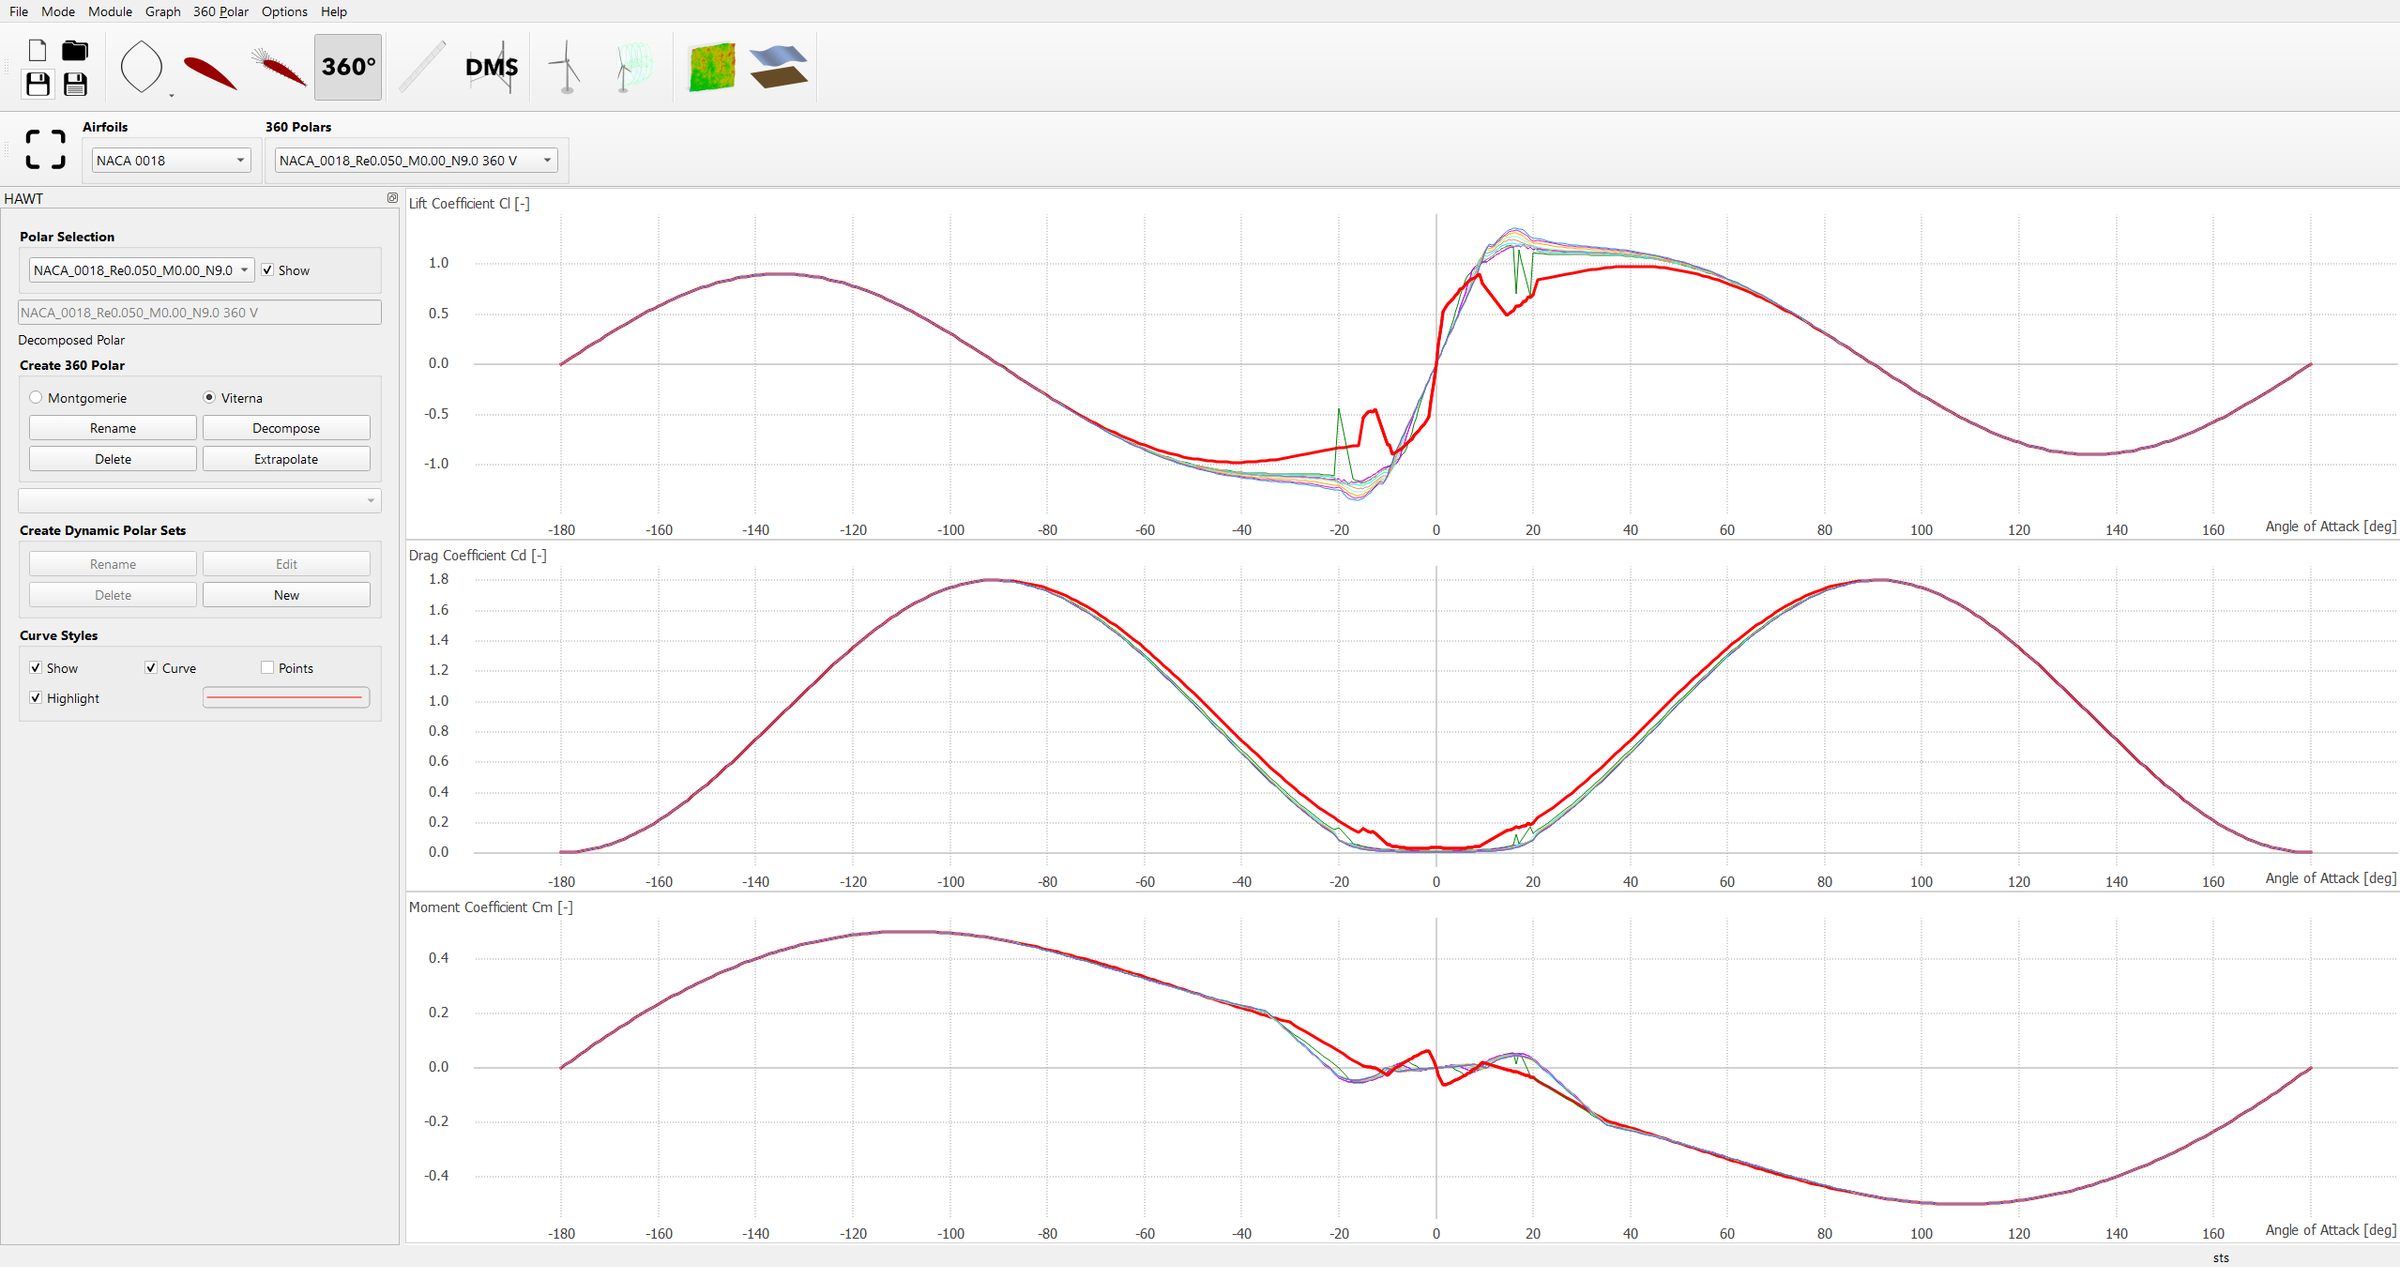
We then want to extrapolate these polars for both airfoils.
Blade Design
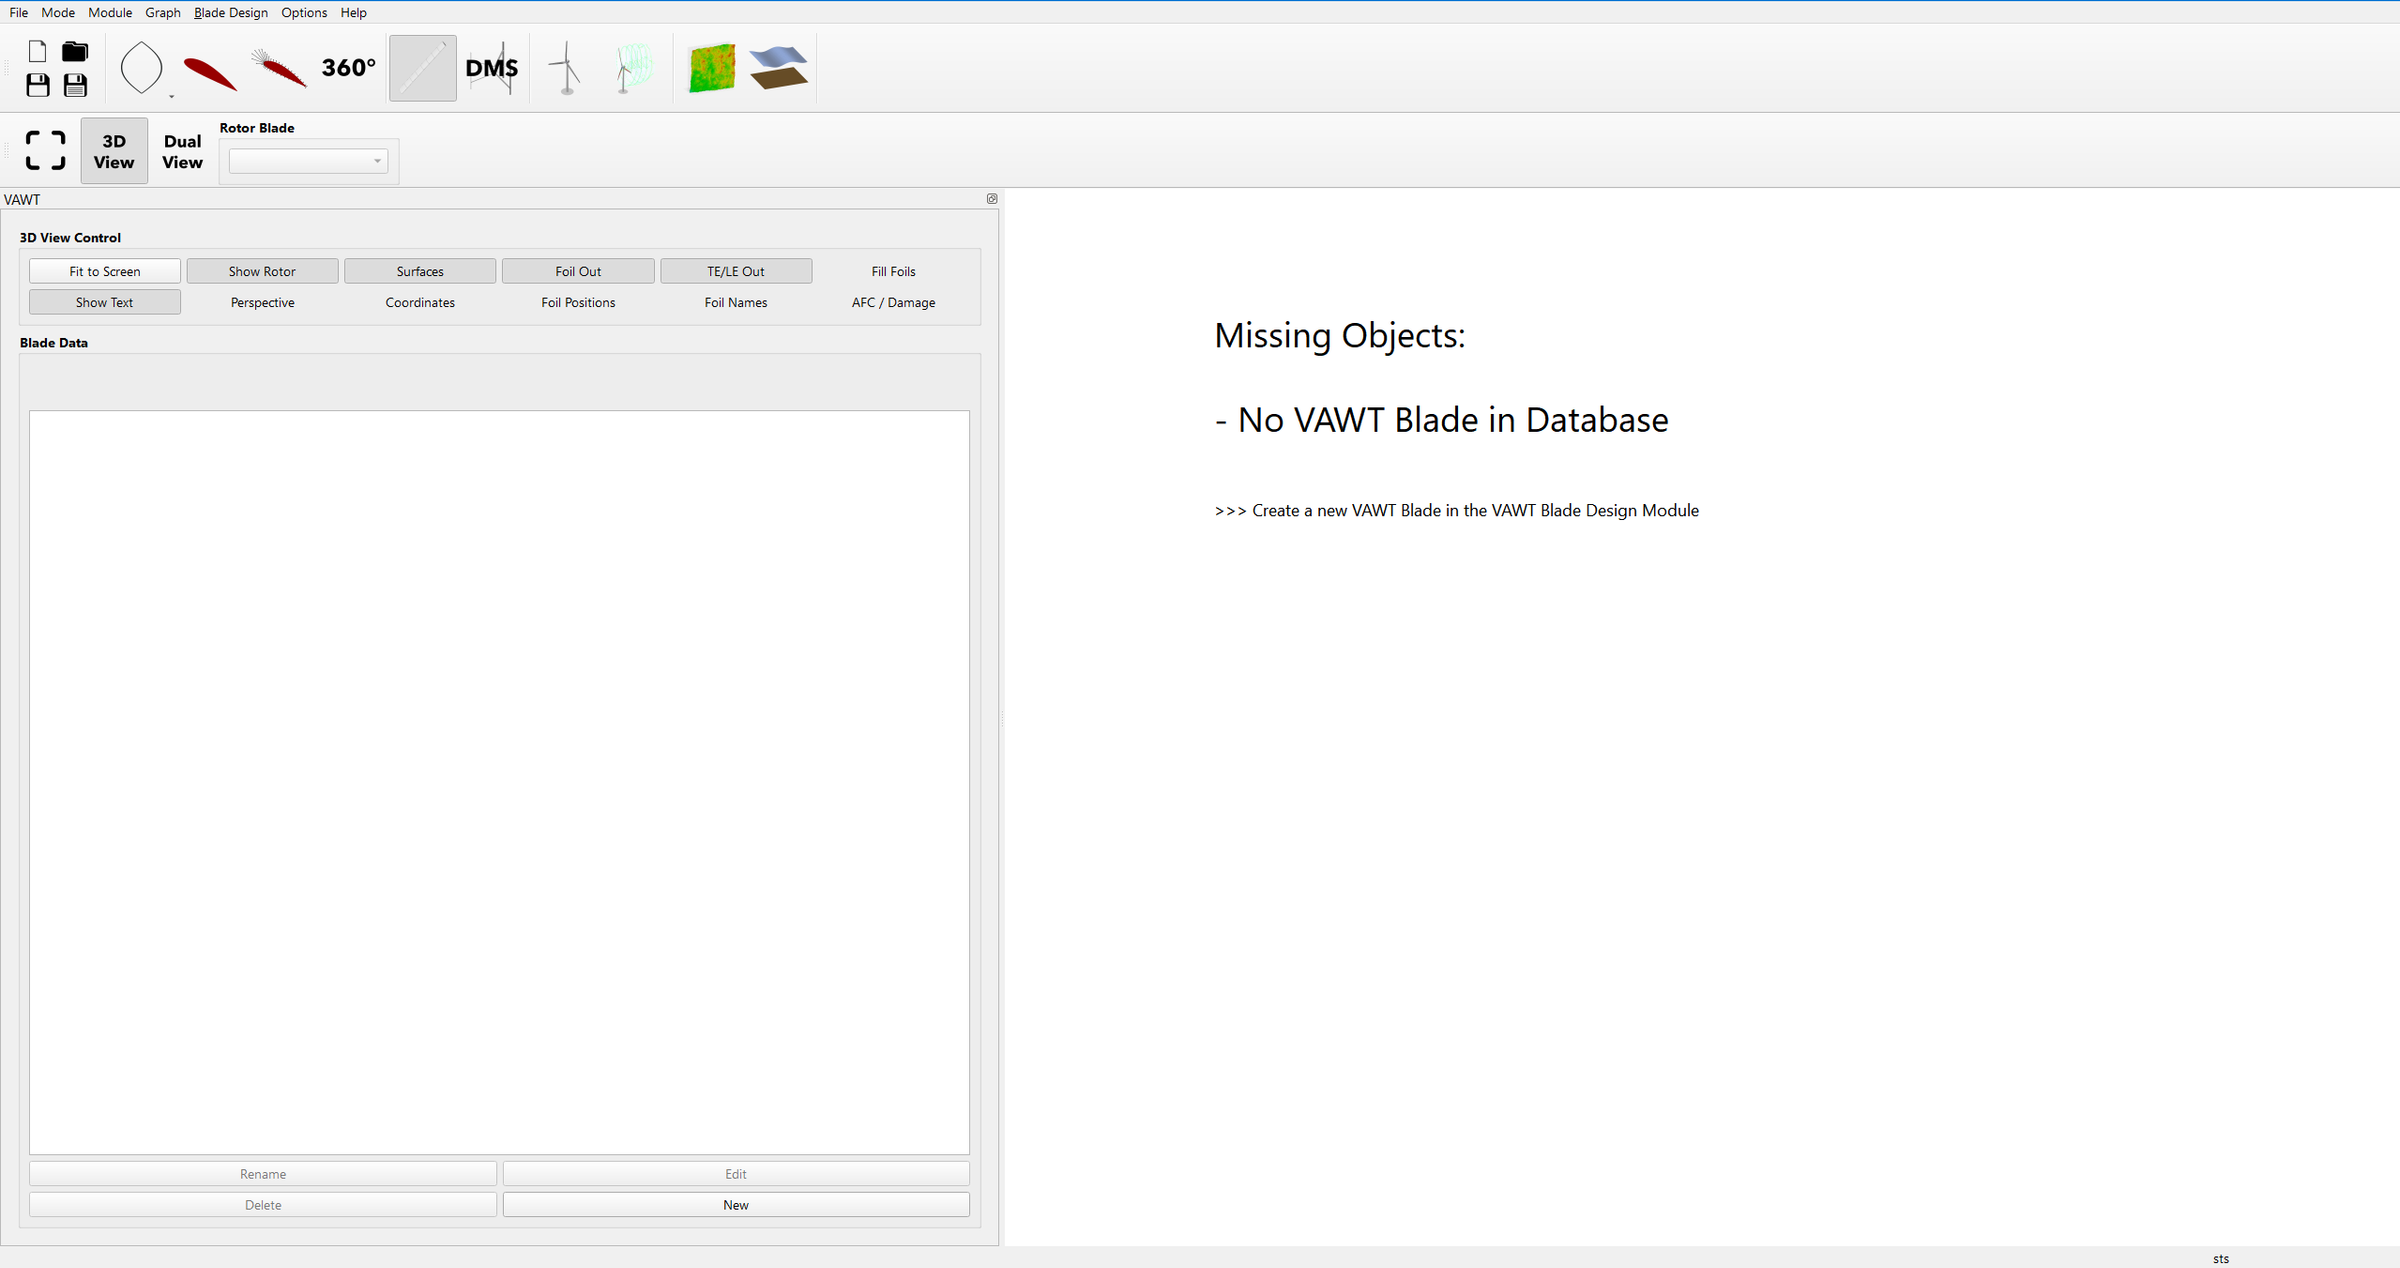
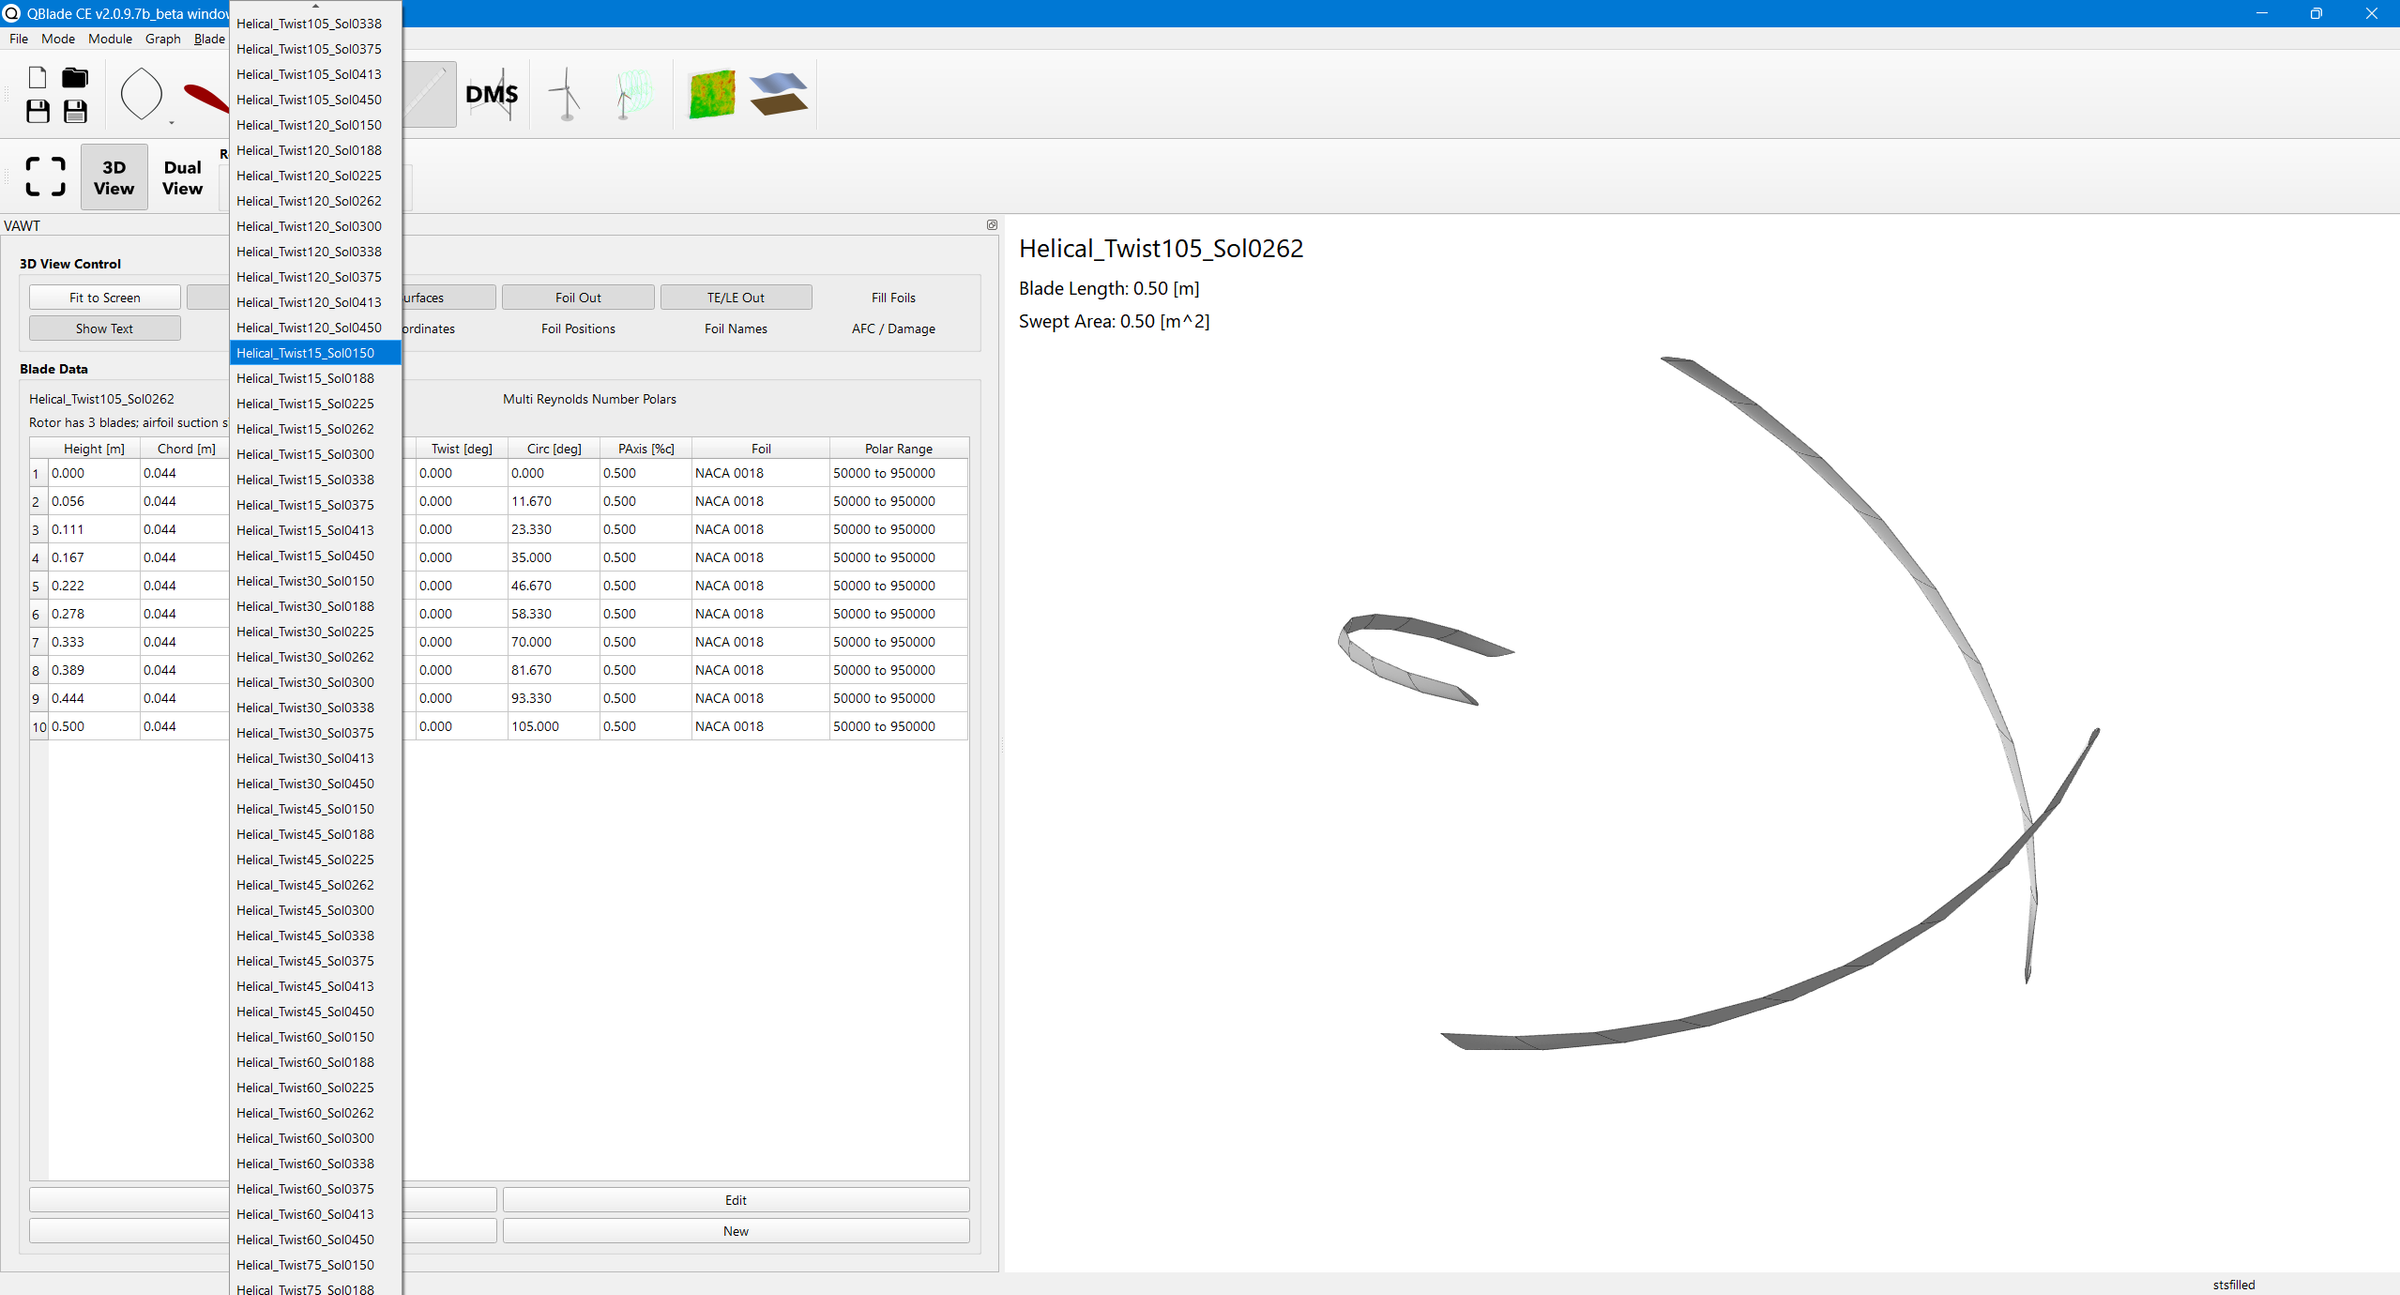
Since we are going to be looking through 800 blade profiles, rather than making each by hand, we will be using procedural generation to generate all 800 profiles. These profiles vary twist and solidity.
Simply run the python program and then it will generate 800 .bld files. Just upload each profile. Be careful to notice which blade follows NACA 0015 and NACA 0018
Downloads
Setting Parameters
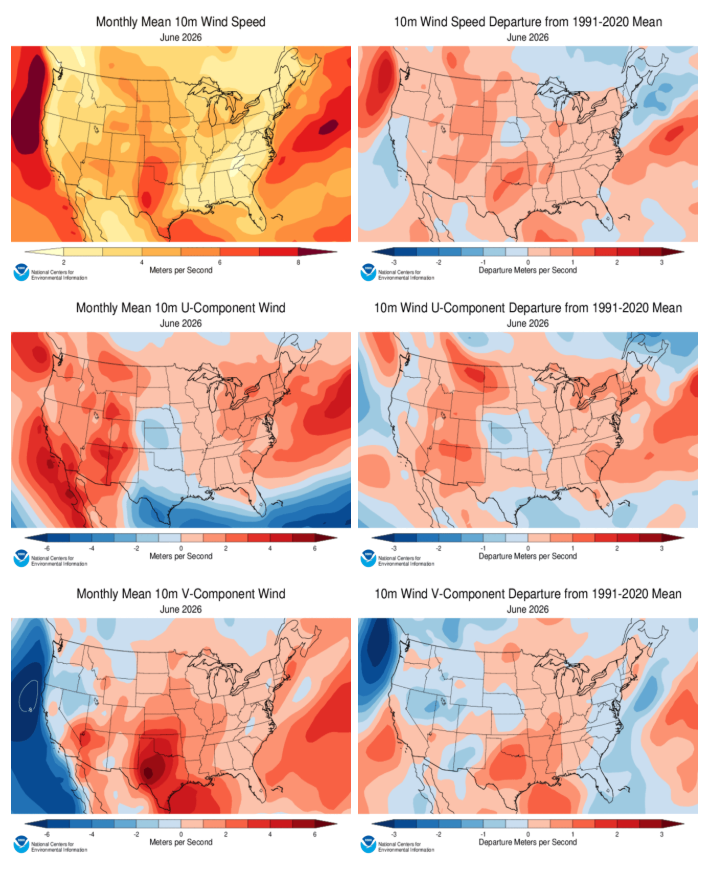
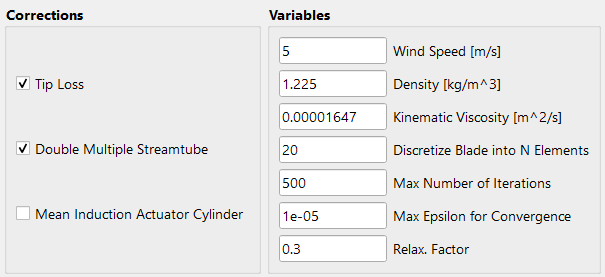
Using NOAAs wind data, set up the simulations to reflect the wind conditions where you live.
Data Aquisition
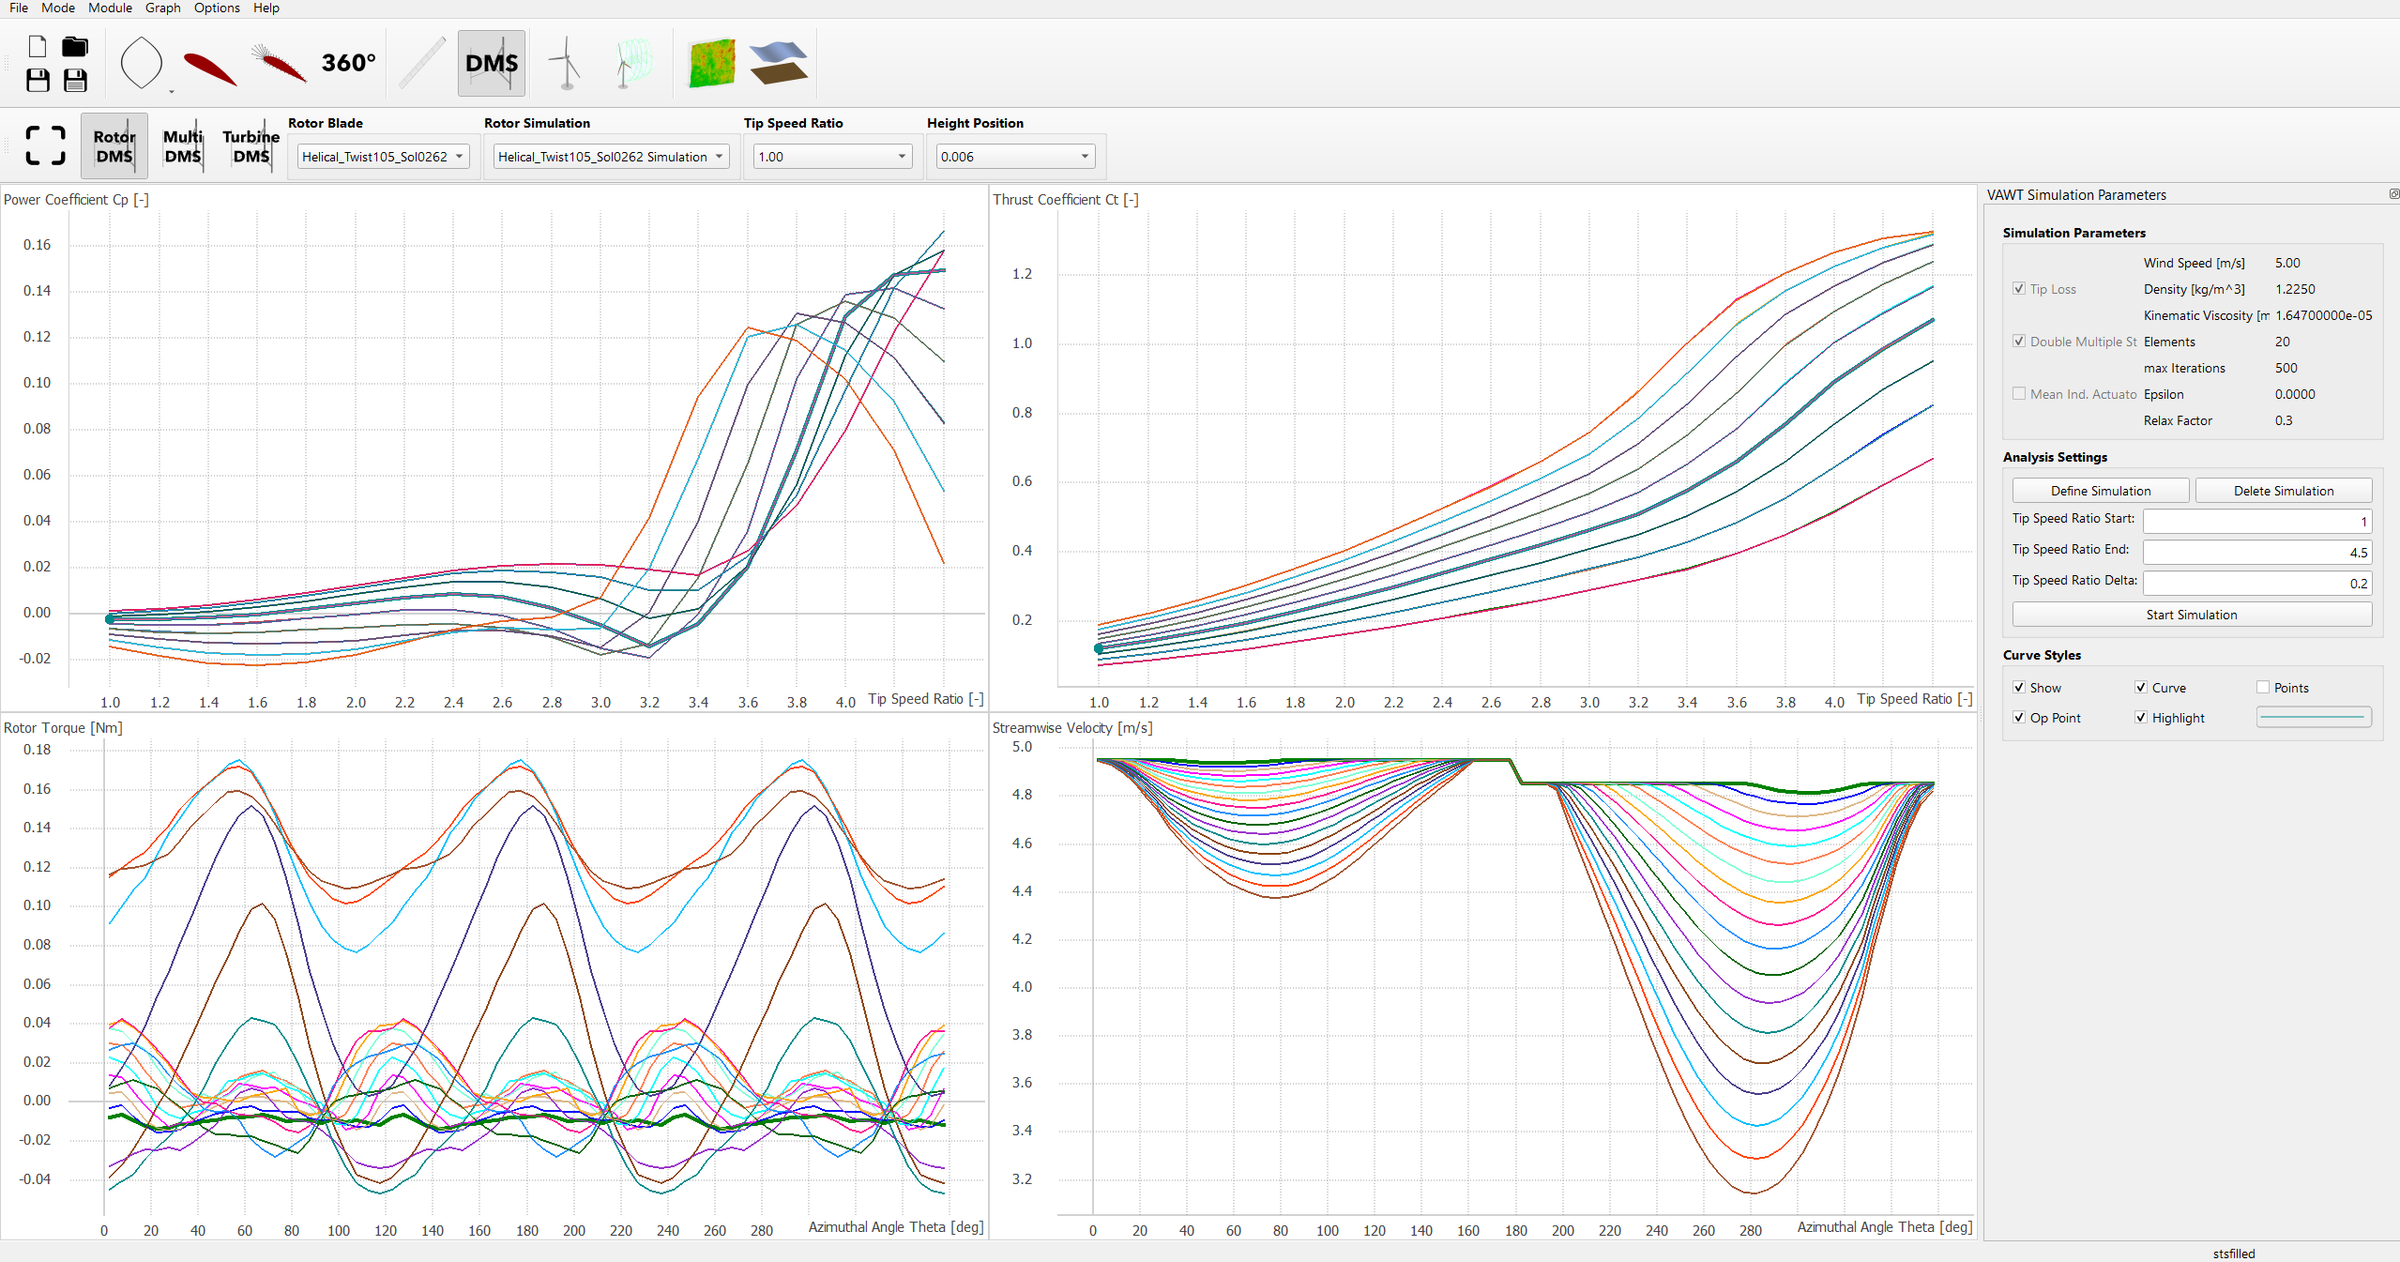
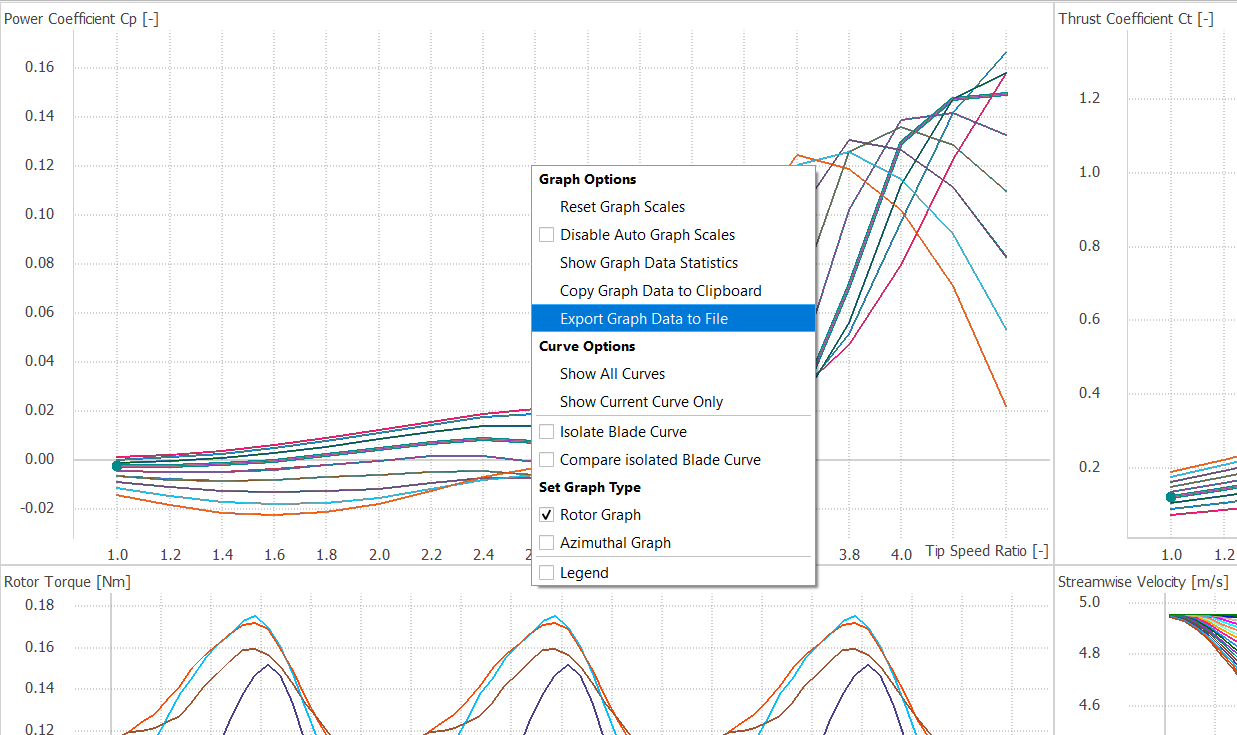
Once done, simply run the 800 simulations and export the data as a .csv file on your computer. Start by exporting the power coefficient data, then export the Rotor Torque data for each of the 800 blades.
Saving the Files
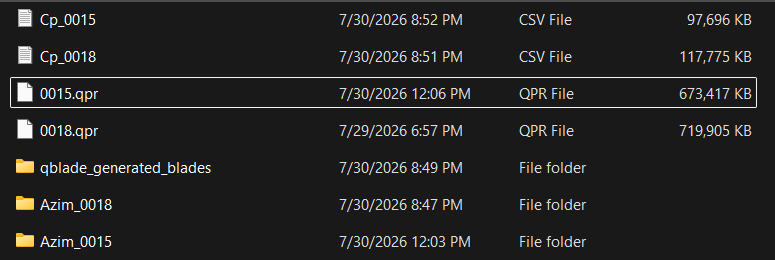
Make sure to save CSV files following this structure and save it to the same folder as the upcoming python files.
Understanding the Model
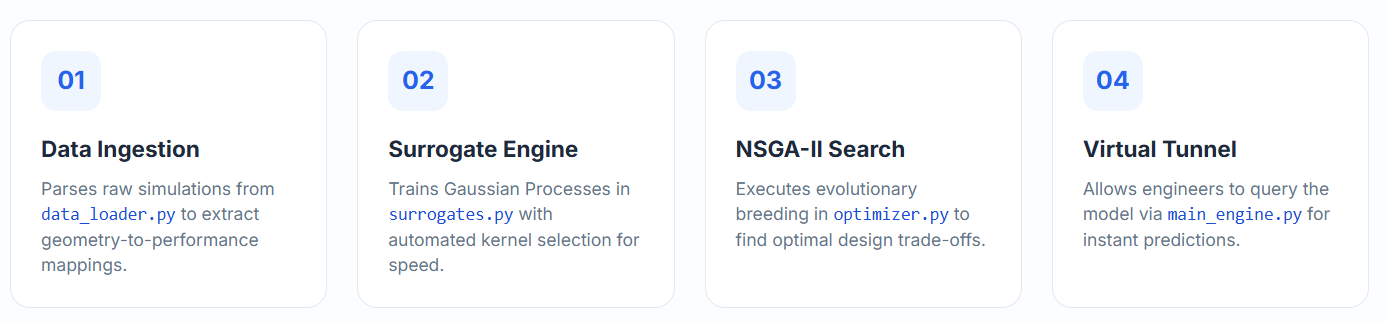
The AI works by first parsing and cleaning raw Computational Fluid Dynamics (CFD) simulation data that maps turbine parameter, such as blade thickness, twist, and solidity—to their resulting aerodynamic efficiency (Cp) and structural vibration loads, measured as the Torque Ripple Factor (TRF). To bypass the immense computational time and expense of running continuous CFD simulations for every possible design, the system trains mathematically robust Gaussian Process surrogate models to rapidly predict Cp and TRF for new, untested geometries. It then feeds these predictive models into a genetic algorithm (NSGA-II) to evaluate thousands of designs and map out the "Pareto front," which represents the mathematically optimal trade-off solutions. Ultimately, this pipeline exists to allow engineers to systematically discover physical turbine configurations that maximize aerodynamic power generation while safely minimizing structural fatigue and torque ripple.
Why Balance TRF and Cp
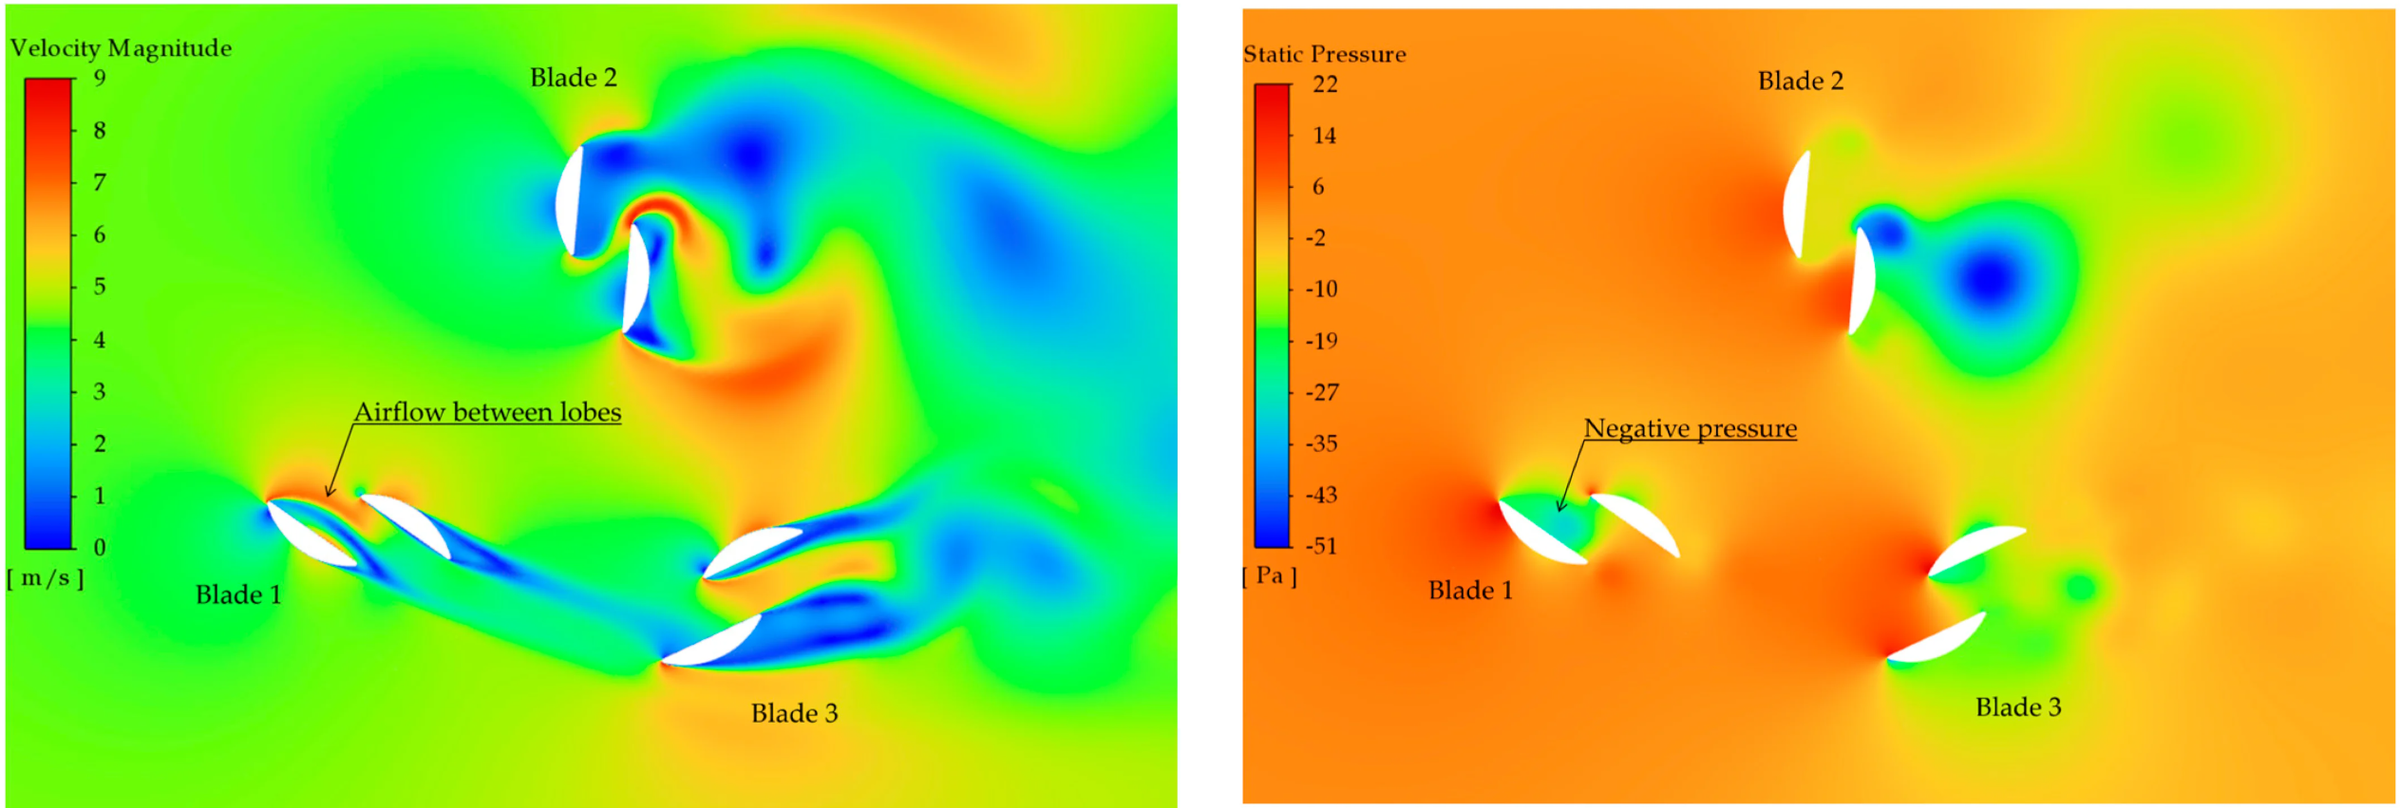
Balancing TRF (Torque Ripple Factor) and Cp (Power Coefficient) is the fundamental trade-off in wind turbine design because it pits power generation directly against structural survival.
Maximizing Cp (Power Generation): Cp measures the aerodynamic efficiency of the turbine. The primary goal is to maximize this value to extract as much energy from the wind as possible.
Minimizing TRF (Structural Survival): TRF represents the structural loads and vibration forces acting on the turbine. You want to minimize this value to reduce structural fatigue and prevent mechanical failure.
Pareto Front
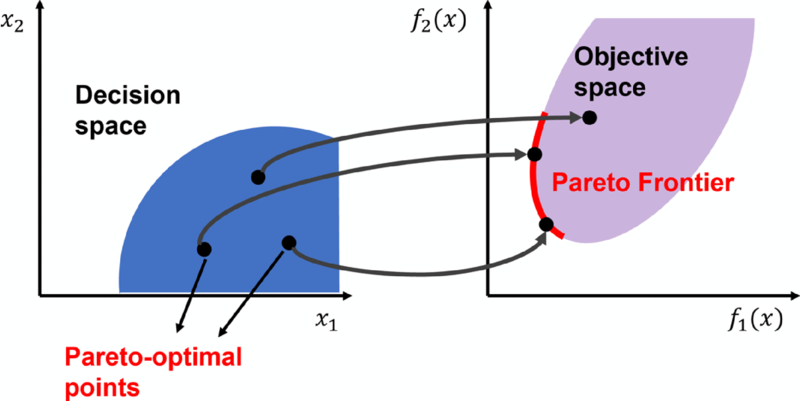
A Pareto front is the set of optimal solutions in a multi-objective optimization problem where no single objective can be improved without degrading another. Because competing goals naturally conflict, there is rarely a single "perfect" answer; instead, the Pareto front visualizes a boundary line of trade-offs representing the absolute best compromise solutions available.
In this project, the Pareto front maps out the ideal wind turbine geometries that maximize aerodynamic power generation (Cp) while minimizing structural vibration loads (TRF). By analyzing this boundary curve, engineers can easily select the exact design compromise that fits their specific targets for efficiency and mechanical durability.
Config
This is the central control board for the entire project. It stores directory paths, physical boundary limits for the turbine designs (like minimum and maximum values), machine learning hyperparameters, and the specific settings for the genetic optimizer.
Downloads
Data Loader
This parses the raw computational fluid dynamics (CFD) simulation files to extract aerodynamic efficiency (Cp) and structural vibration (TRF) data. It also caches the data to speed up future runs and scrubs out statistical anomalies or impossible values using the rules set in the config file.
Downloads
Surrogates
This is the machine learning brain. It takes the cleaned data and trains Gaussian Process surrogate models to rapidly predict Cp and TRF for brand new turbine designs. It handles splitting the data, automatically finding the best mathematical kernel, and validating the model's accuracy.
Downloads
Optimizer
This is the evolutionary engine. It uses a genetic algorithm (NSGA-II) to "evolve" thousands of potential turbine designs. It continuously queries the surrogate models to figure out which designs offer the absolute best trade-off between maximizing power generation (Cp) and minimizing structural wear (TRF).
Downloads
Main Engine
This is the main executor. It ties everything together by running the data loader, triggering the surrogate training, executing the optimizer, and generating high-quality graphs of the results. It also features an interactive "virtual wind tunnel" at the end so you can manually test specific inputs
Downloads
Setting It Up
Once you have all 5 files, go ahead and open the venv in your command prompt and run the main file.
Outputs
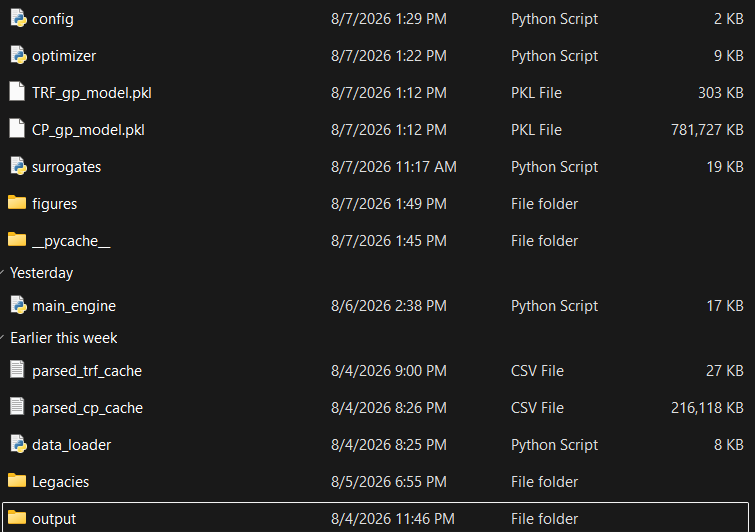
The outputs from the AI will auto populate in specific folders.
Folders
- figures/: Stores generated publication-quality plots and visual diagnostics, such as Actual vs. Predicted regression graphs, residual distributions, and Pareto front trade-off curves.
- output/: Contains the exported optimization results (e.g., Optimal_Pareto_Designs.csv) as well as the archived history of previous optimization runs. USE THIS FOR THE NEXT STEPS
- Legacies/: An archive directory used to store older code versions, legacy scripts, or past experimental files.
- __pycache__/: A standard folder automatically generated by Python that holds compiled bytecode (.pyc files) to help the scripts load faster on execution.
Files
- CP_gp_model.pkl: The saved (serialized) machine learning model artifact for Aerodynamic Efficiency (Cp). It contains the trained Gaussian Process model, feature scalers, and hyperparameter metadata.
- TRF_gp_model.pkl: The saved machine learning model artifact for the structural Torque Ripple Factor (TRF).
- parsed_cp_cache.csv: A cached dataset of parsed aerodynamic CFD simulation data, stored to speed up pipeline initialization by avoiding re-parsing raw files.
- parsed_trf_cache.csv: A cached dataset of parsed structural time-series CFD data used to load steady-state TRF calculations quickly.
AI Performance
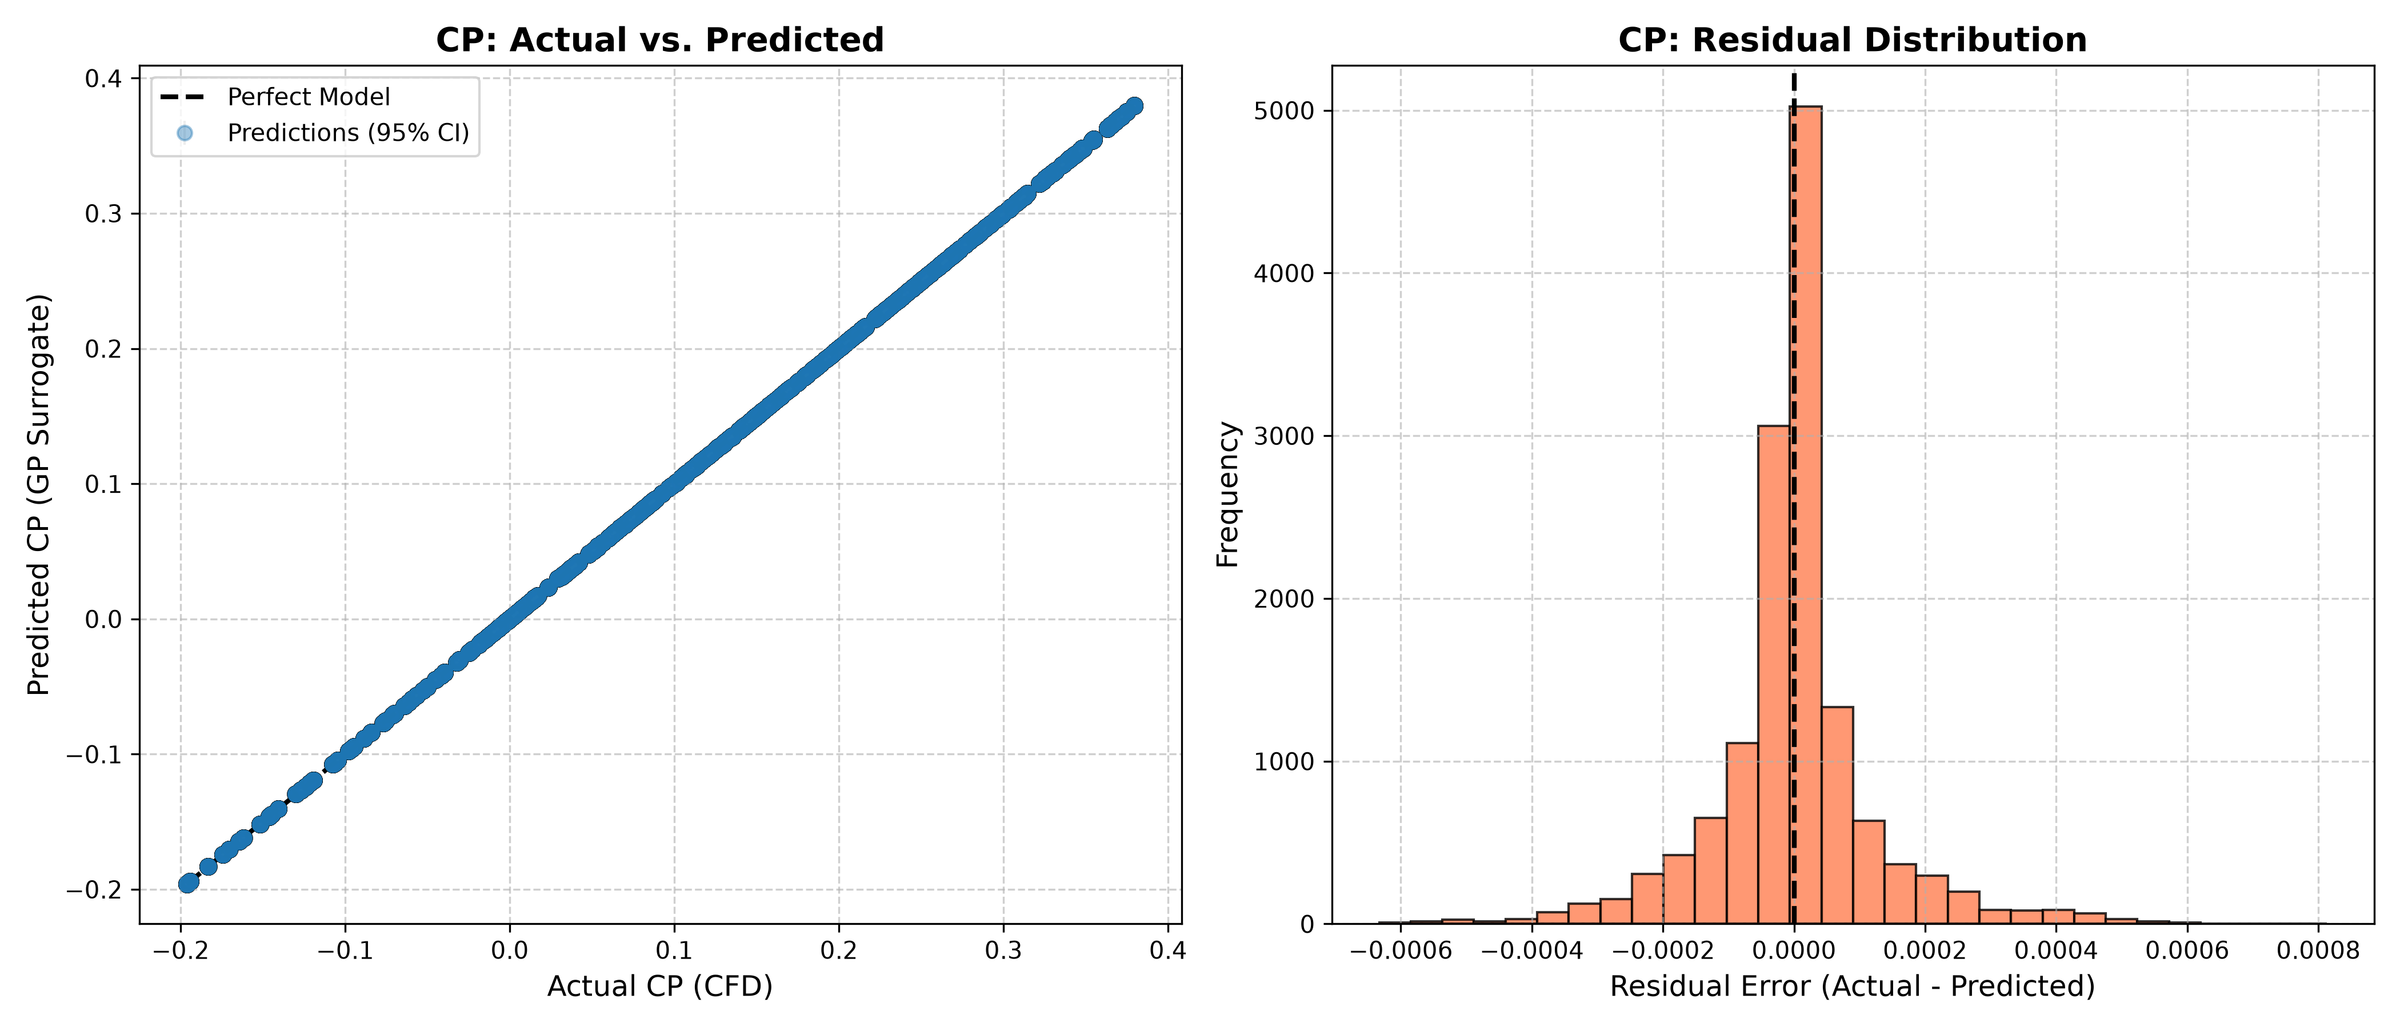
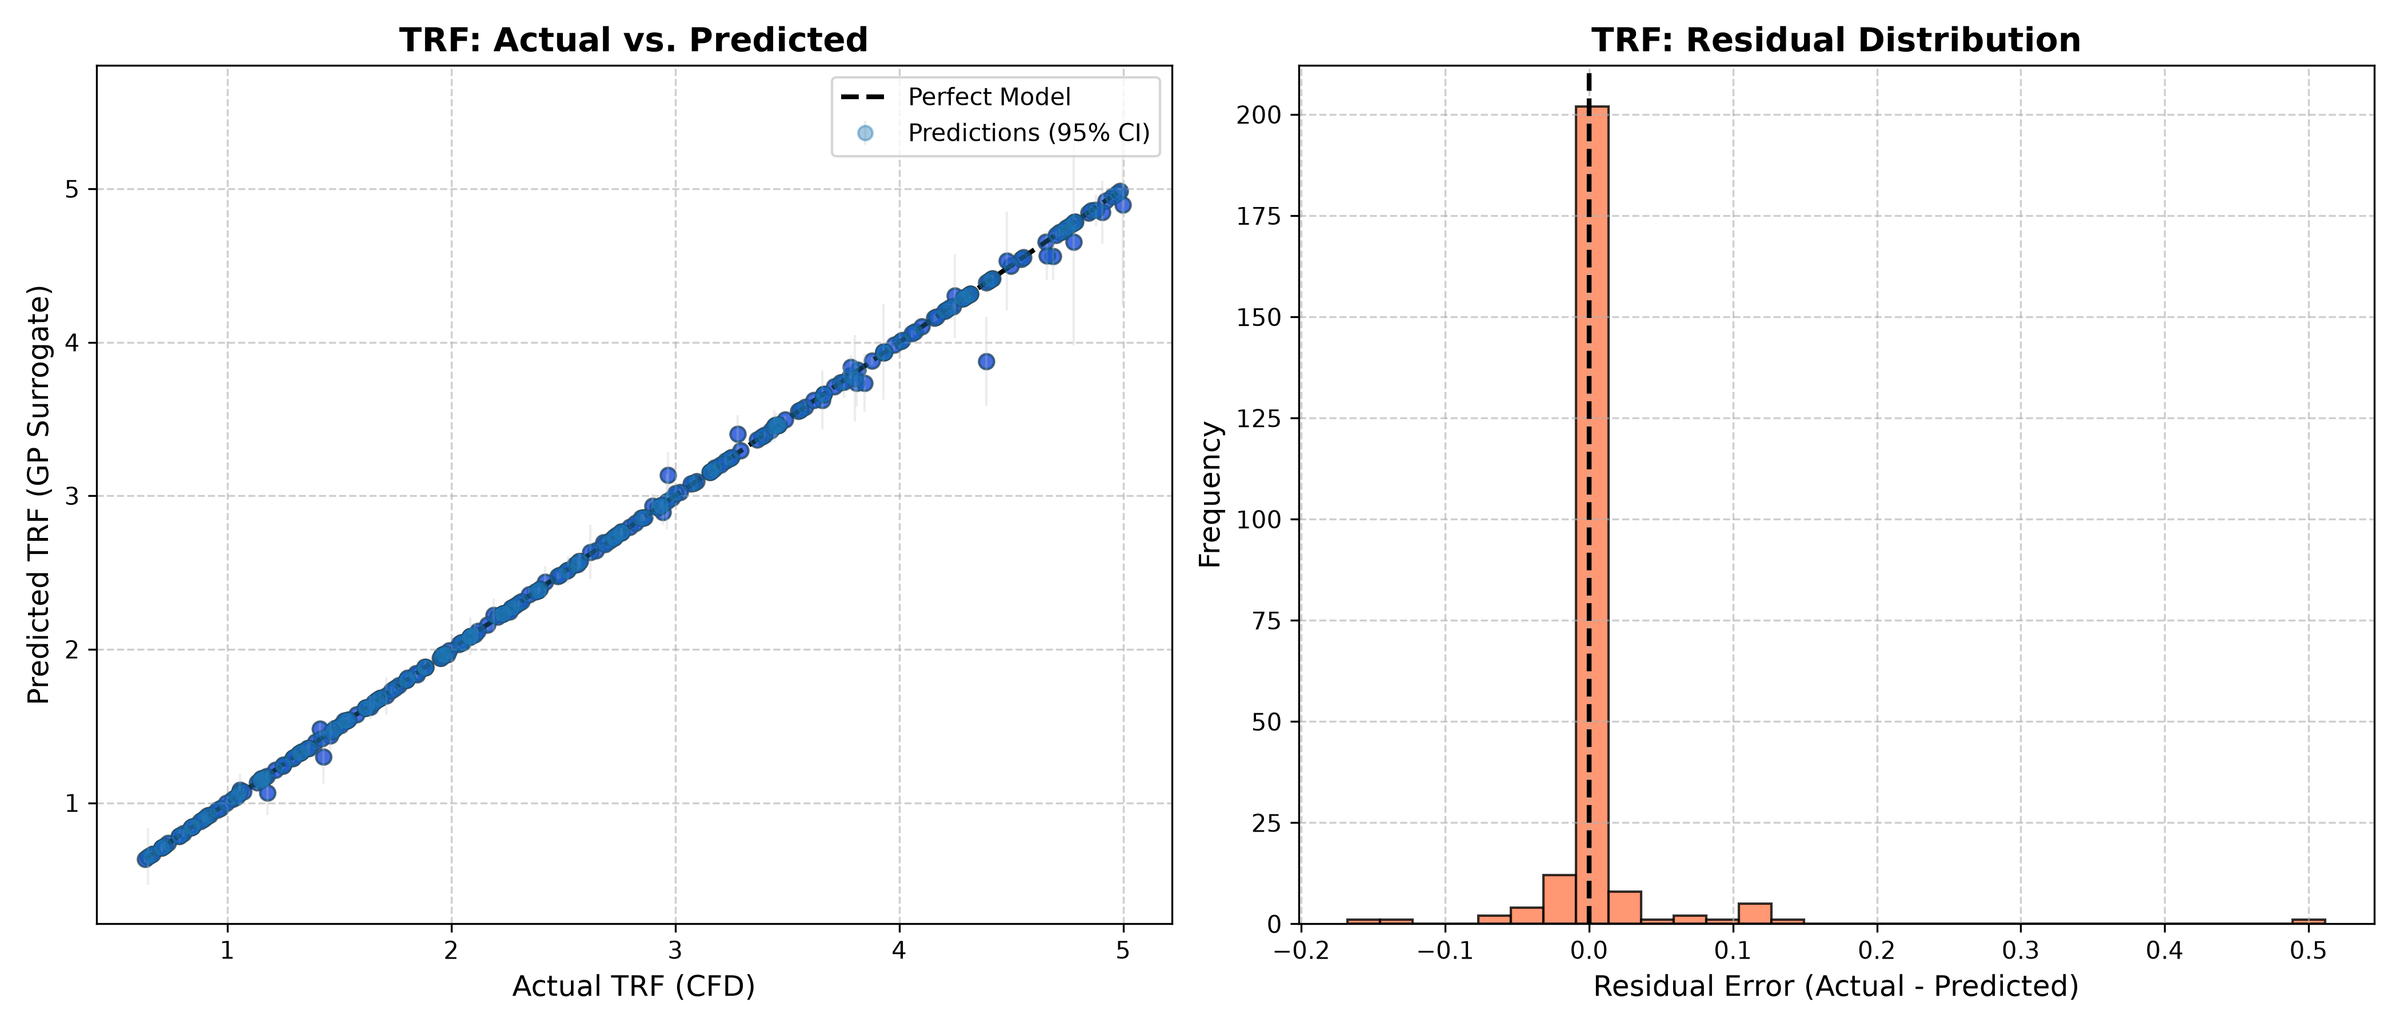
By opening the outputs folder, you will get a csv file with all of the optimal values the AI found. By looking at the graphs, you can visualize the accuracy of the AI.
Findings
.jpeg)
The figures folder will contain graphs that outline how well the optimal turbines perform. You can modify the penalty applied to TRF over a certain point to streamline your blade designs.
Comparison
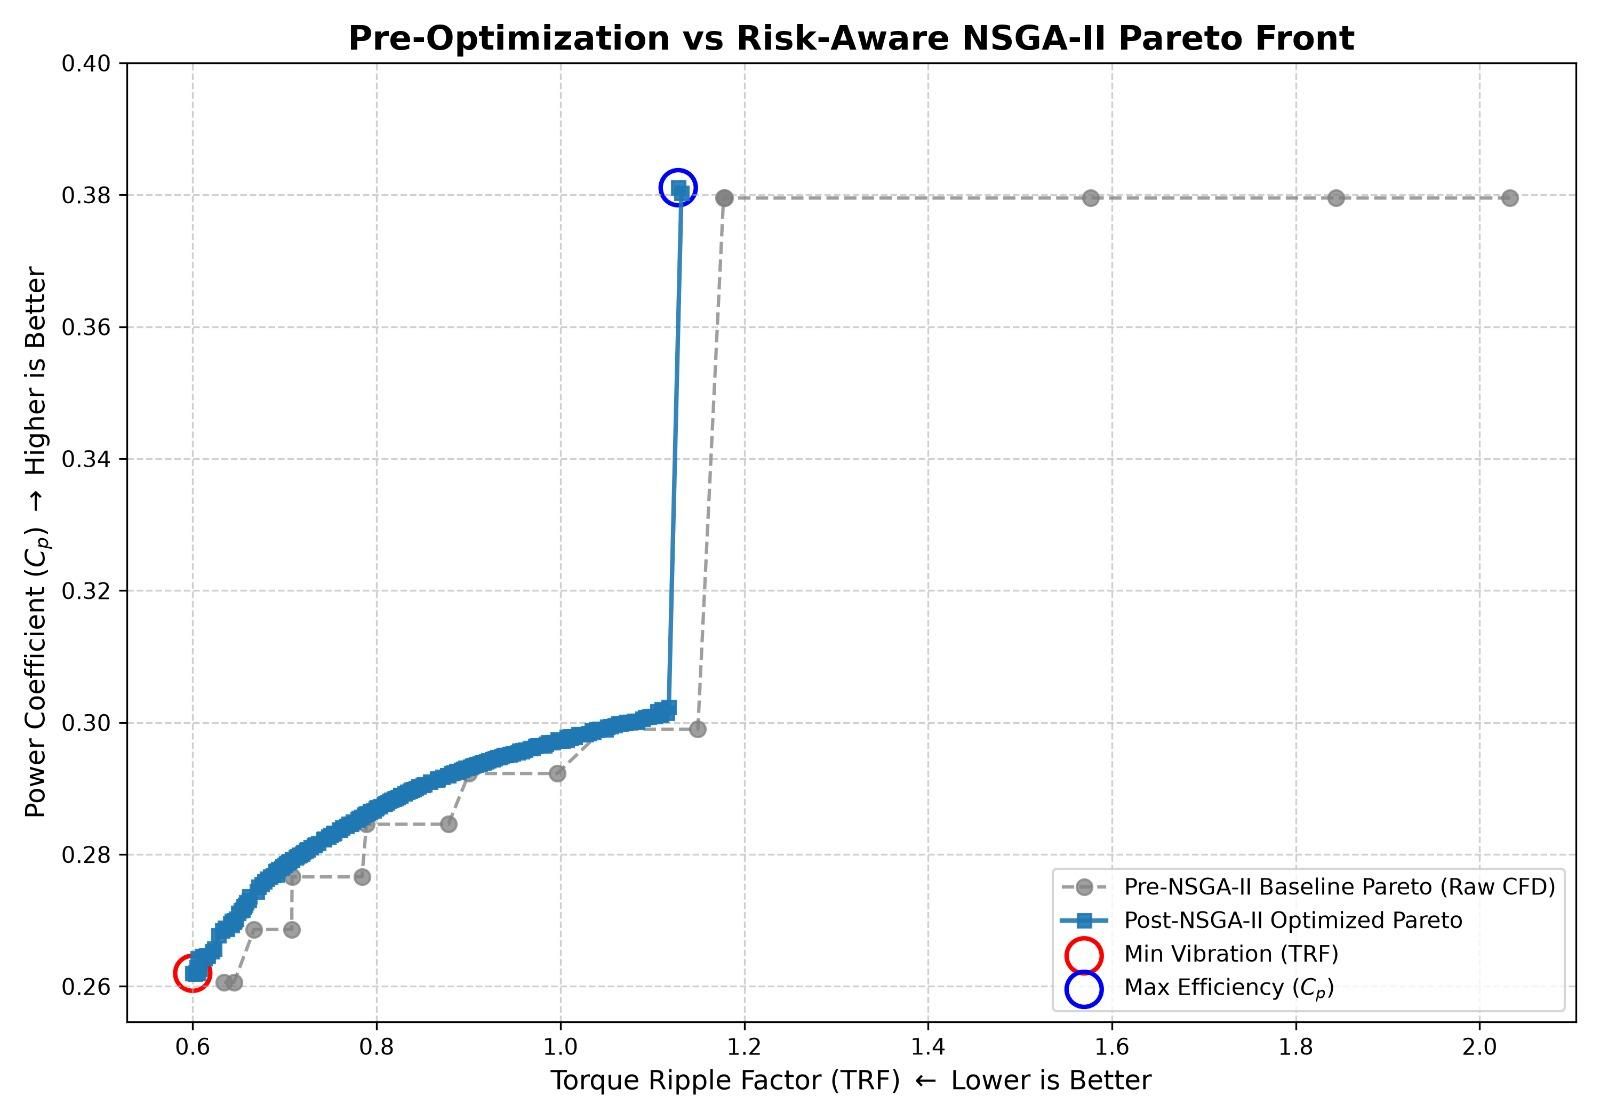
.jpeg)
You can also see how much better your AIs turbine designs are compared to raw test files.
Historical
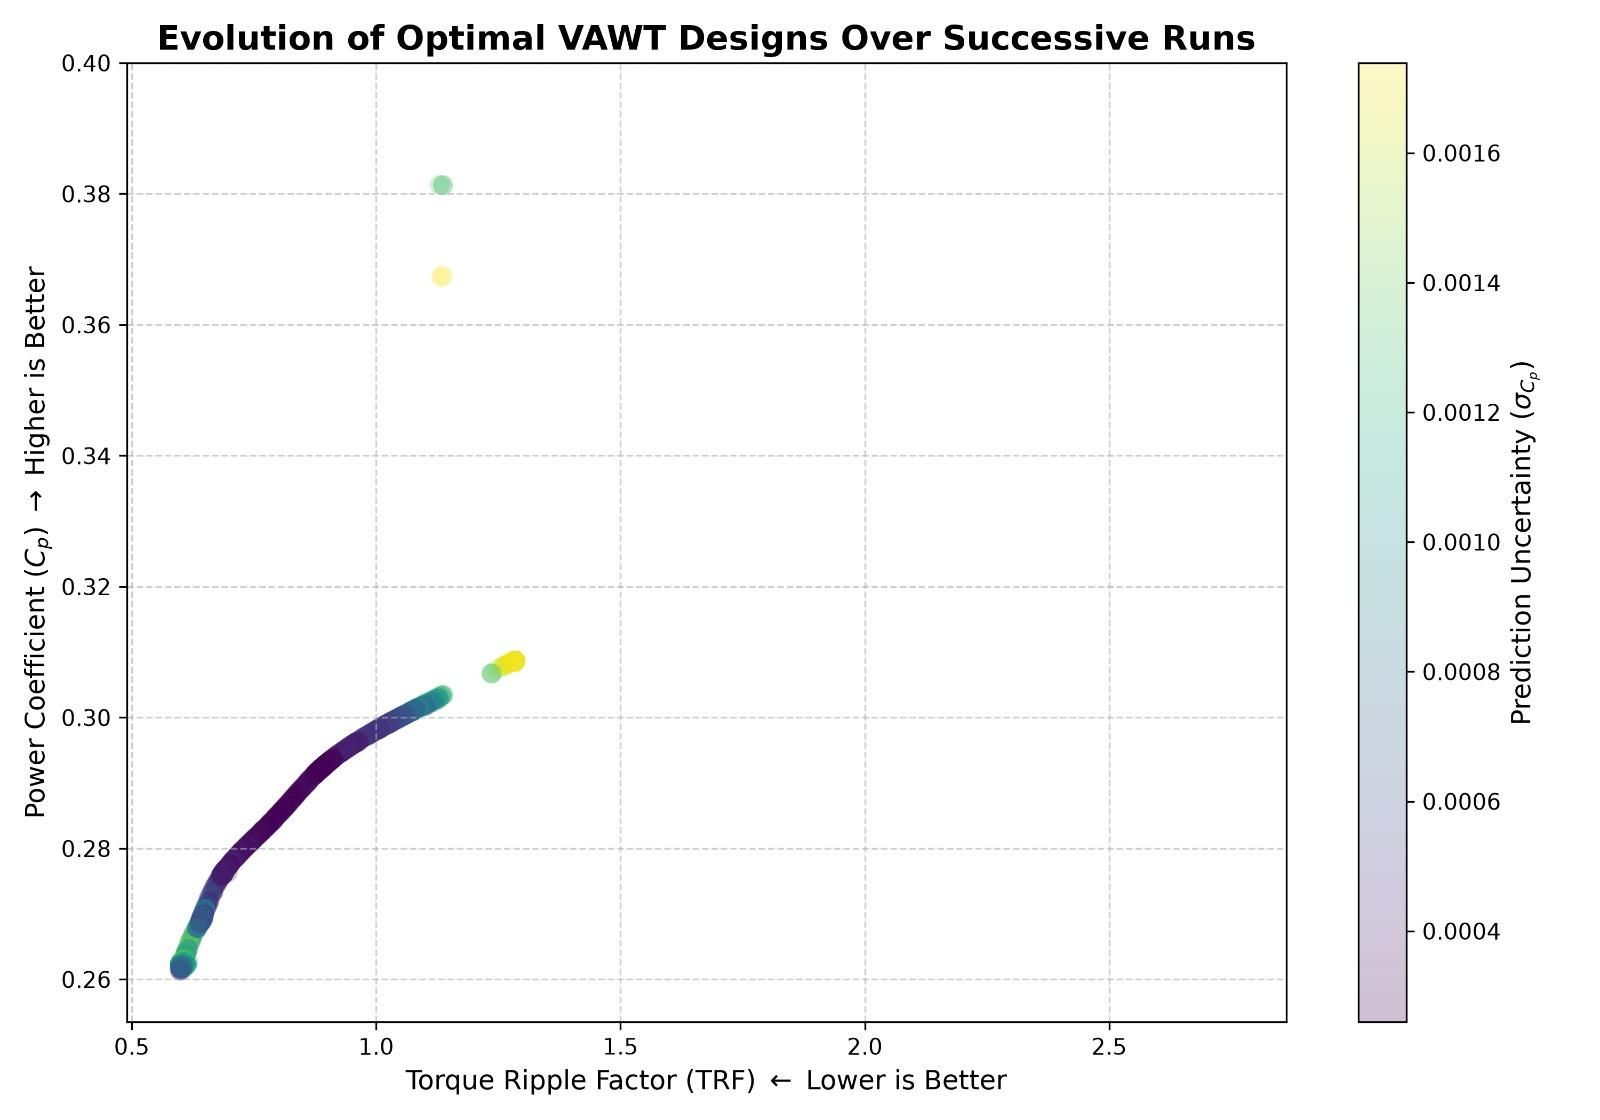
If you run the AI multiple times, you can see how it improves over time.
Moving Into CAD
We will now take these learnings and move into CAD to design the exact optimal wind turbine in Fusion360.
Airfoil
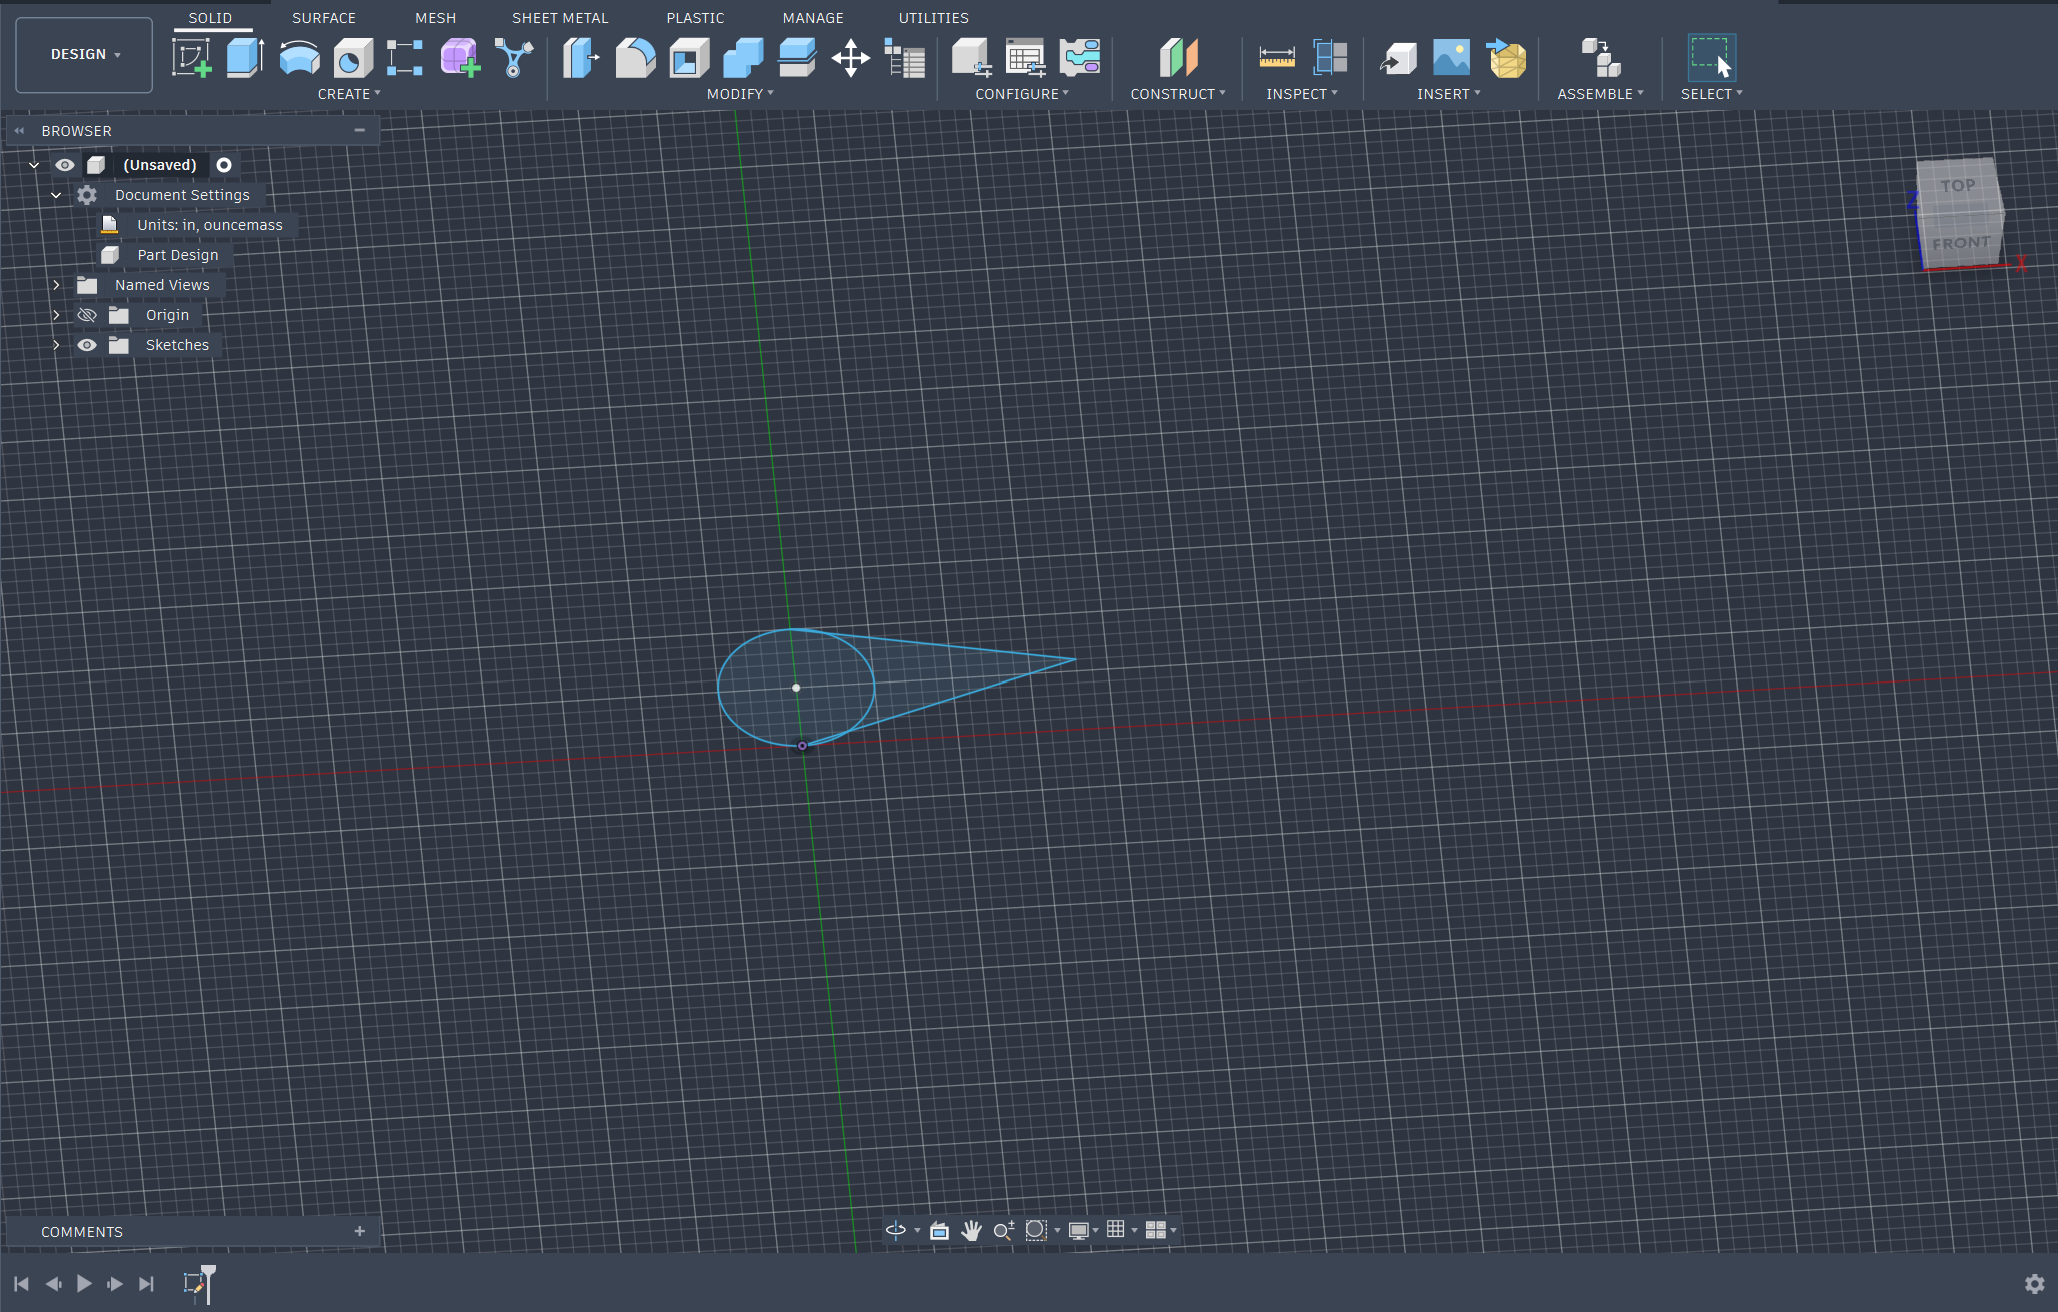
Start by sketching the optimal Airfoil and apply the solidity of whatever your model found to be optimal.
Blade Creation
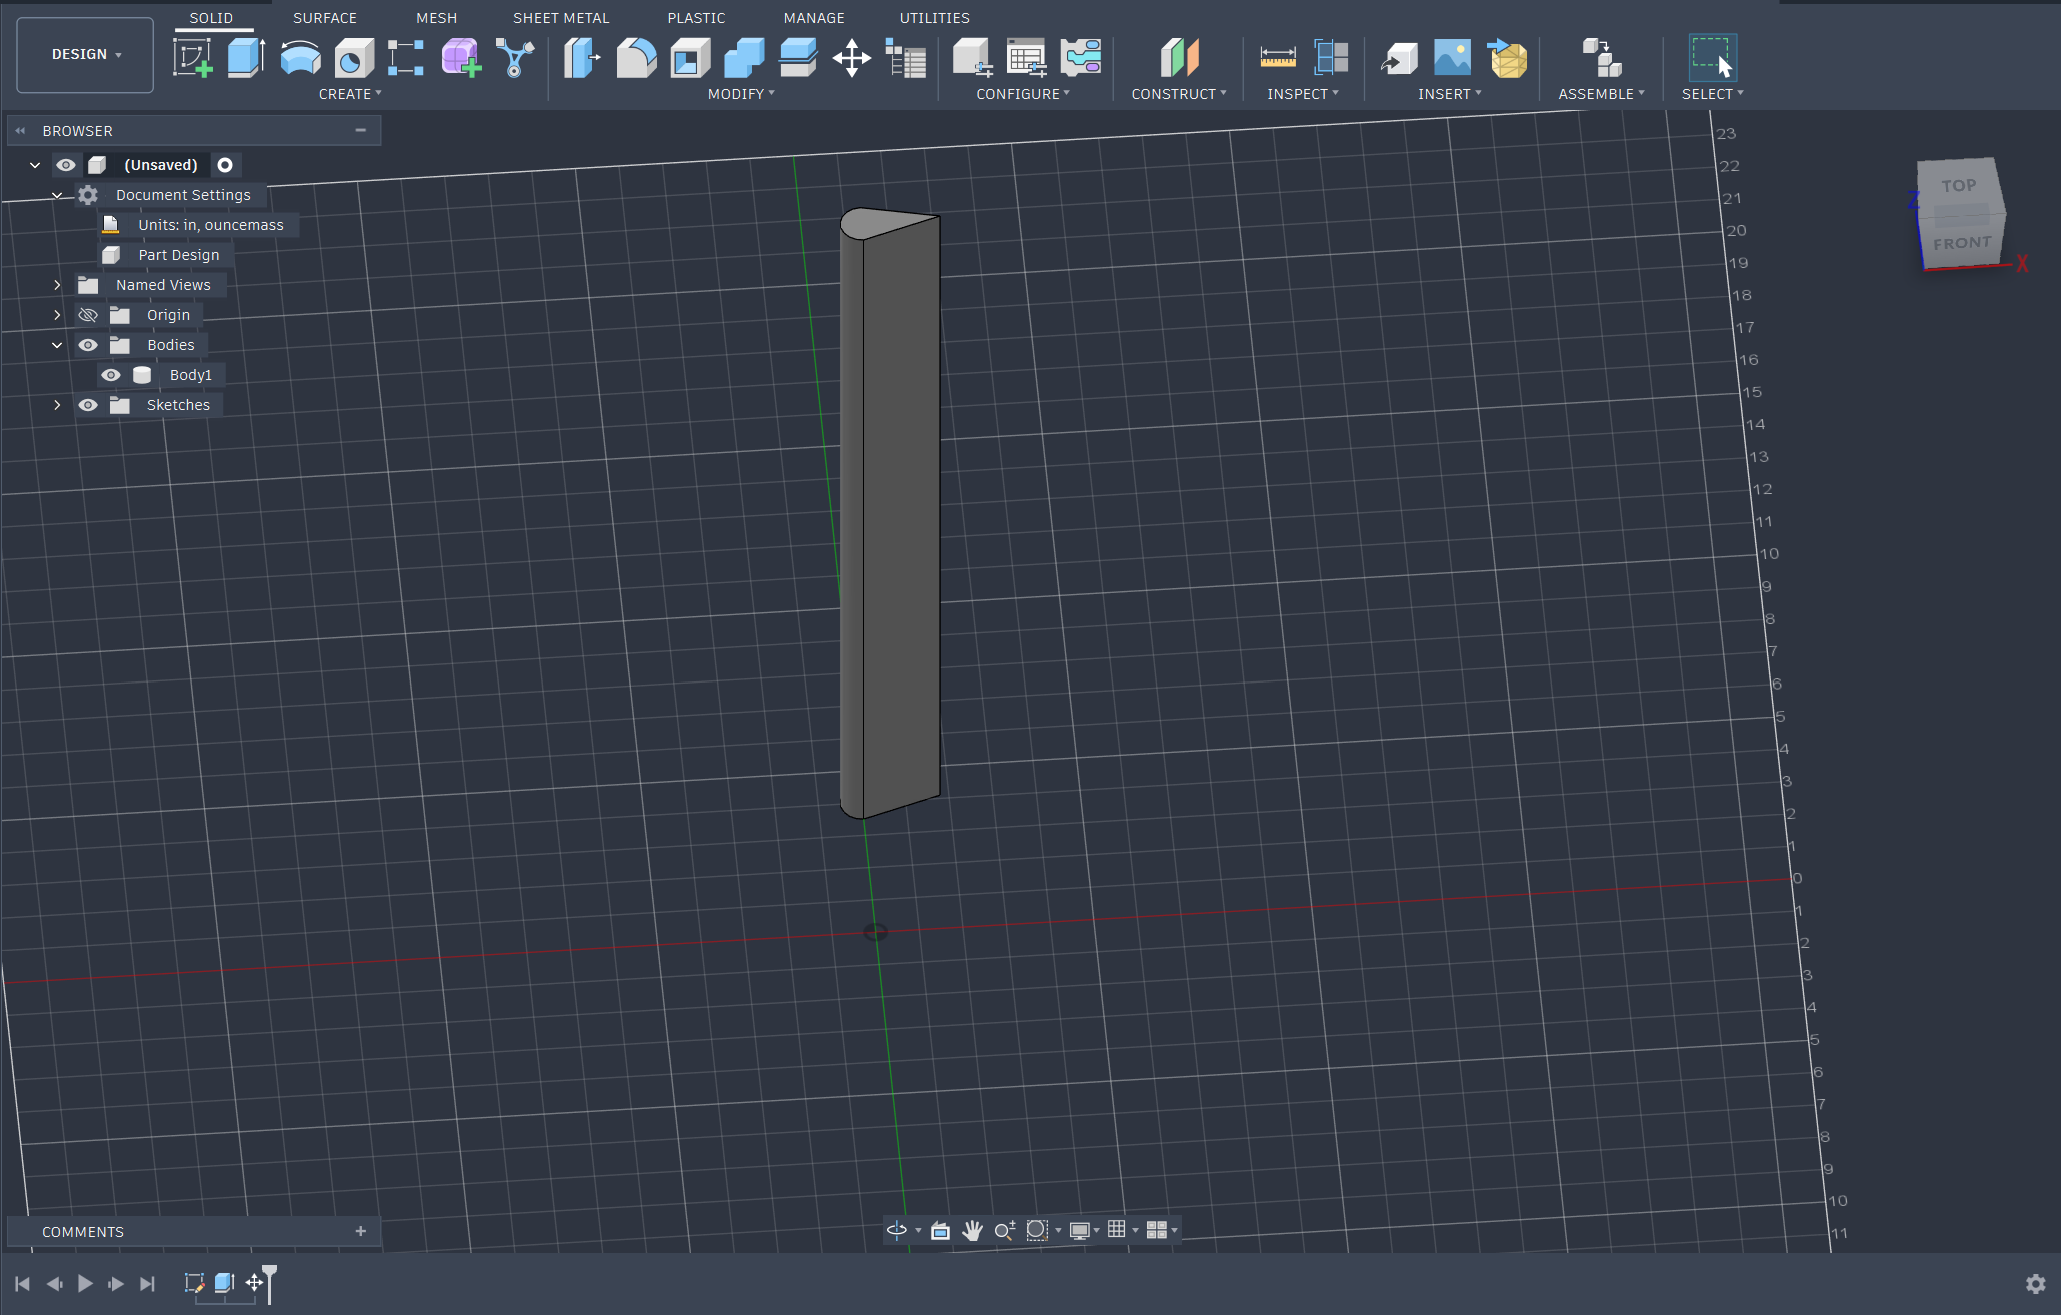
Then simply extrude it the size of the blade you simulated in Qblade (in my case 1 meter). If your AI found a twist to be optimal make sure to add the twist here. In my case my AI found a 0-degree twist optimal, which is why I am creating a wind turbine without a twist.
Create the Turbine Via Pattern
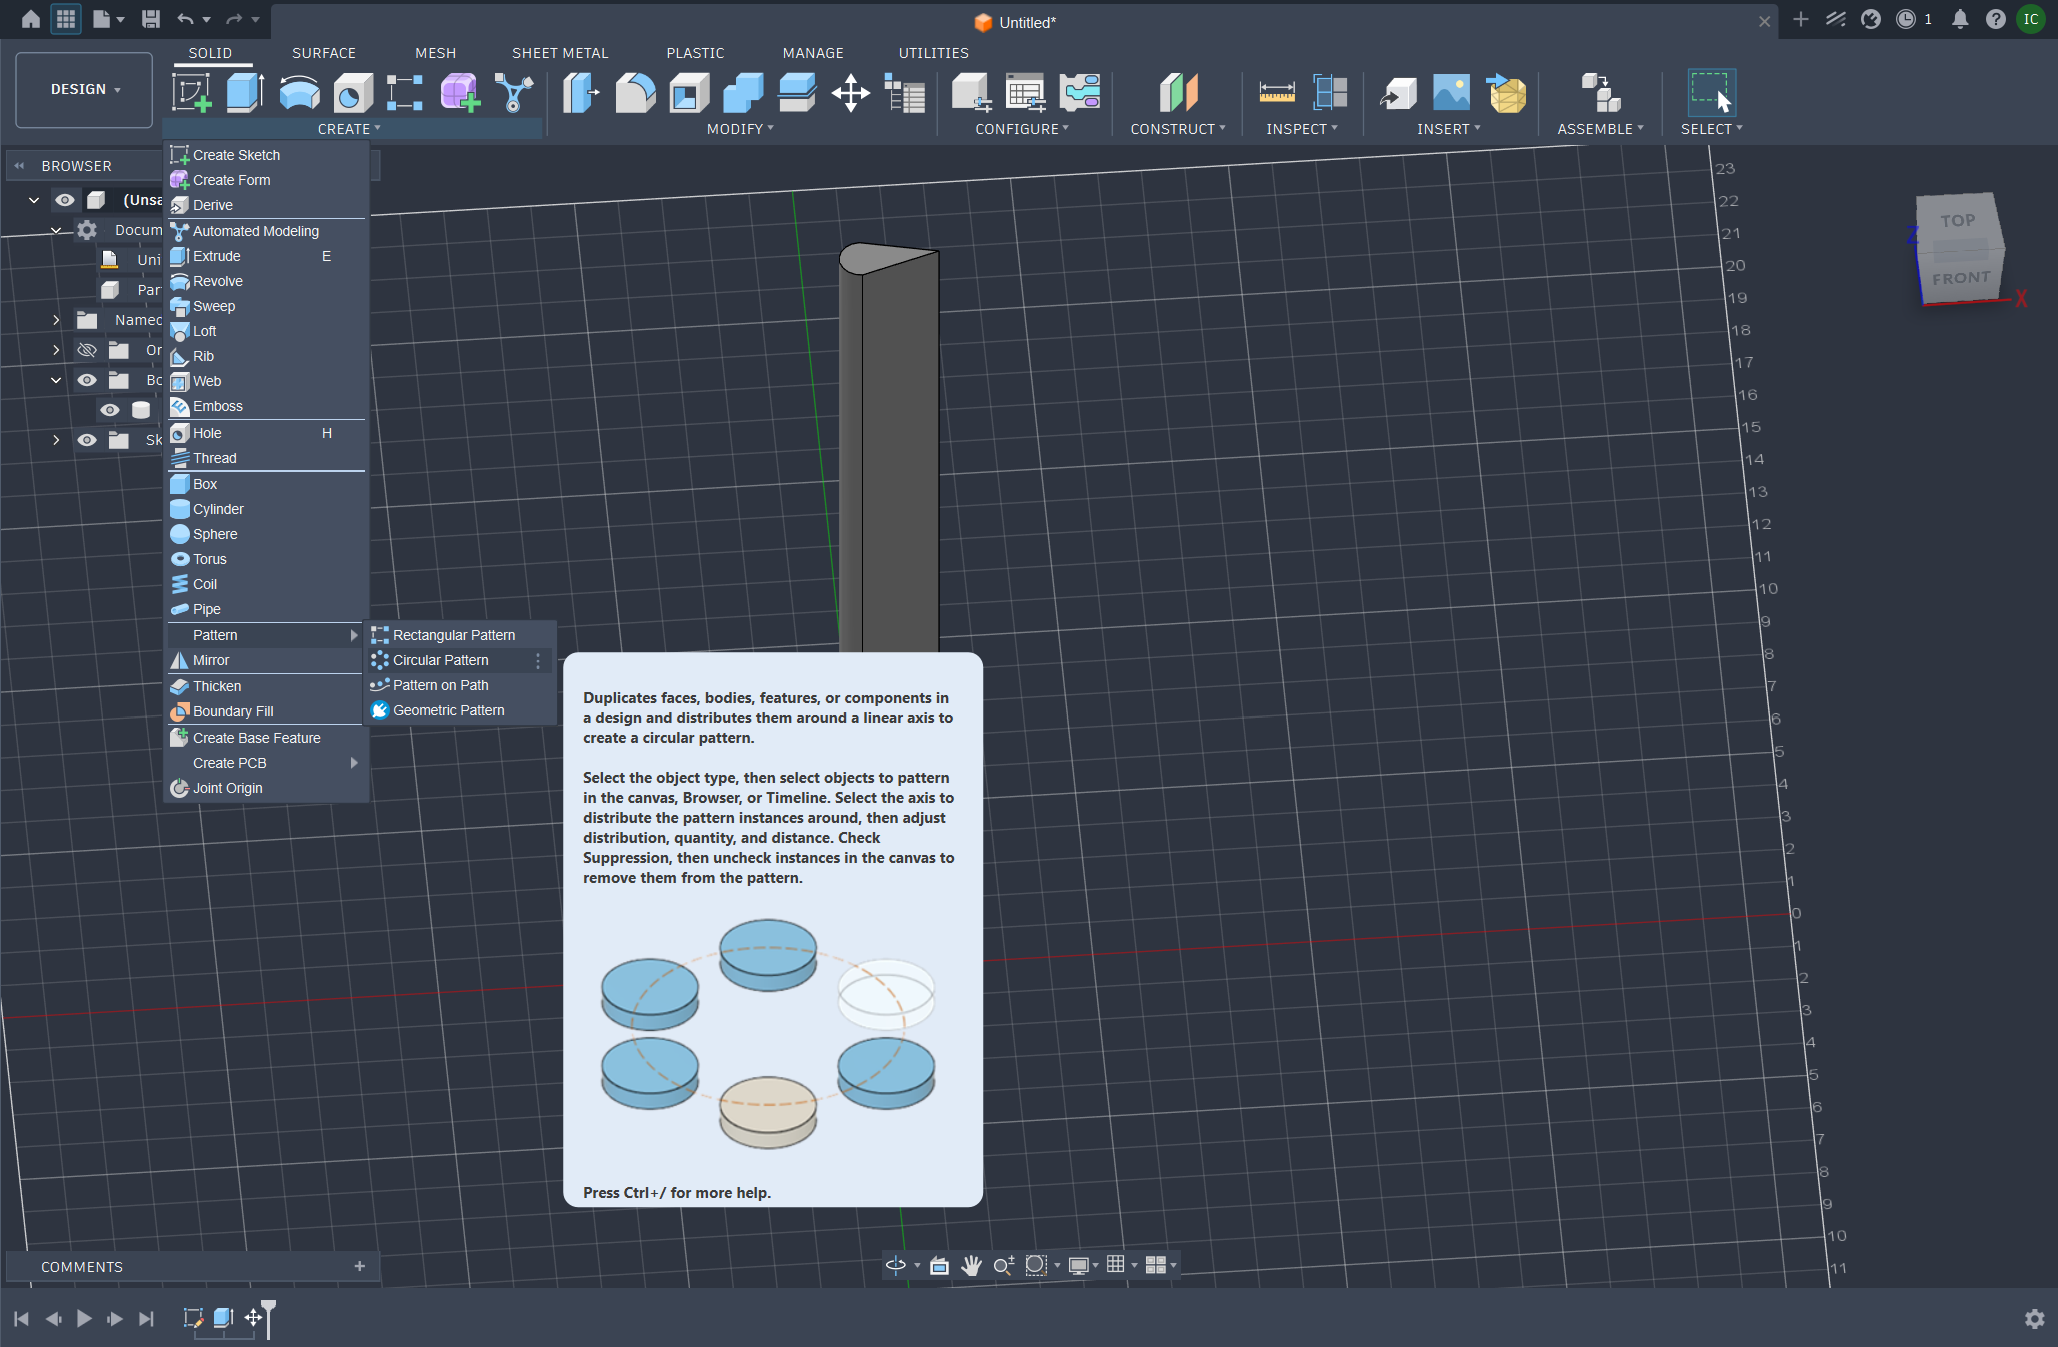
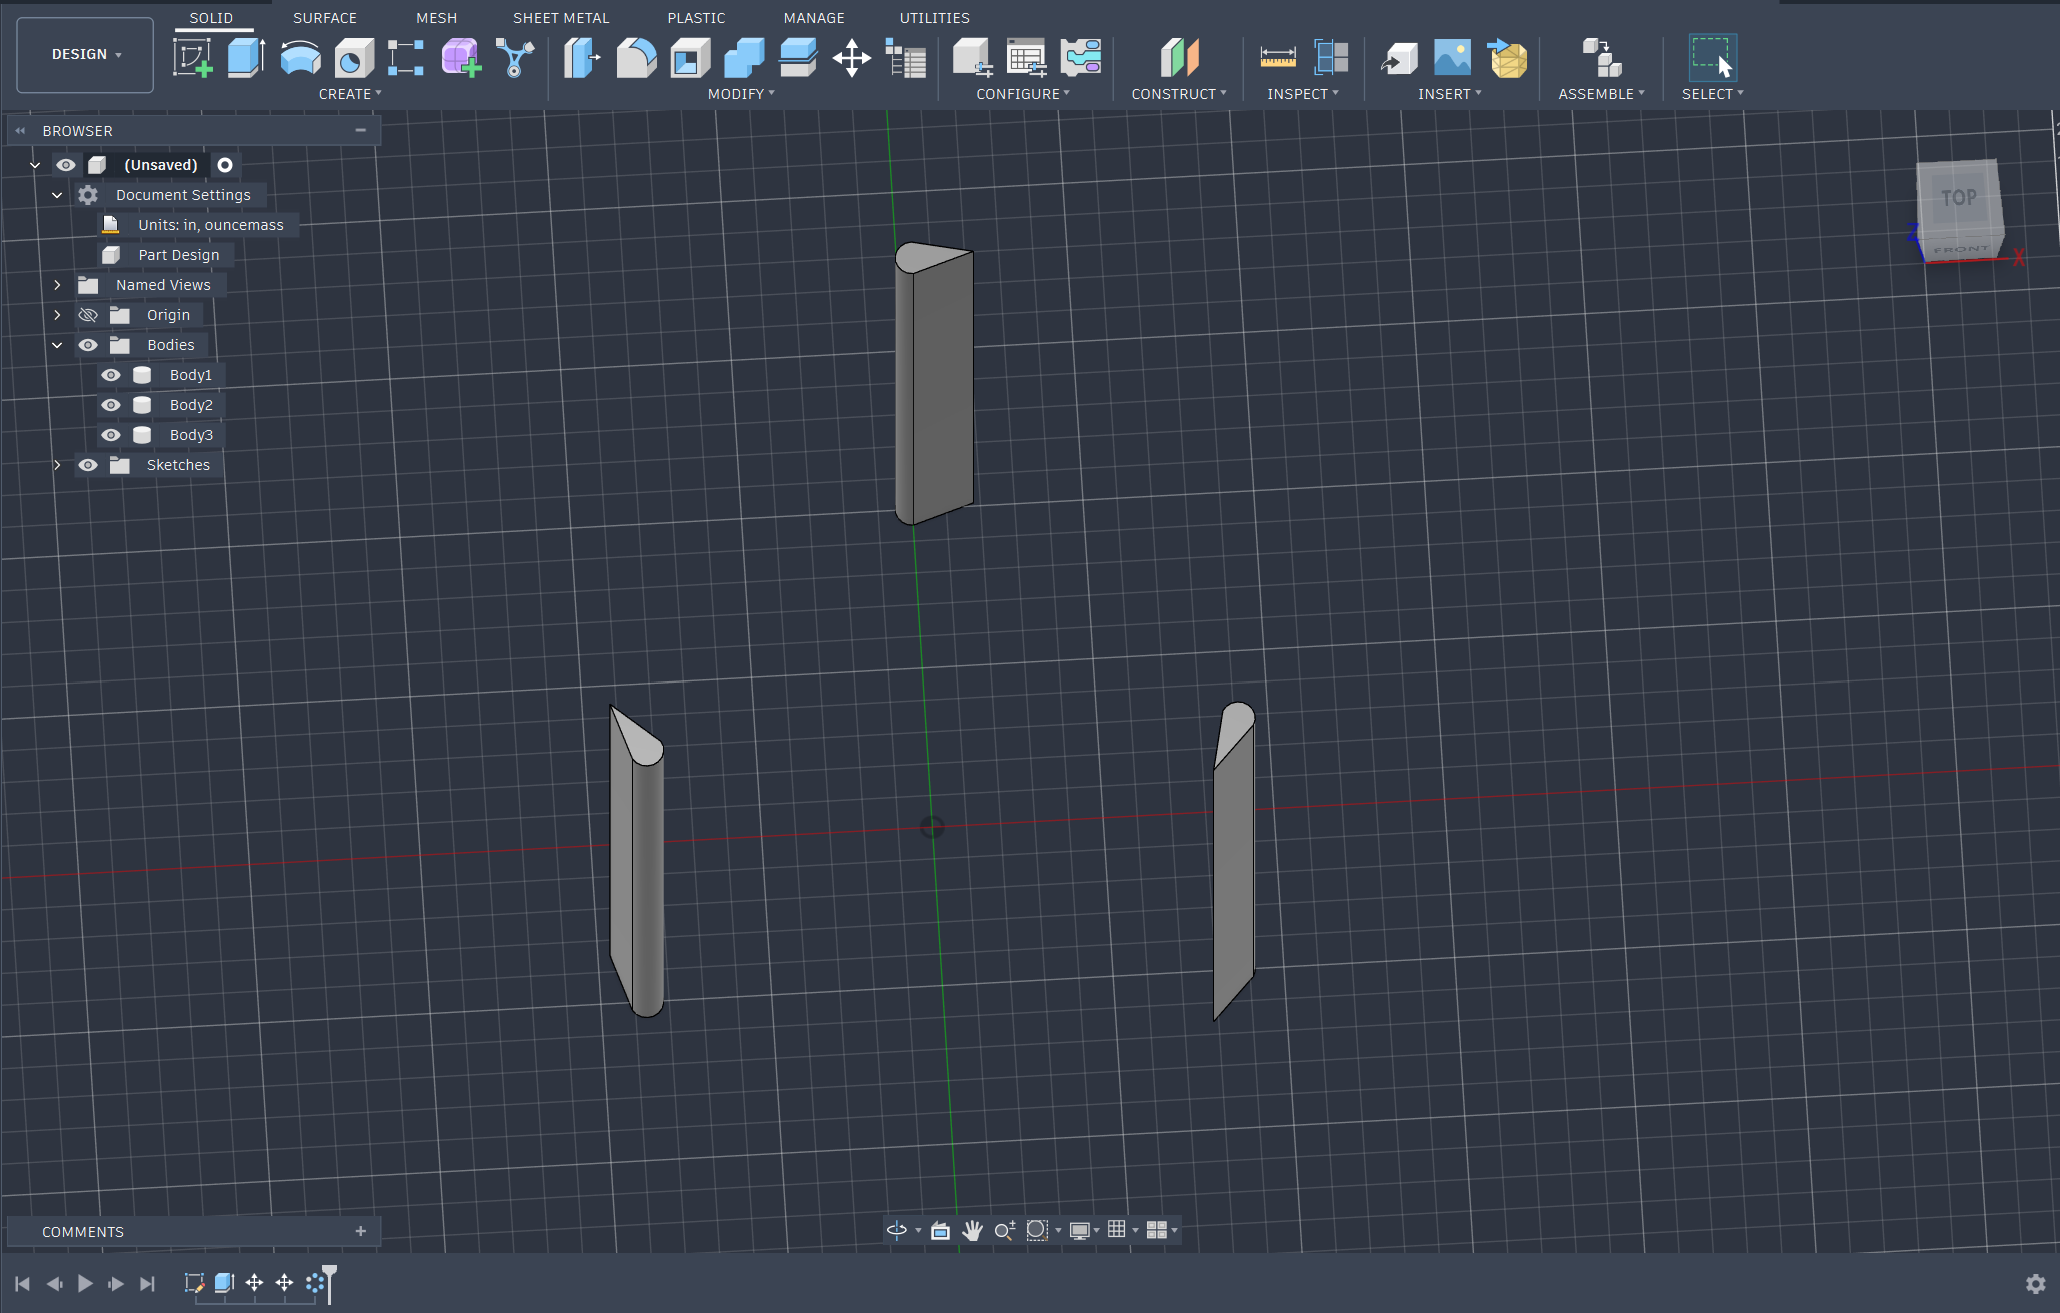
Then simply create a circular pattern to get the desired blades.
Create Ribs
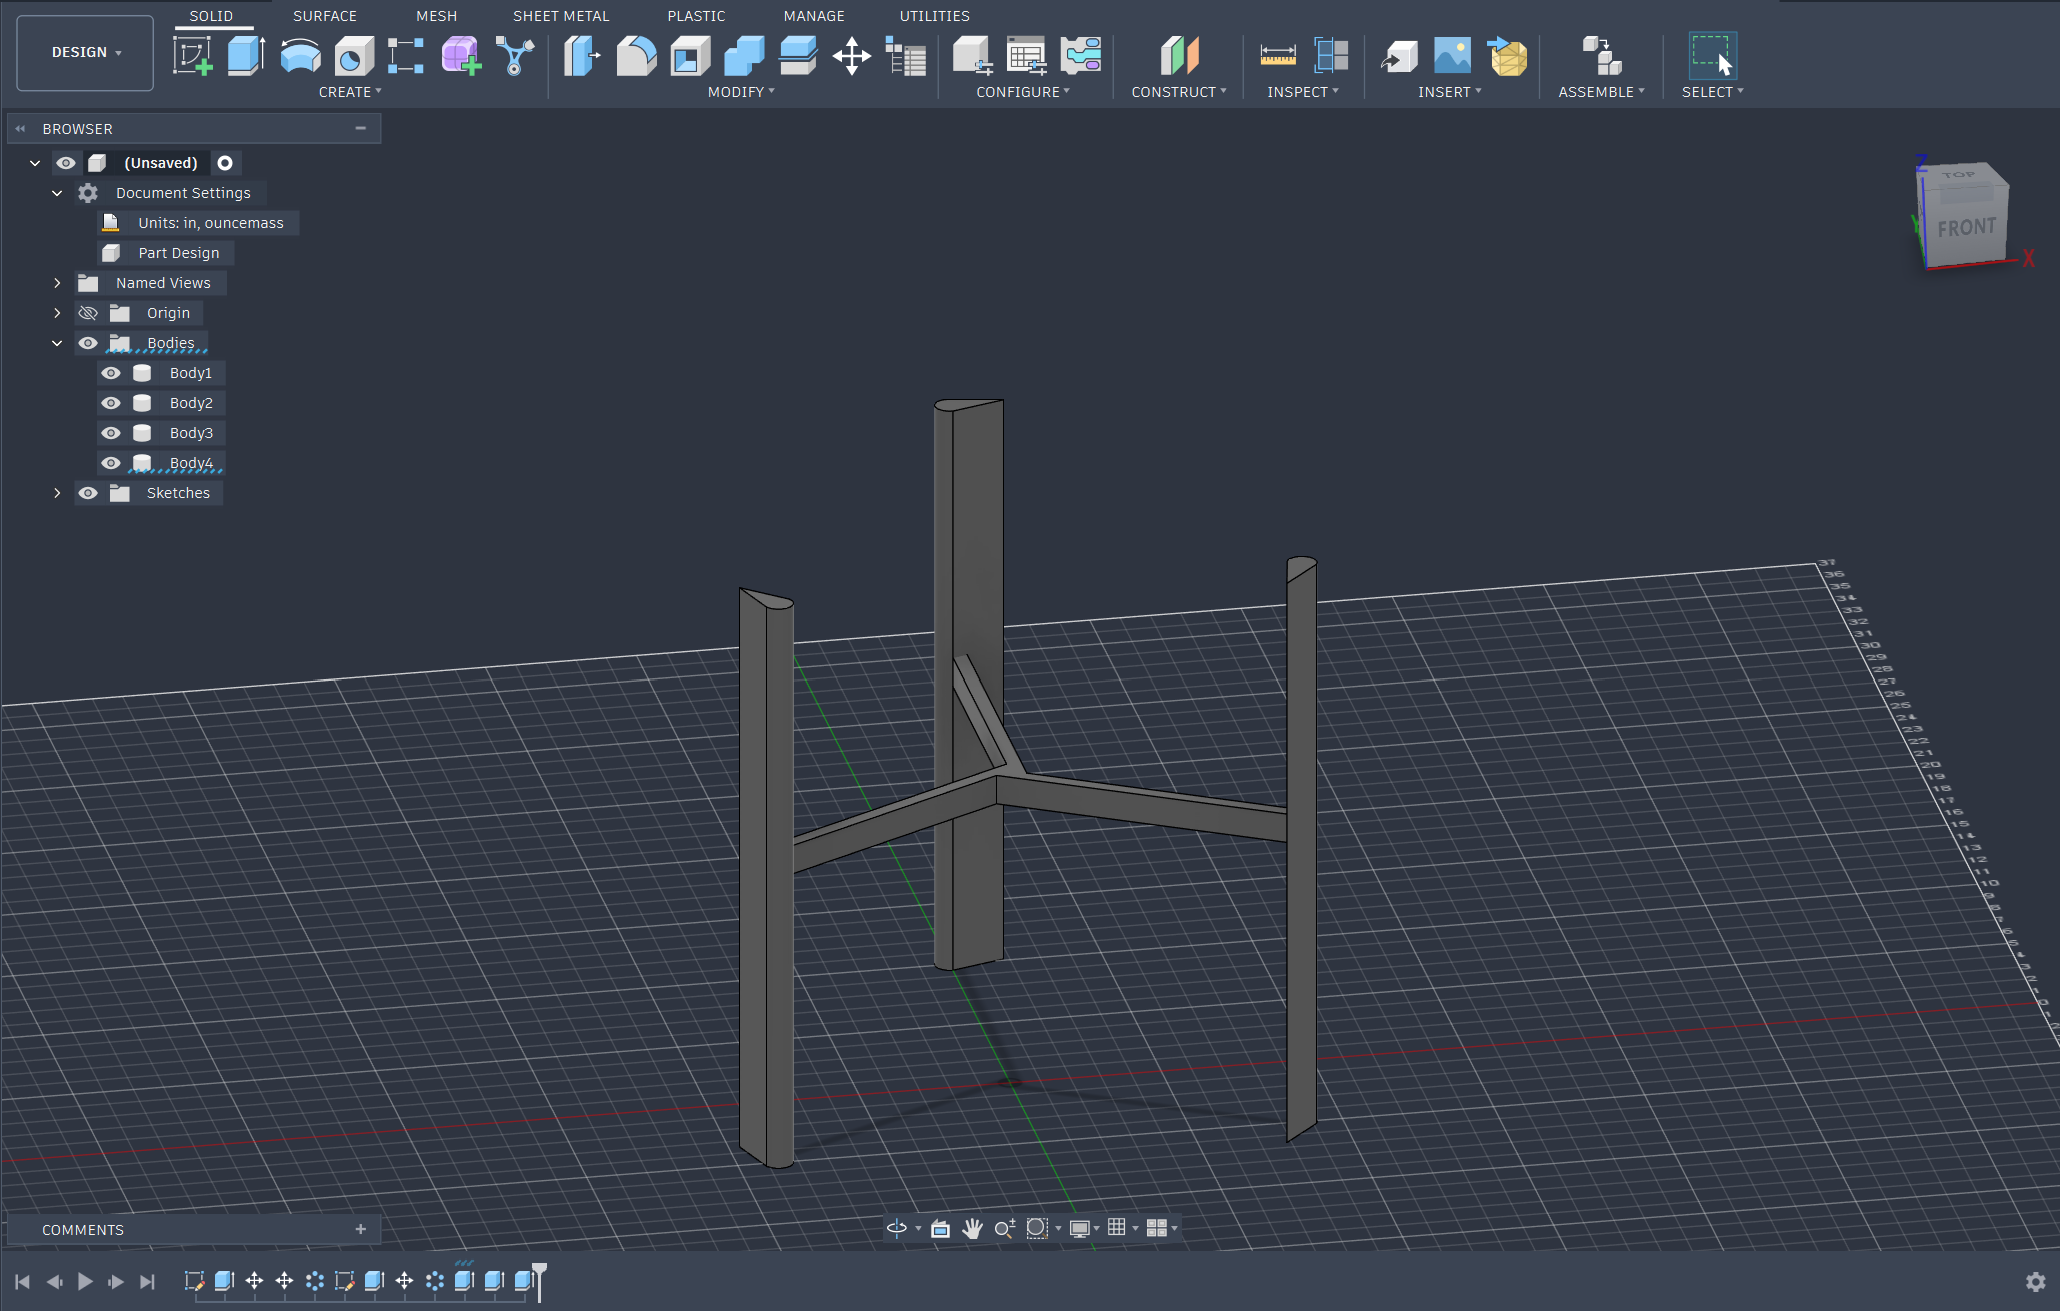
Then simply create the ribs to connect all of the blade together.
Render
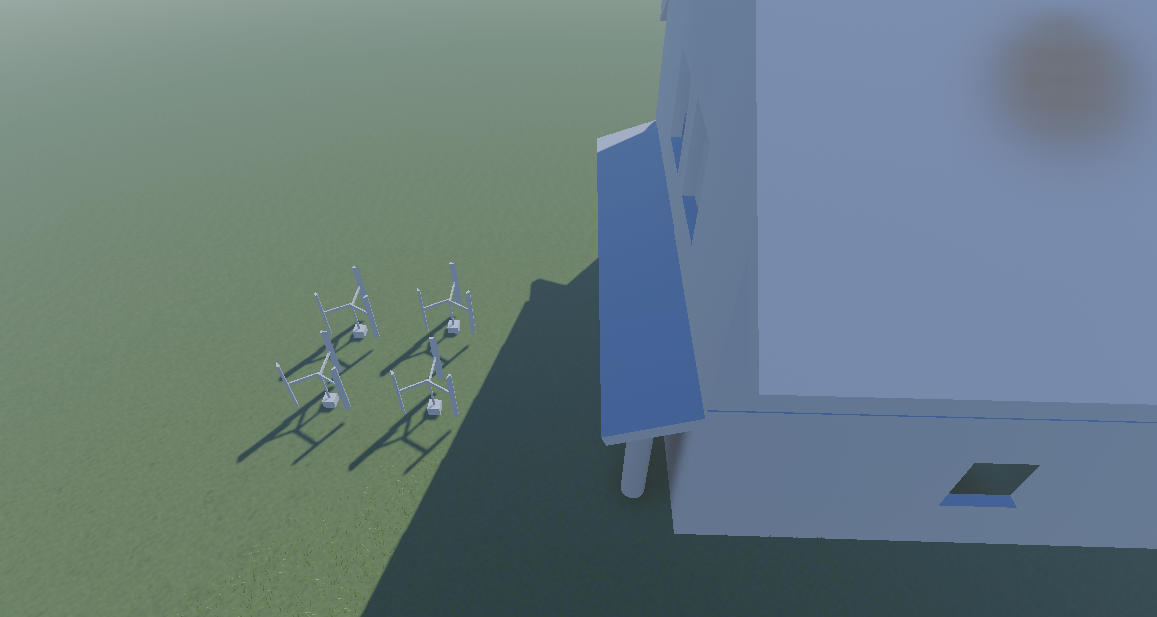
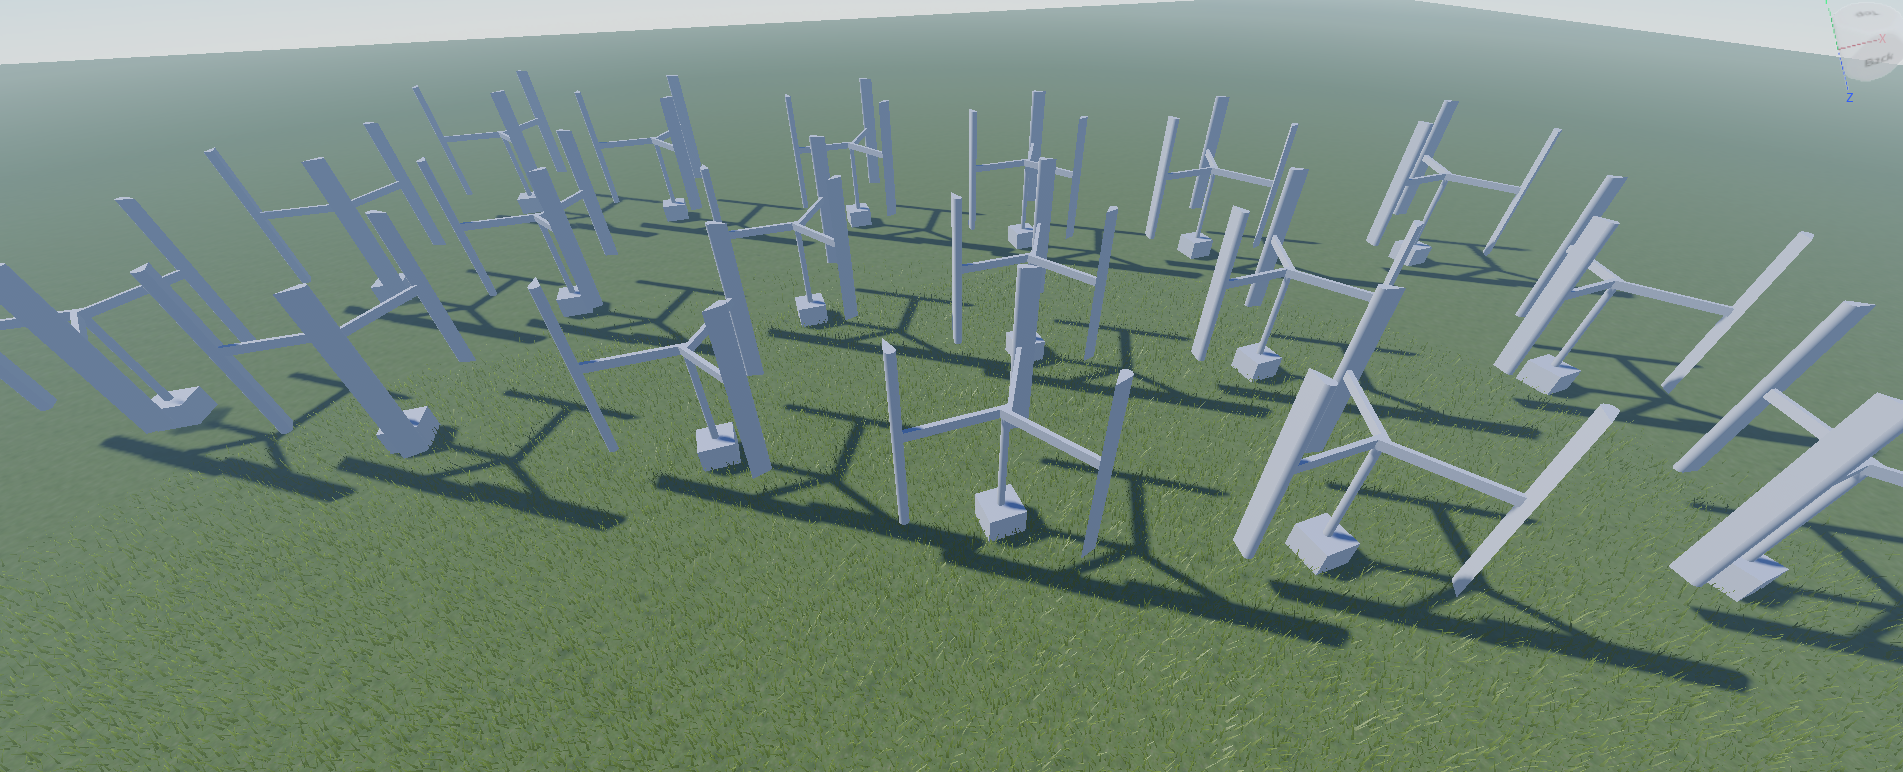
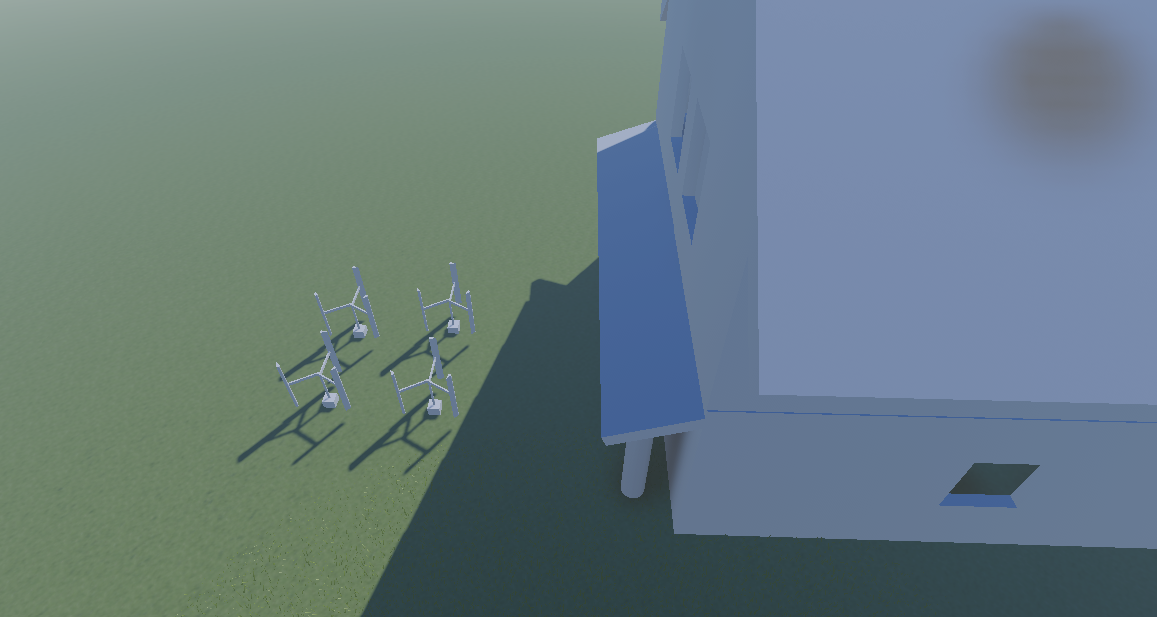
You can then upload it into a renderer to see how it will look and interact with the housing. As you can see it looks pretty good and fits 4 such turbines even in a condominium styled housing.
Power Calculation
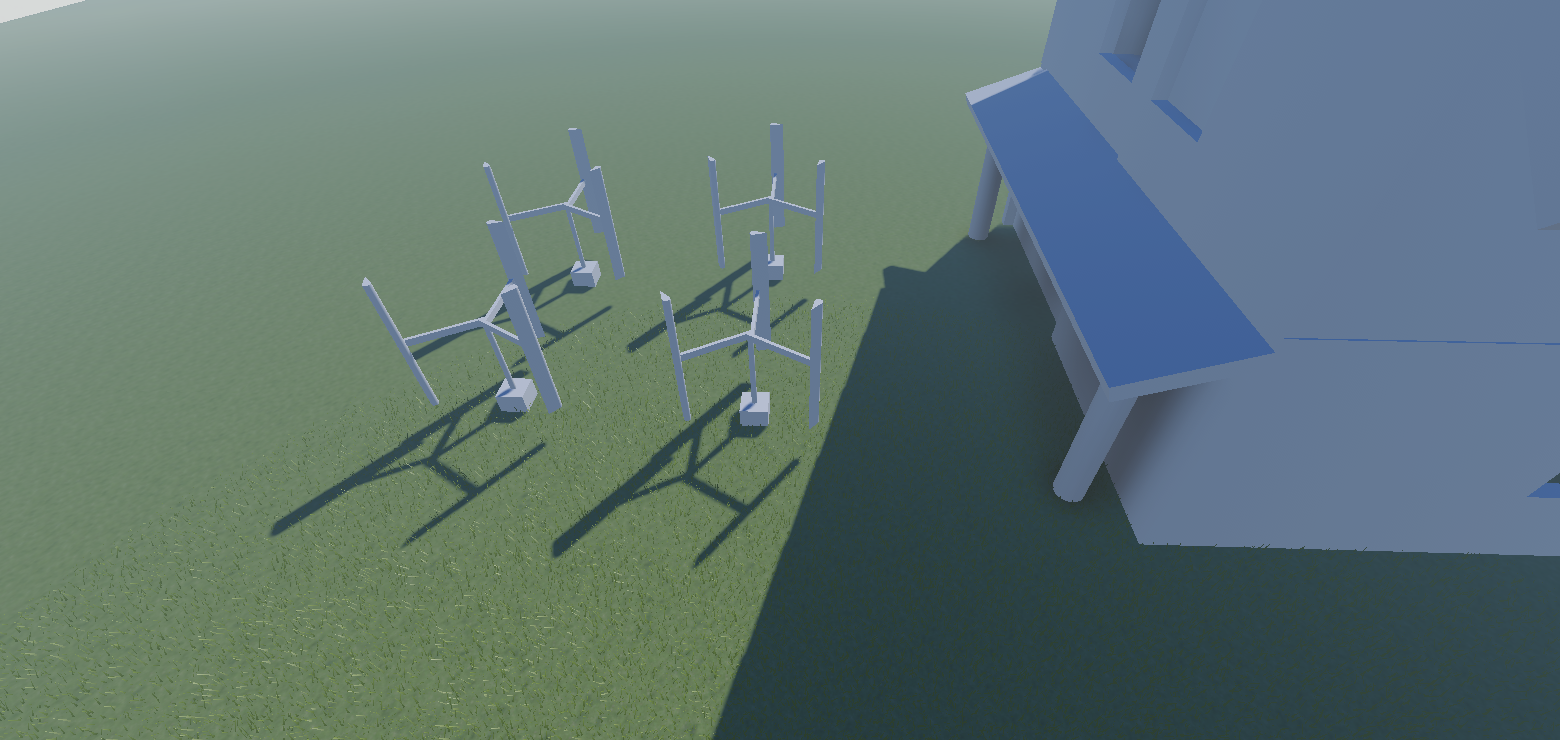
The point of a wind turbine is to generate power, so using the attached algorithm, you can estimate the power generated by the wind turbines.
Configurations
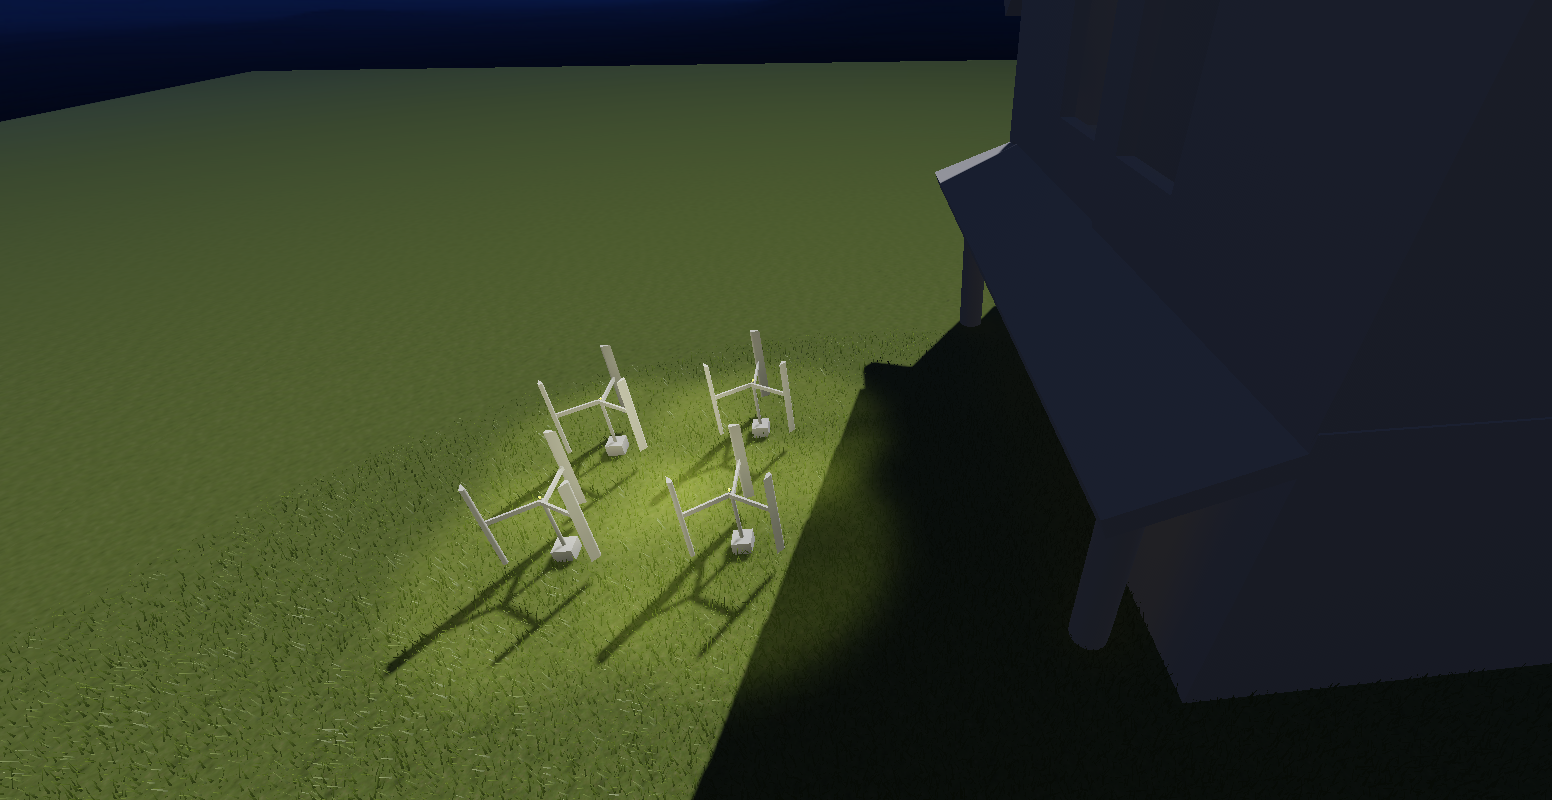
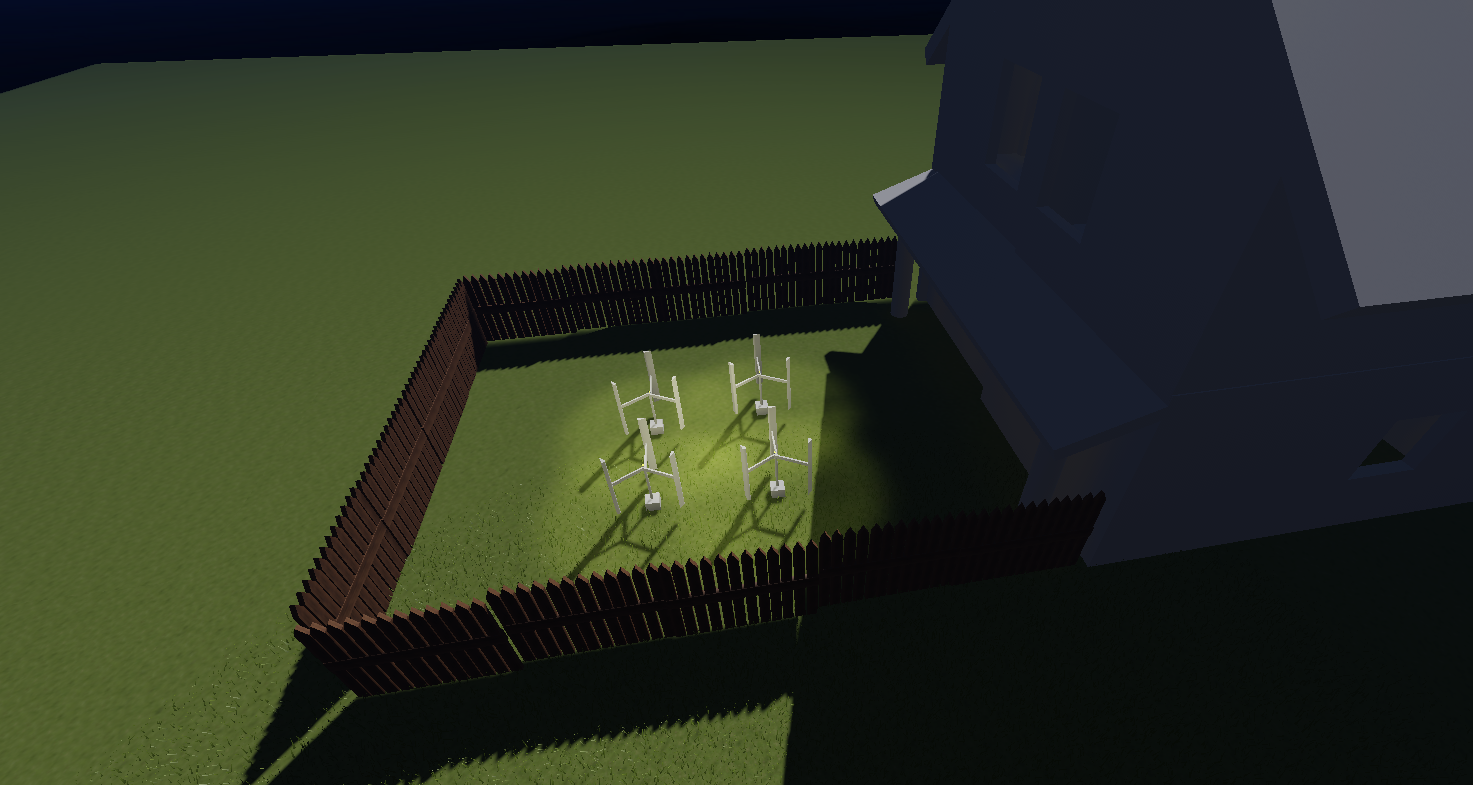
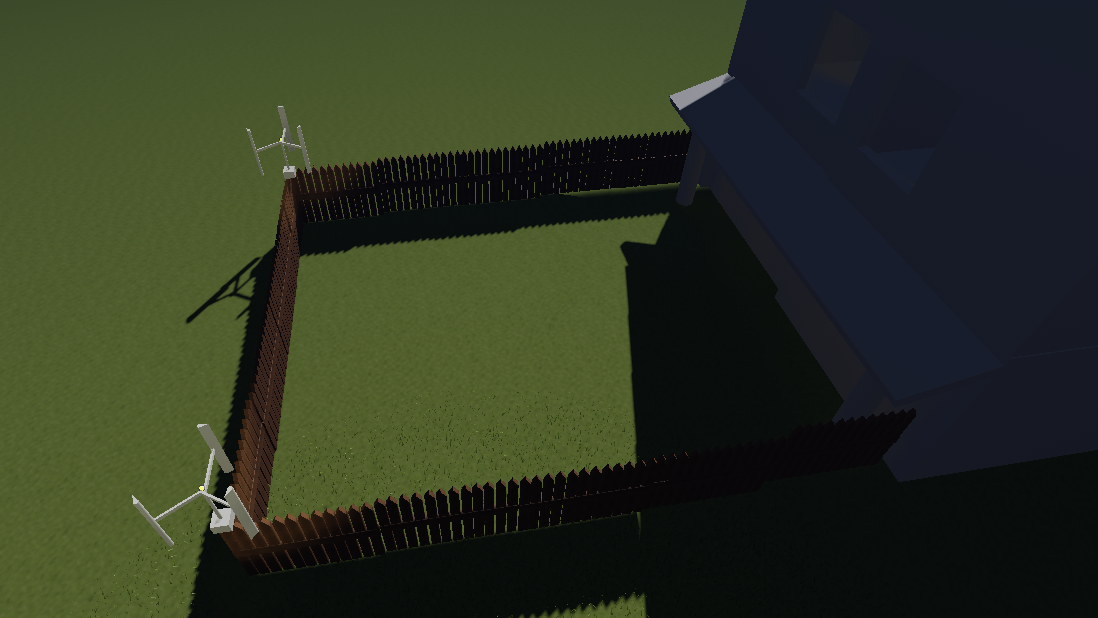
Since they are generally low torque enough to handle lightbulbs, they can further be used as backyard lights. If configured appropriately, they can work as fence lights as well.
Slicing the Model
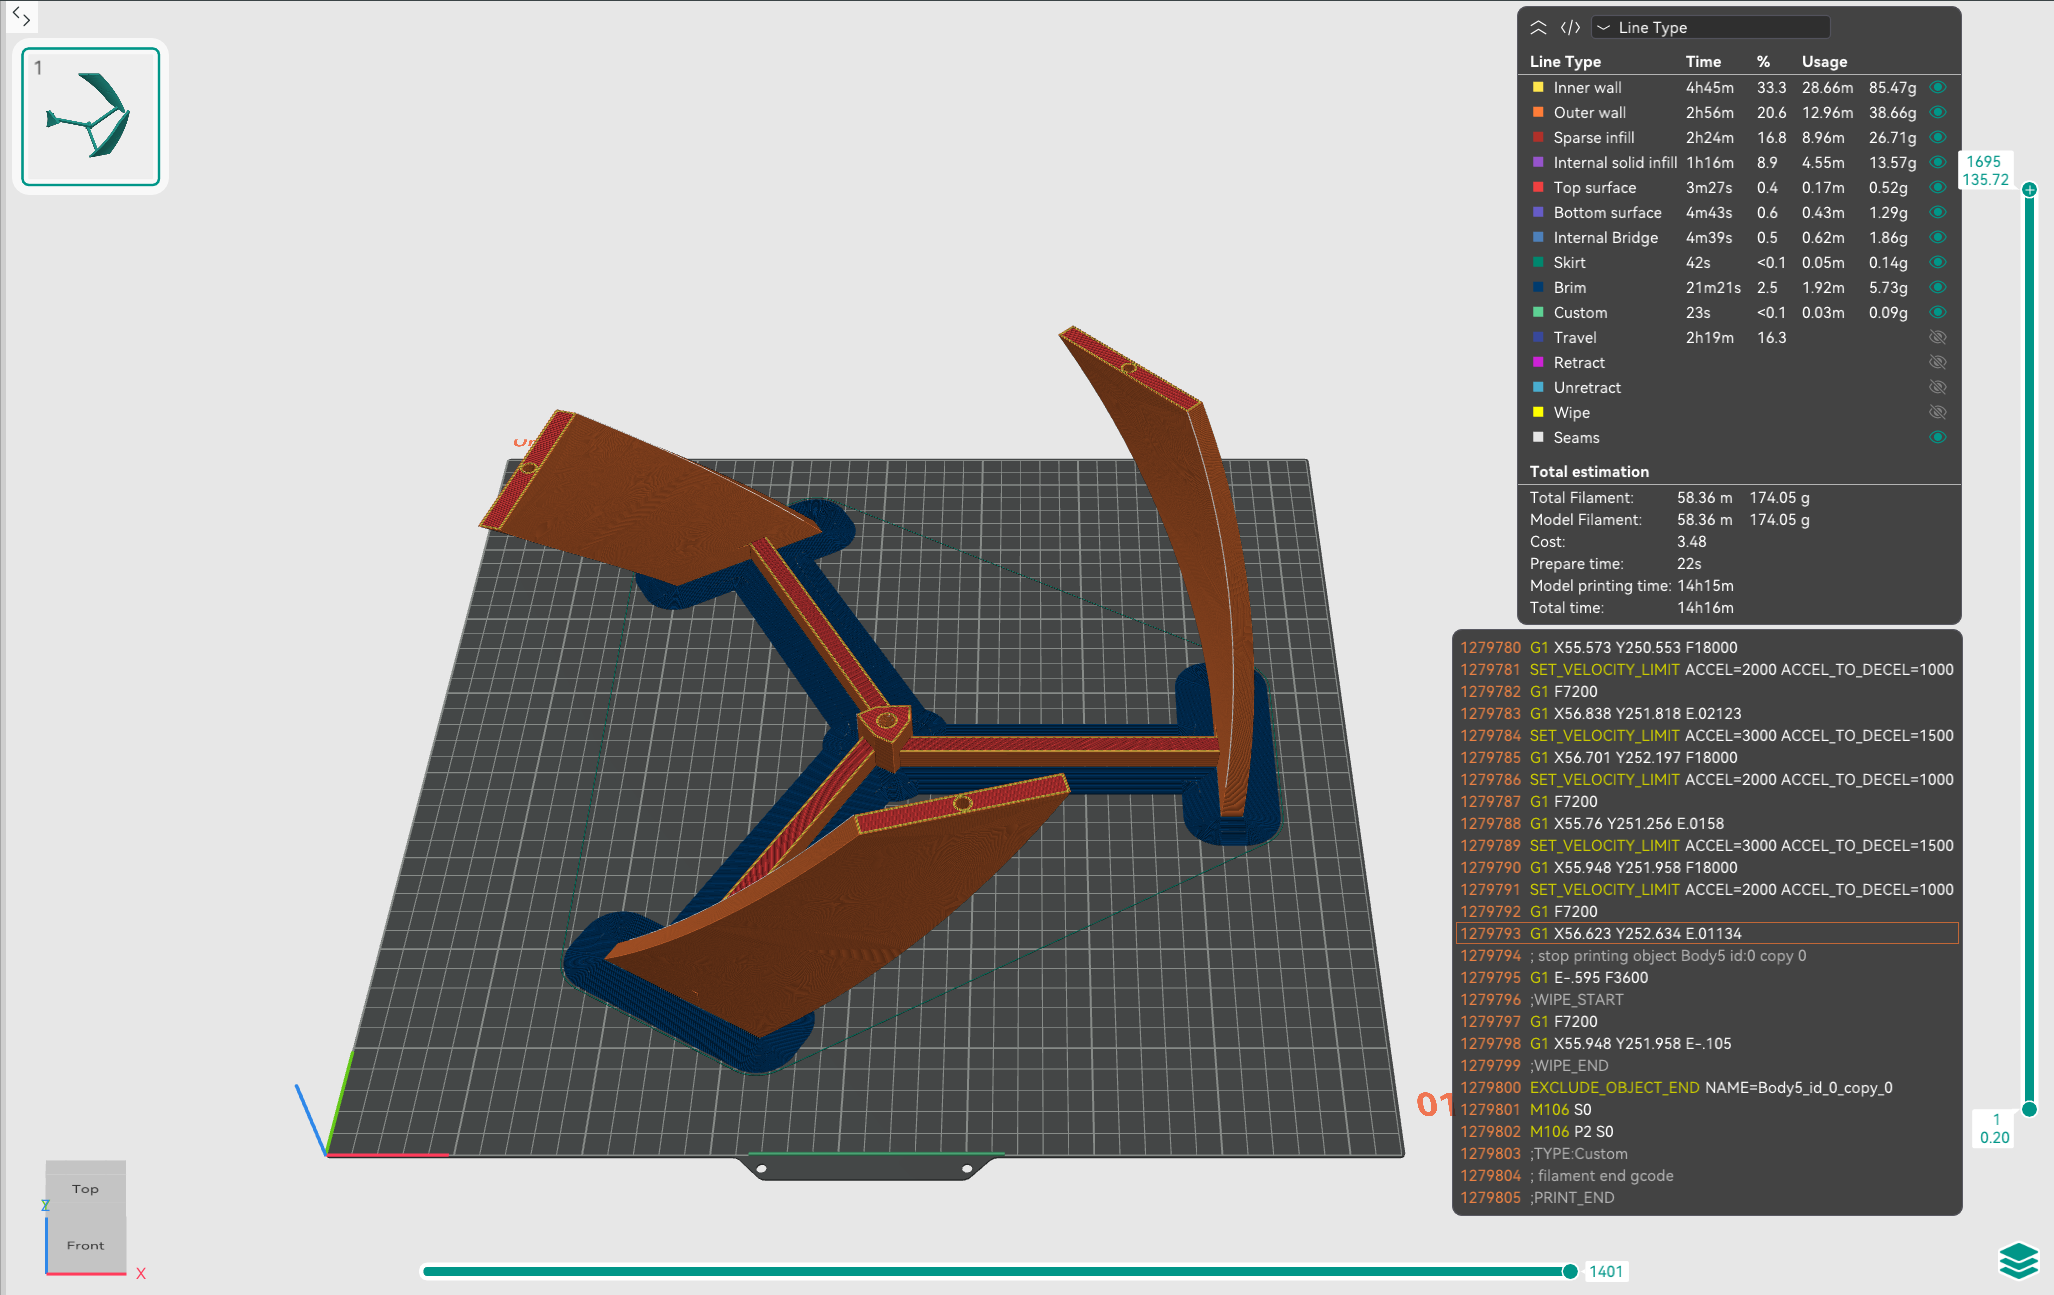
Slicing the models depends greatly on what 3D printer you have and what slicing software you use. Some general advice I would offer is to make sure infill density is between 5-6% on the blades, ~8% on the base, and that the speed is set to medium. I would also recommend printing each part one at a time to ensure that a misprint doesn't waste too much filament.
Moving to the Real World
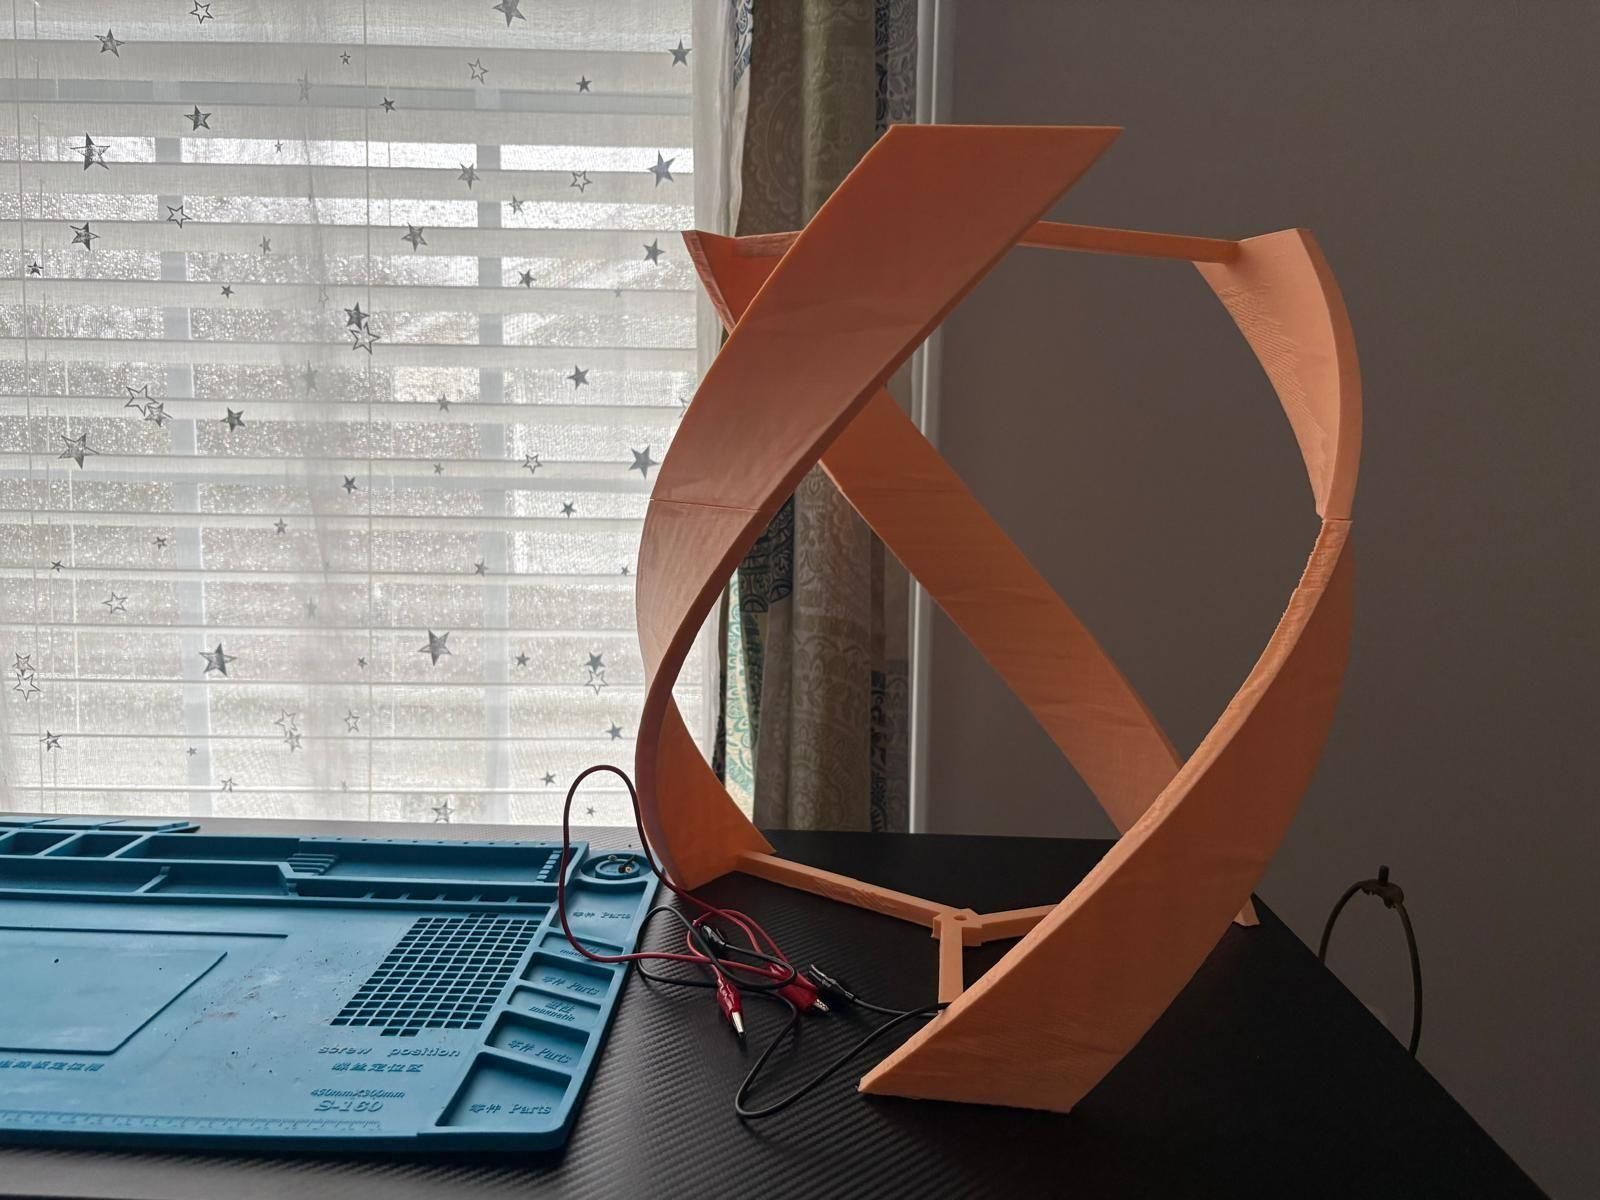
You can then 3D print your blade designs (make sure to use a sun-resistant material) to actually generate wind energy off grid.
Disclaimer: This project pictured is an old project of mine specifically about building a turbine, but it serves to show that a 3D printed wind turbine made in Fusion360 can generate power. If you follow these instructions to develop an optimized turbine, it will generate much more power than my old design, since I didn't have enough knowledge about proper turbine design principles at the time.
Generating Power
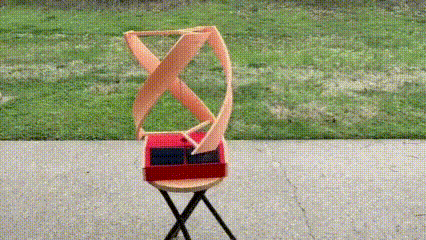
You can then take your wind turbine outside and test the wind energy it produces.
Afterword
If you have stuck around with this tutorial up to this point, I want to congratulate you. This was definitely not an easy instructable to make, so it must have indeed been hard to follow. If you did manage to make it thus far, you will have a strong understanding of Multi Objective Surrogate Based Optimization.