Visualize Your CSV Data
by Upside Down Labs in Circuits > Sensors
194 Views, 0 Favorites, 0 Comments
Visualize Your CSV Data
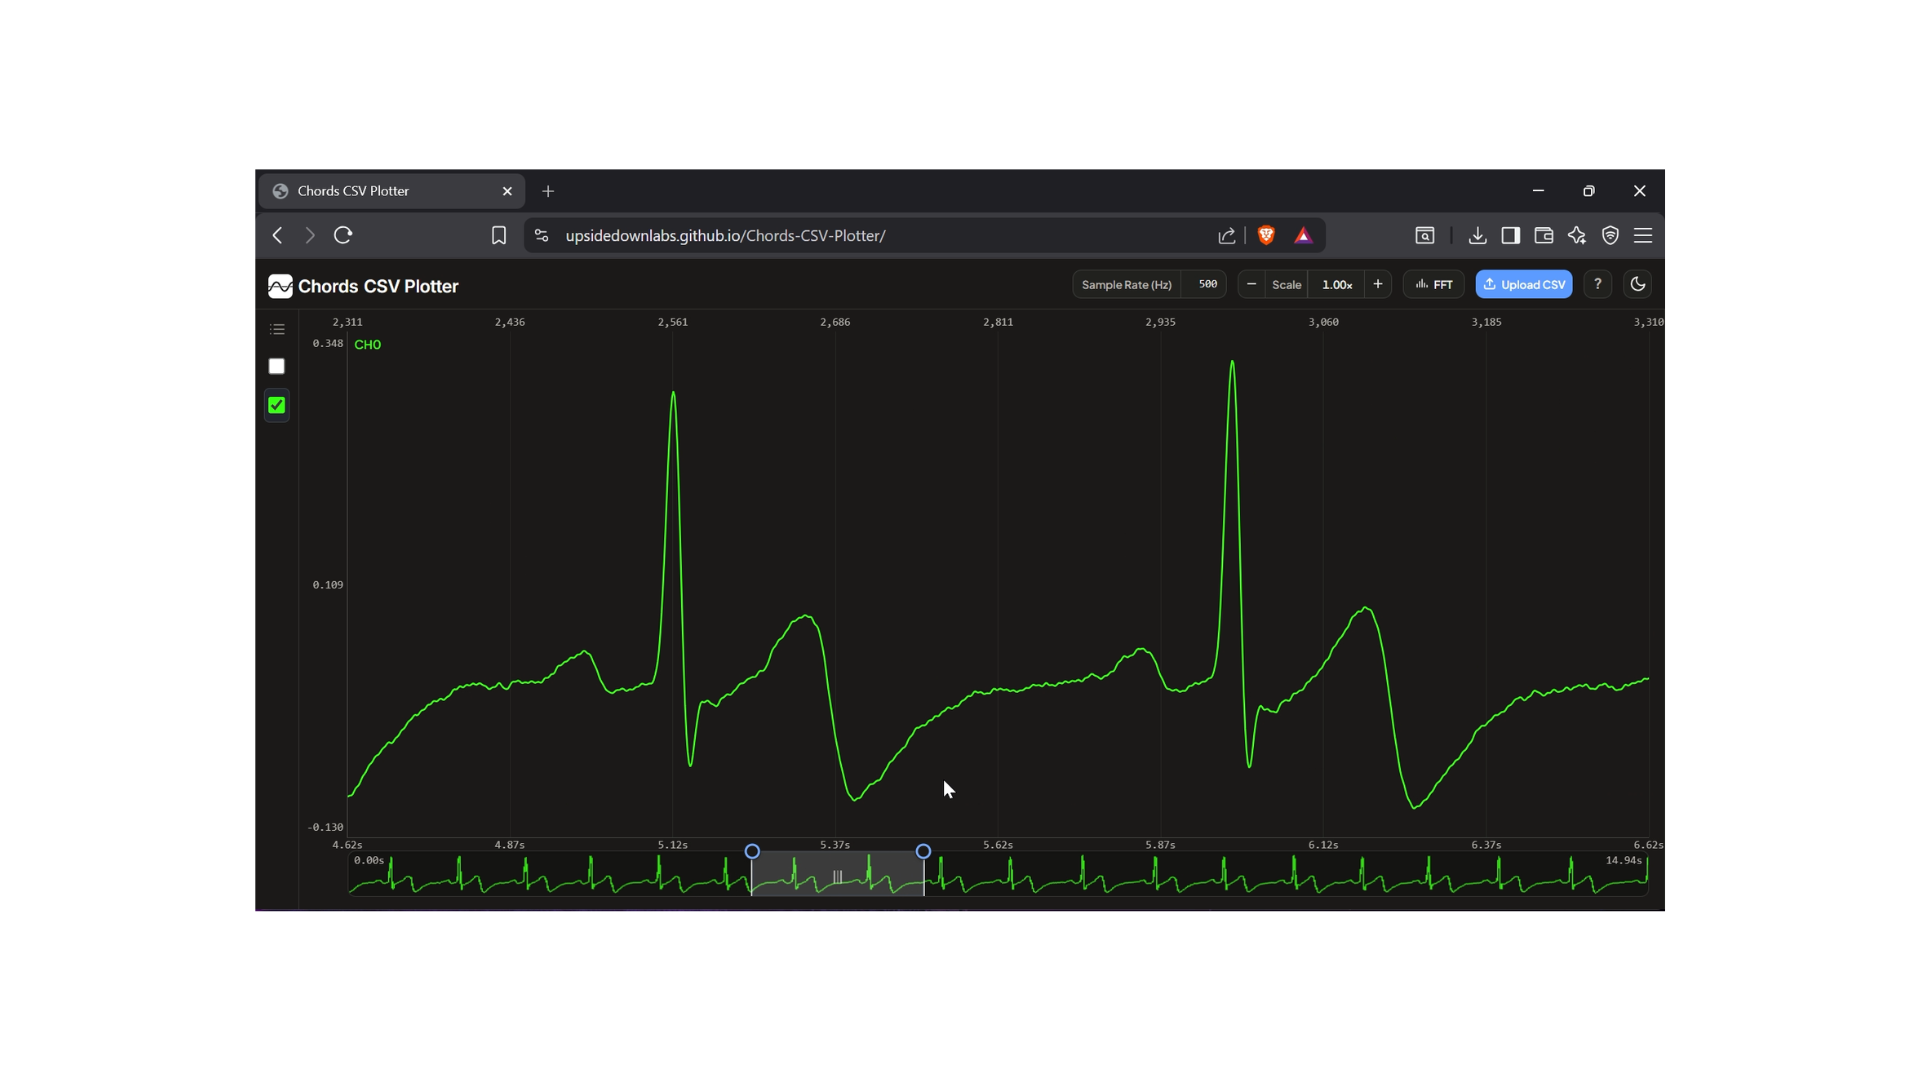
Chords CSV Plotter is a simple browser-based tool for visualizing and analyzing time-series CSV data. It is designed to help you view recordings from Chords software directly in your browser, without needing any extra software.
In this Instructable, you will learn how to open the plotter, upload your data, navigate through recordings, and use the FFT Viewer to explore frequency content.
Supplies
You'll need:
- A laptop
- A time-series CSV file (such as EEG, EMG, ECG, EOG, or IMU data)
- Chords CSV Plotter
NOTE: Note: If you don't already have a CSV recording, first learn how to record and export data from Chords. You can follow the complete tutorial here:
https://www.youtube.com/watch?v=cbAZcs6EuHI&t=79s
Open the Chords CSV Plotter
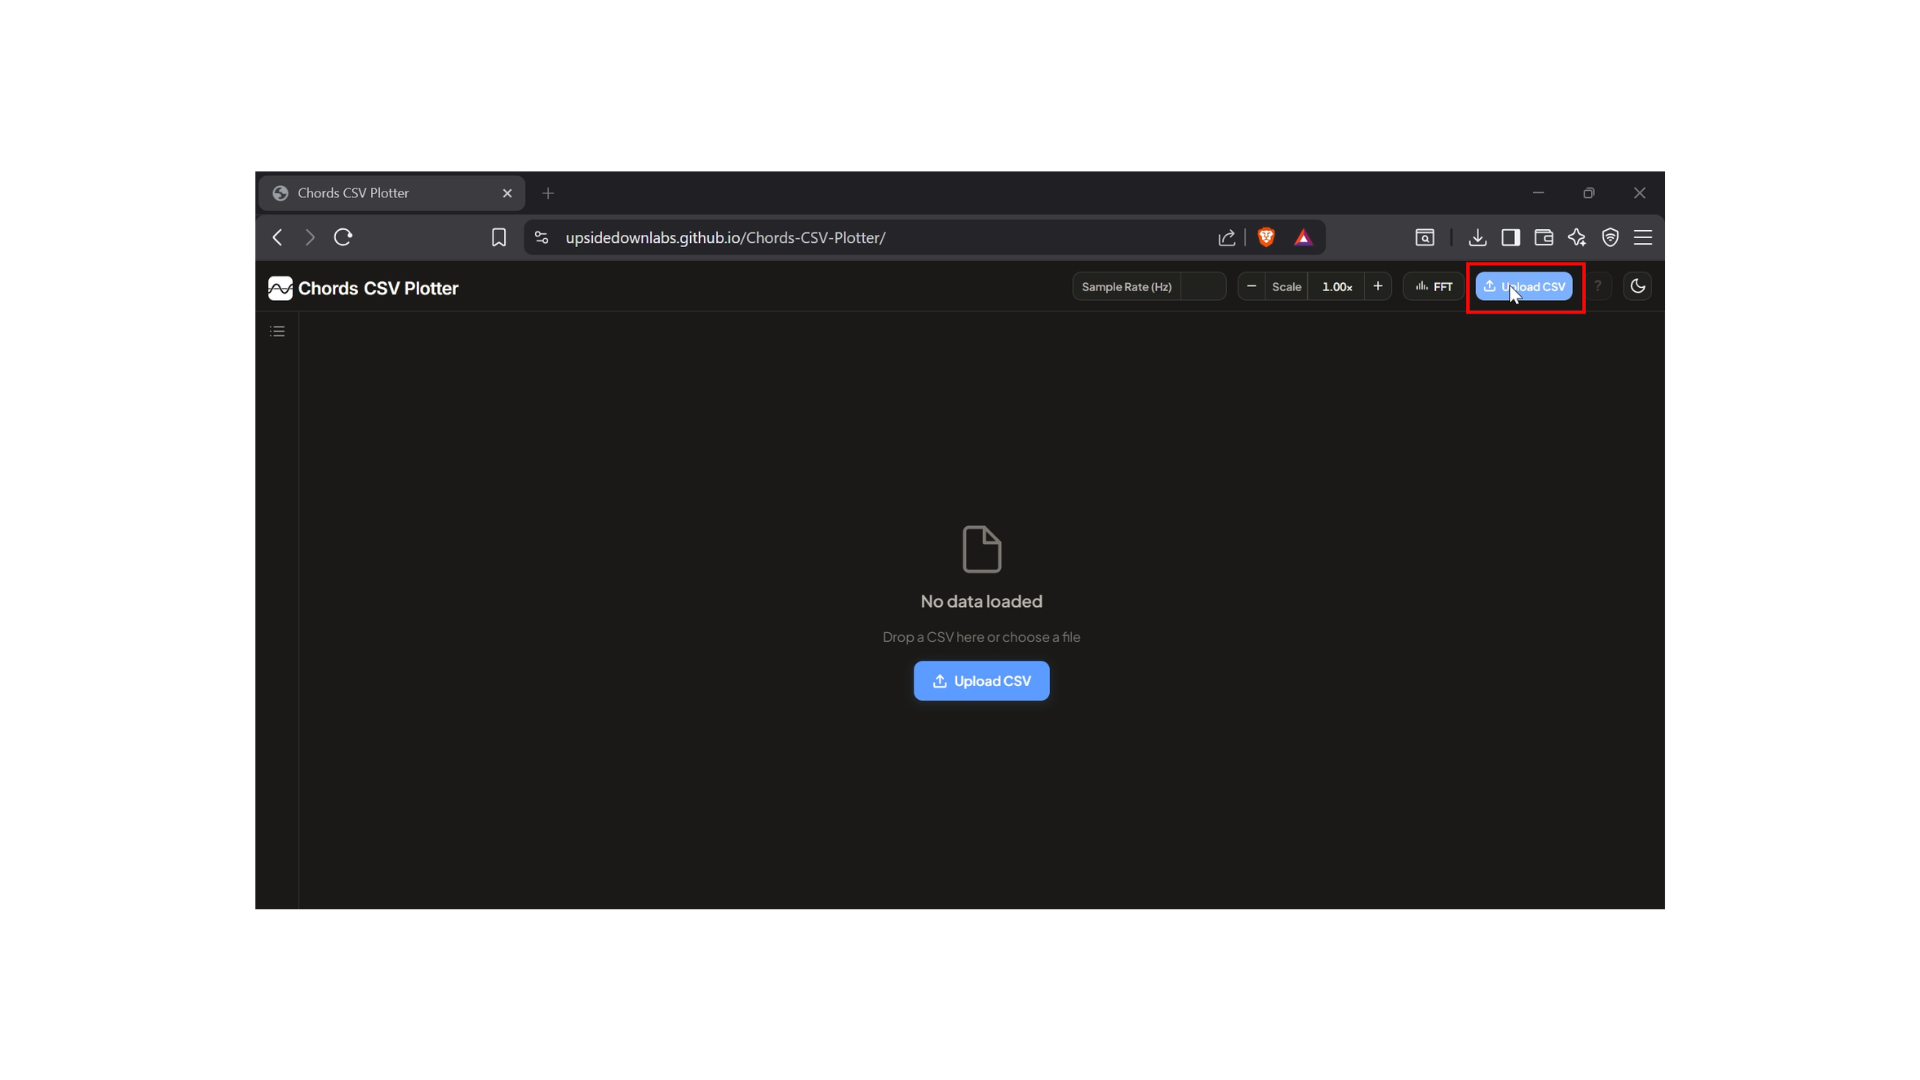
Open the Chords CSV Plotter in your web browser.
The first time you upload a CSV file, the tool will show a short interactive tour explaining the main features.
Upload Your CSV File
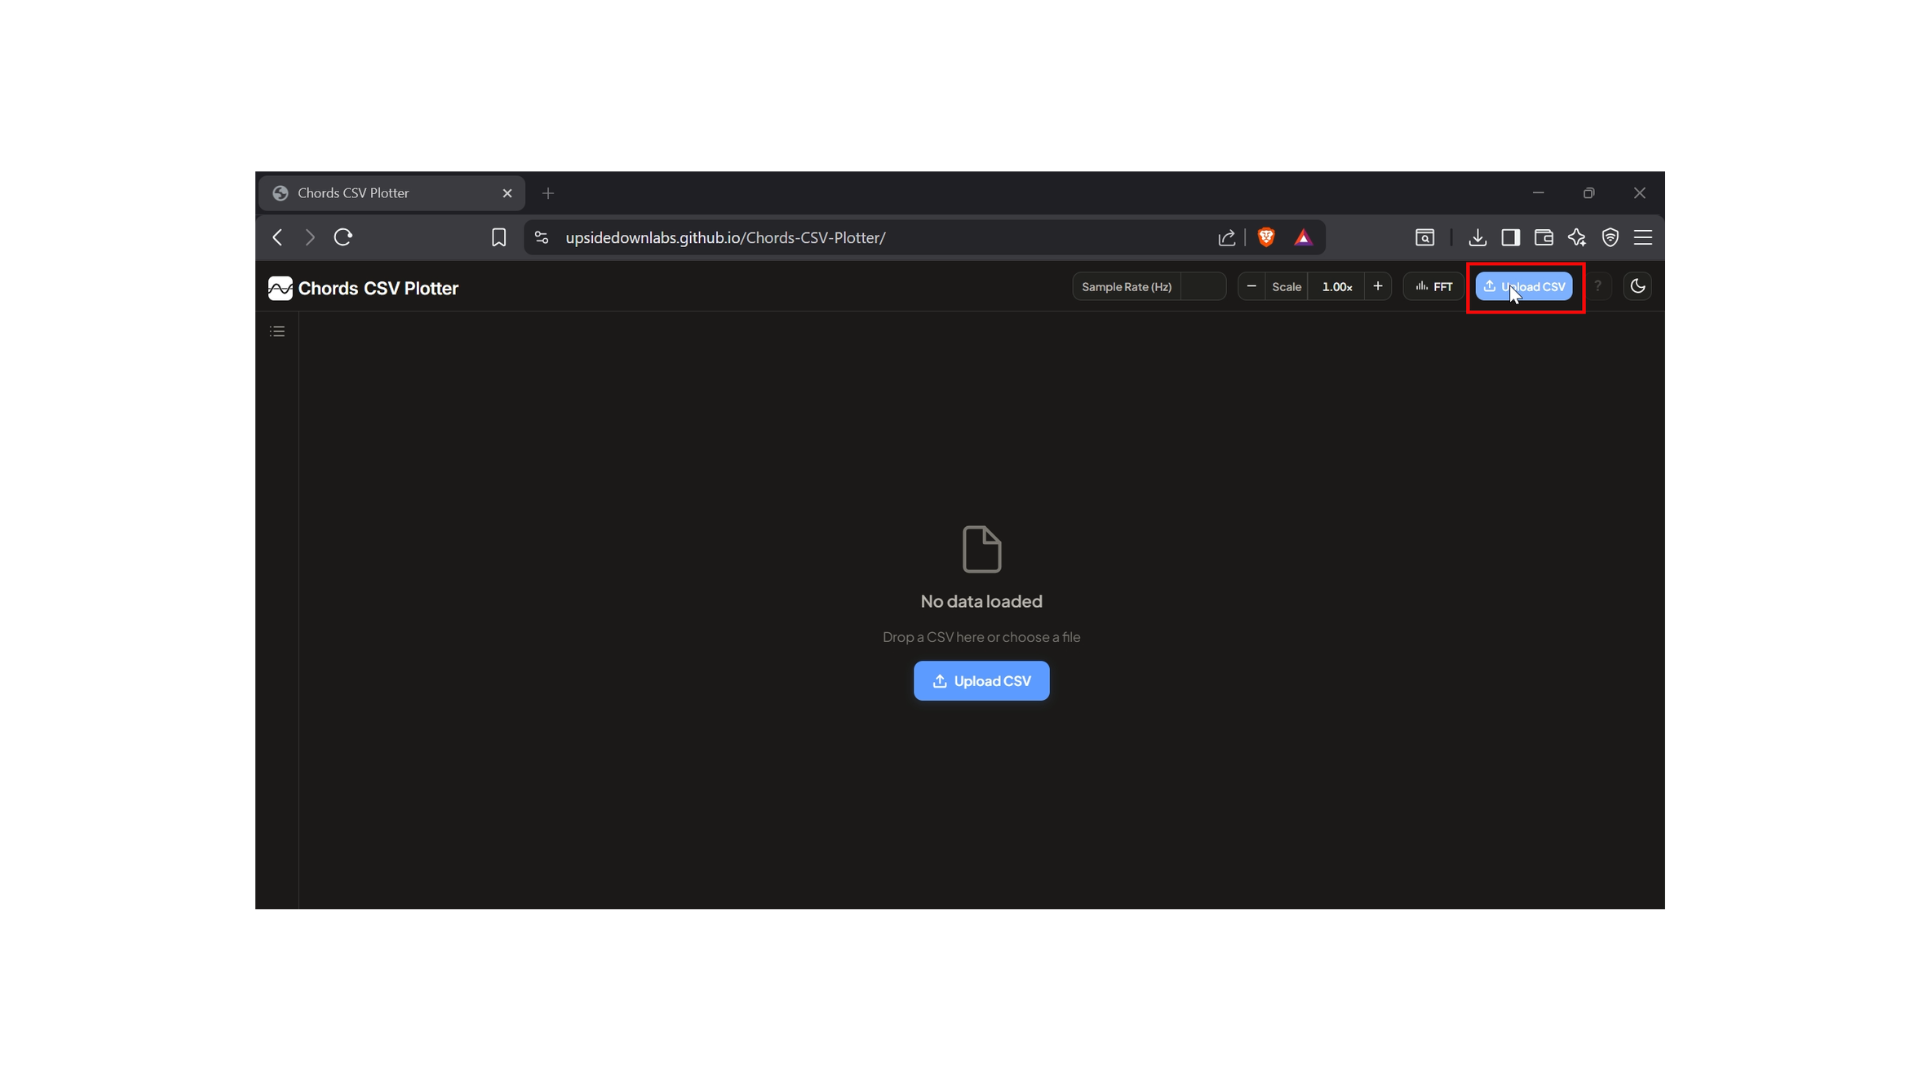
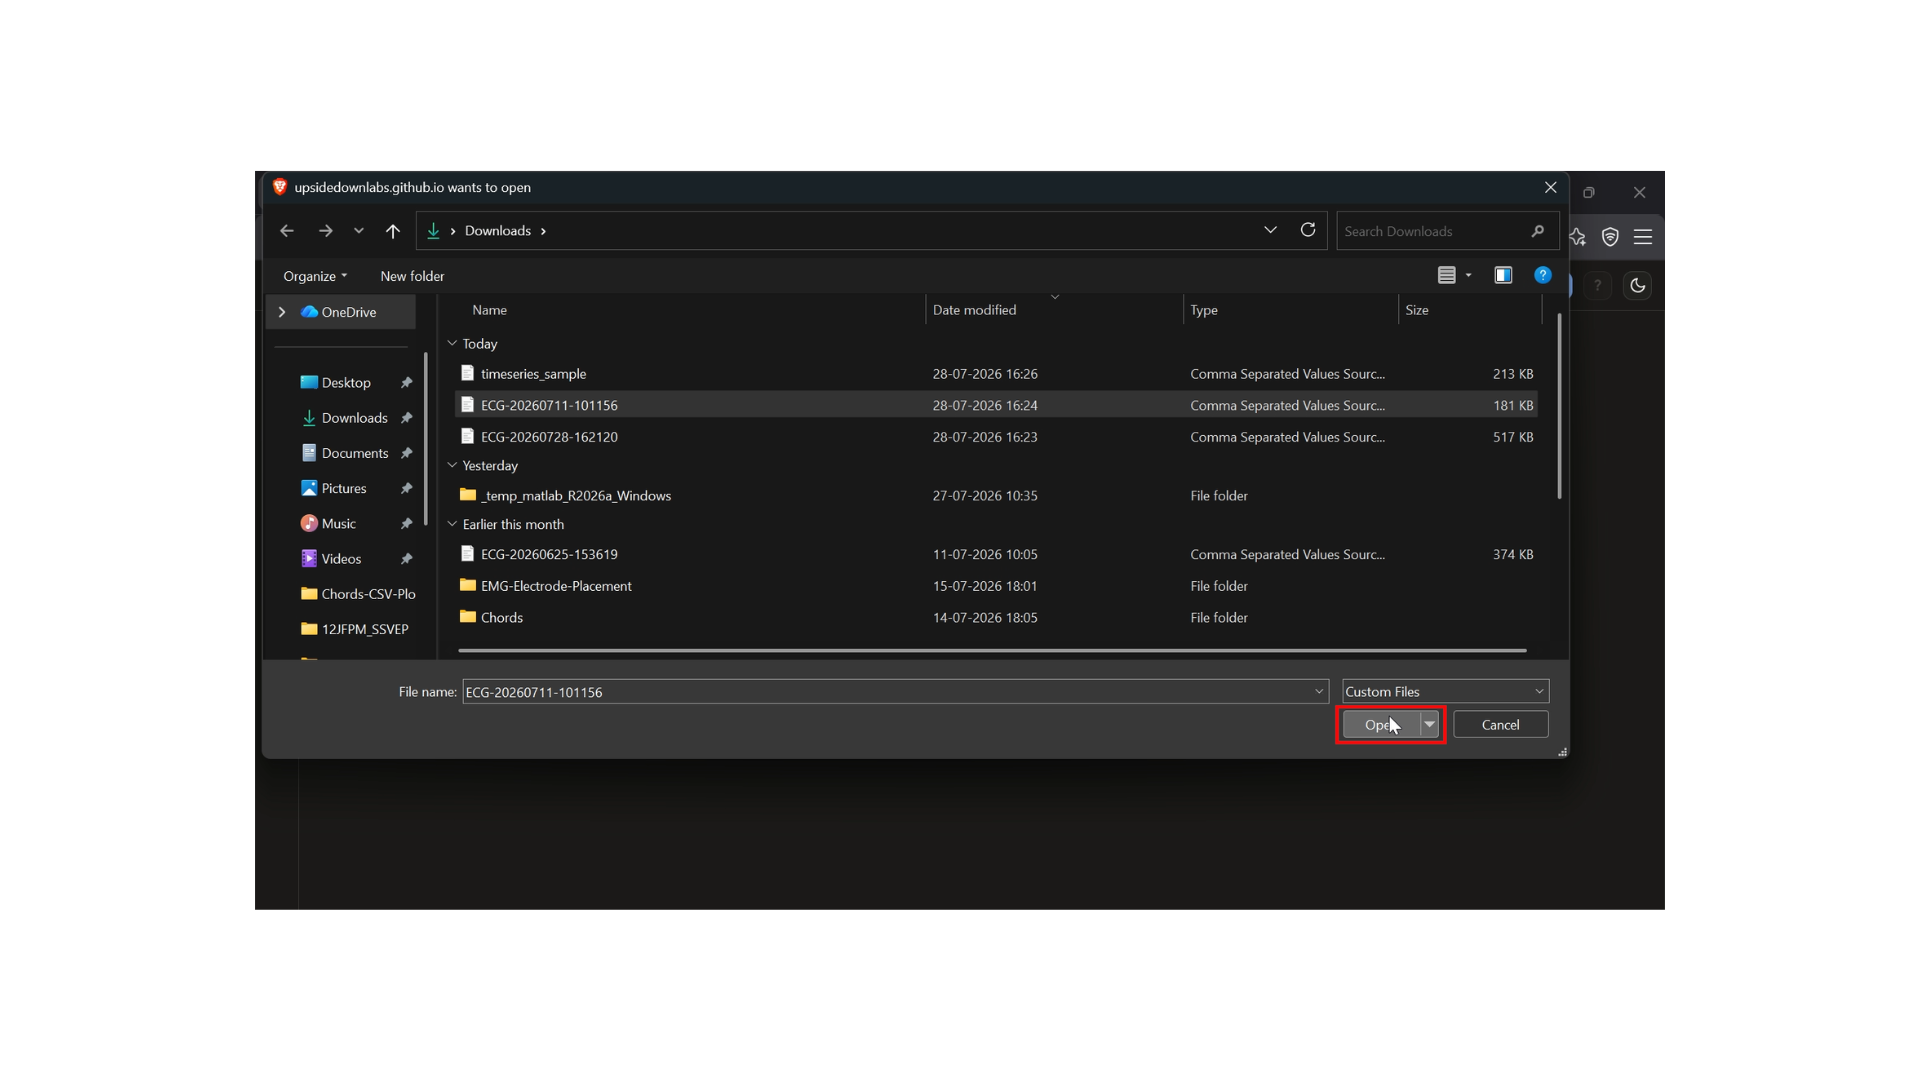
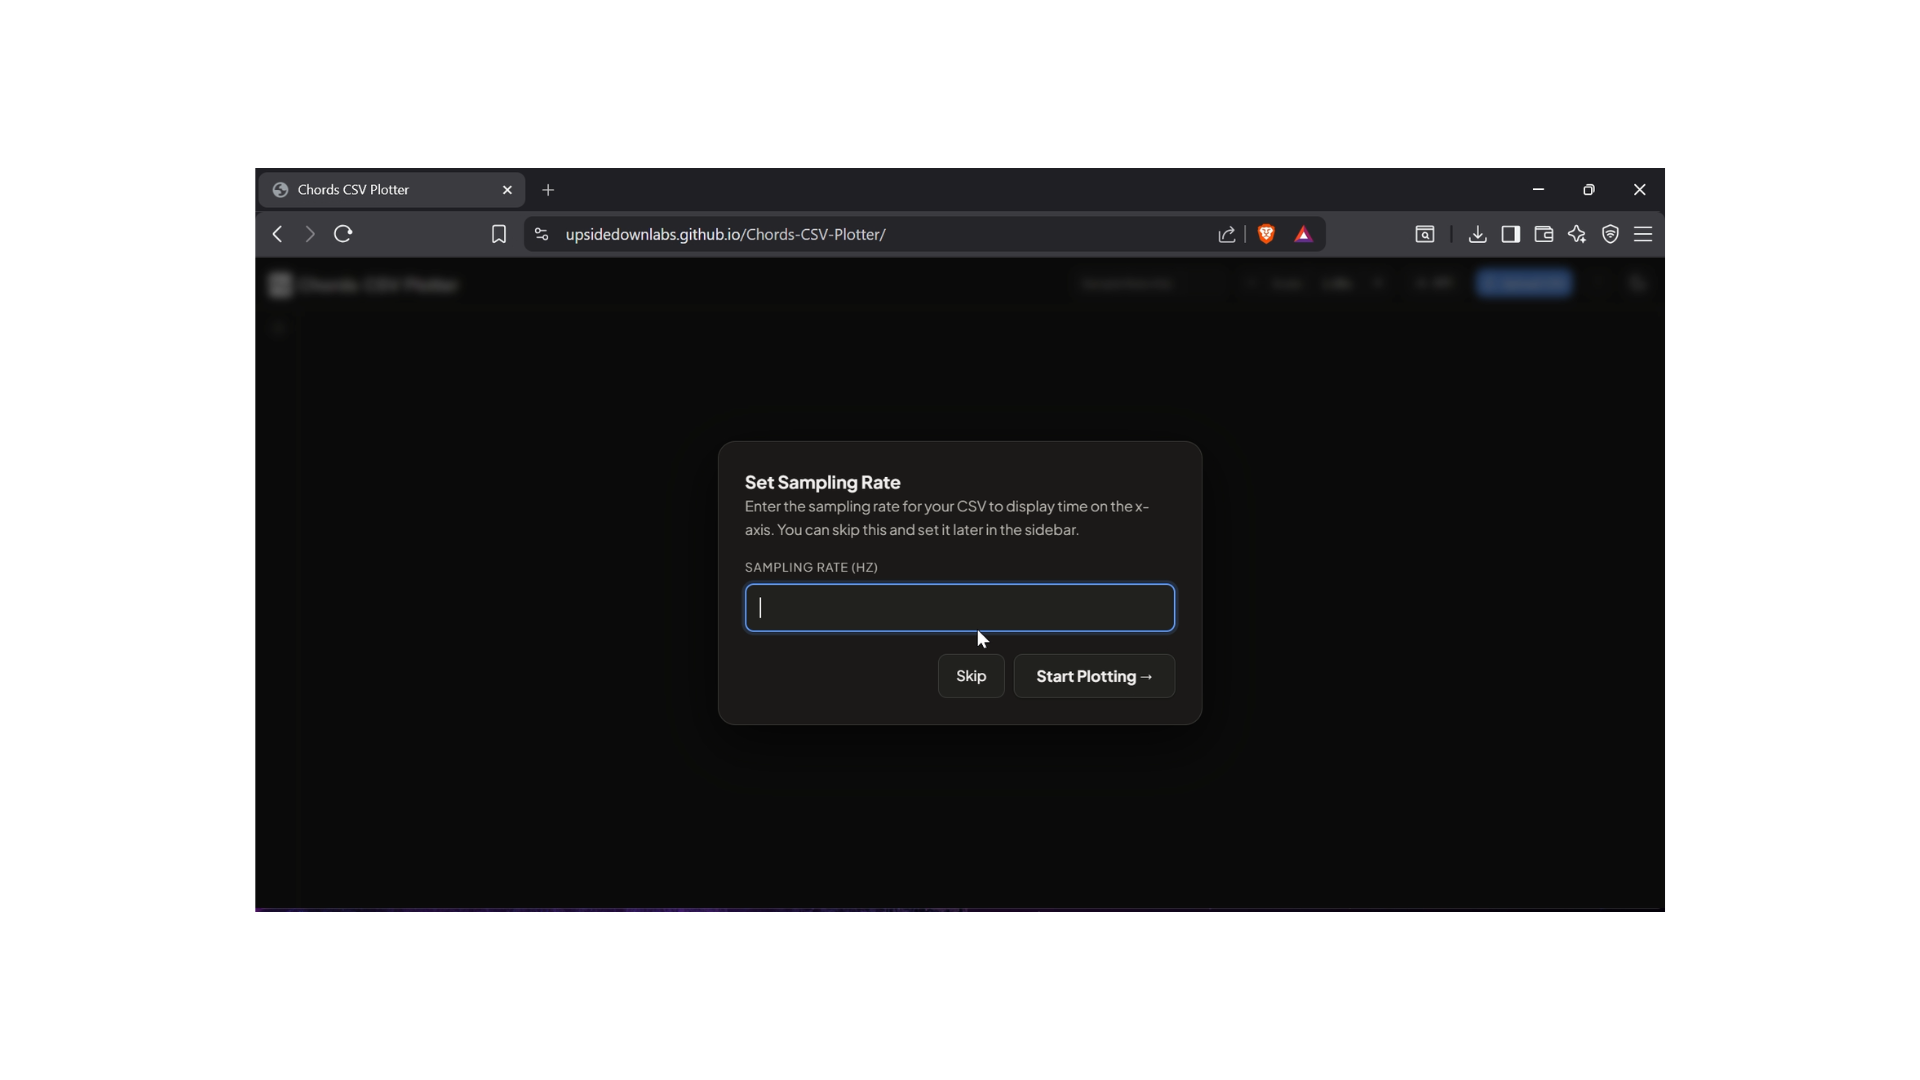
Click the Upload button and choose your time-series CSV file.
Once the file is uploaded, the tool loads your data and prepares it for visualization.
Explore the Interface
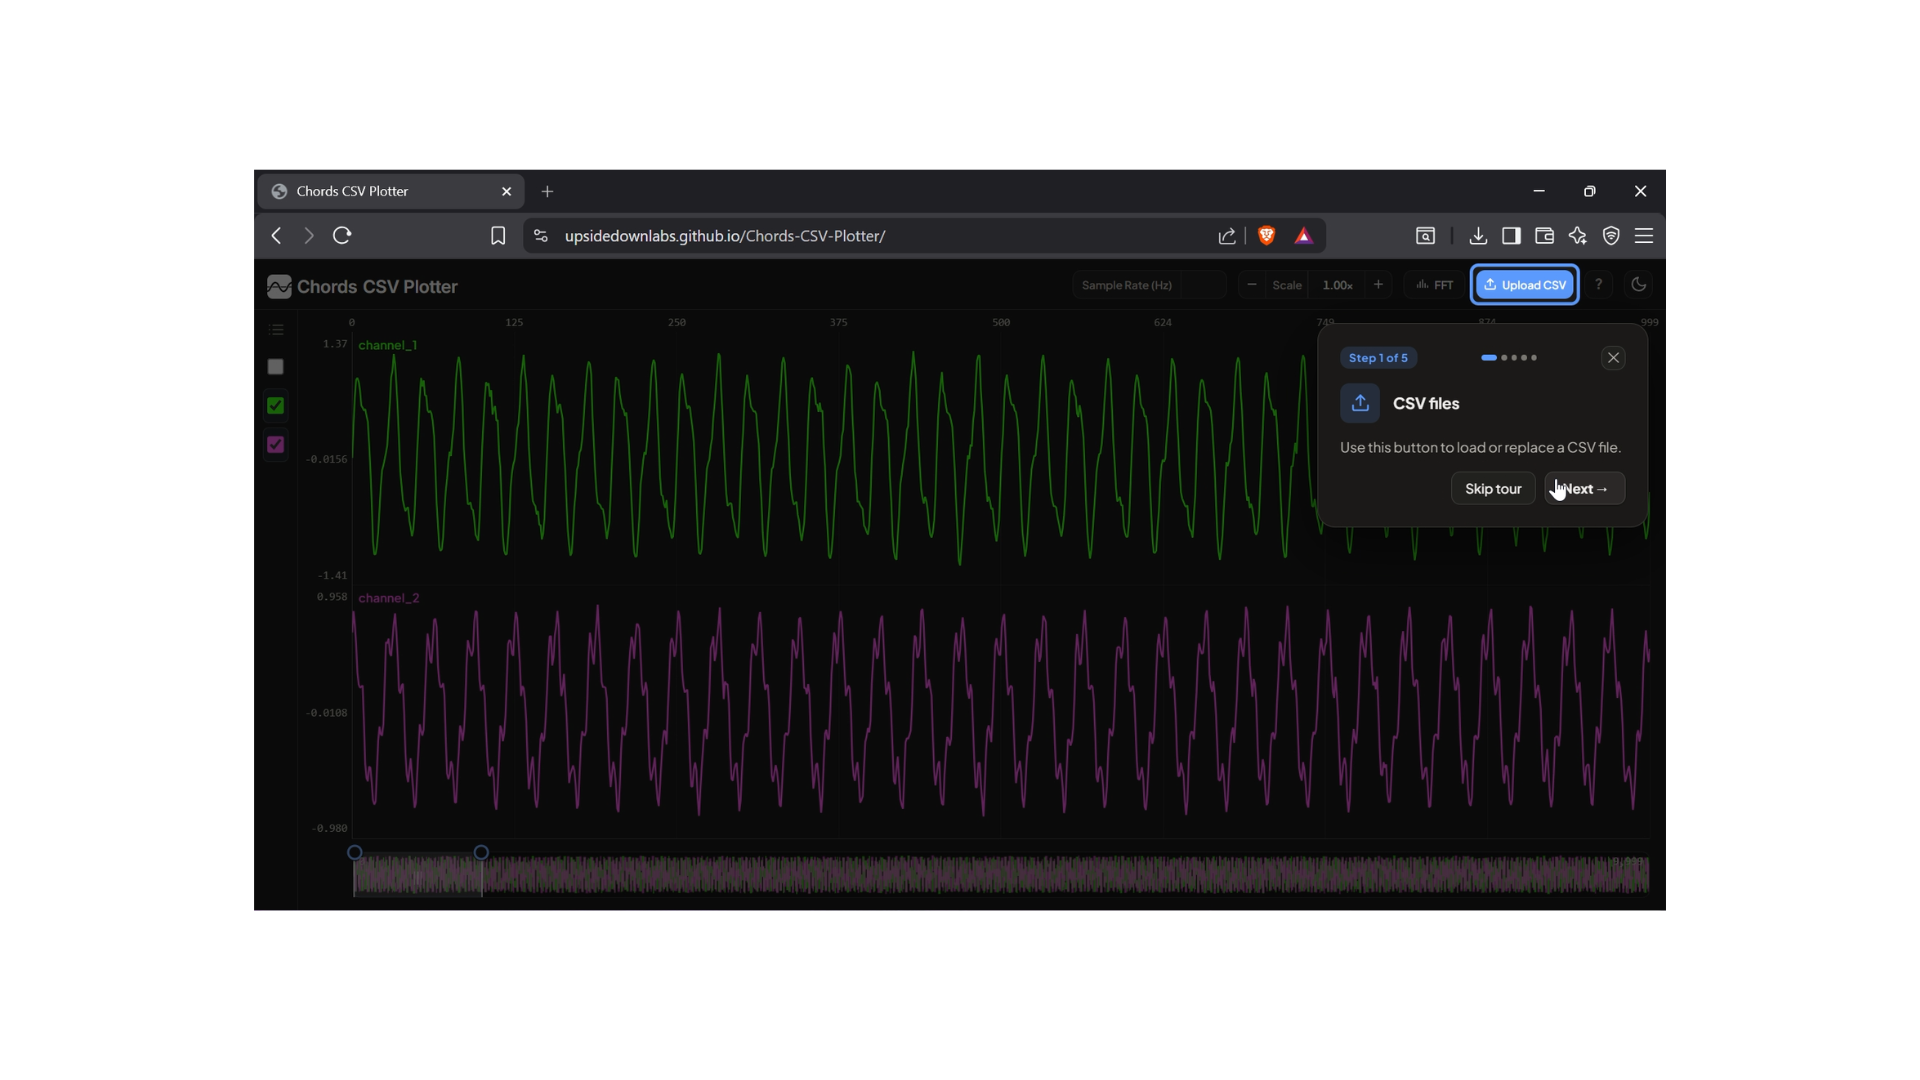
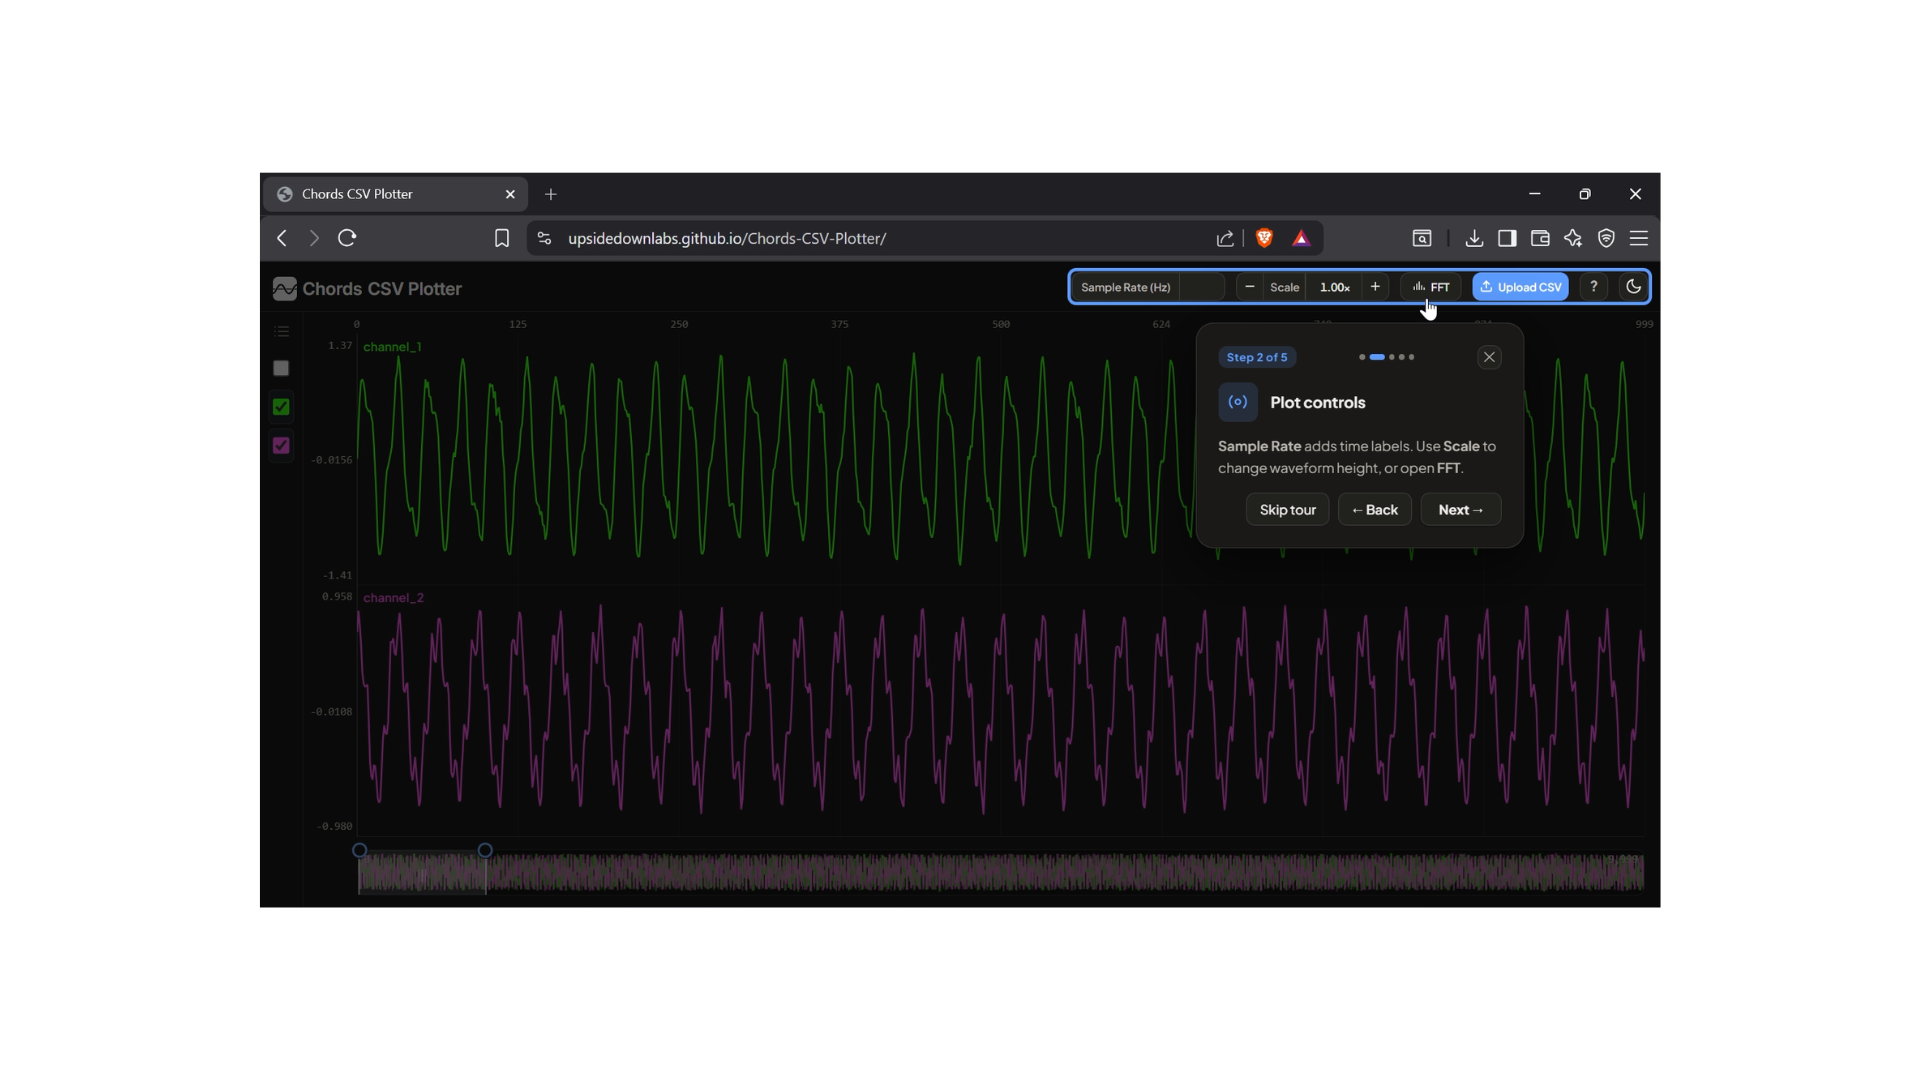
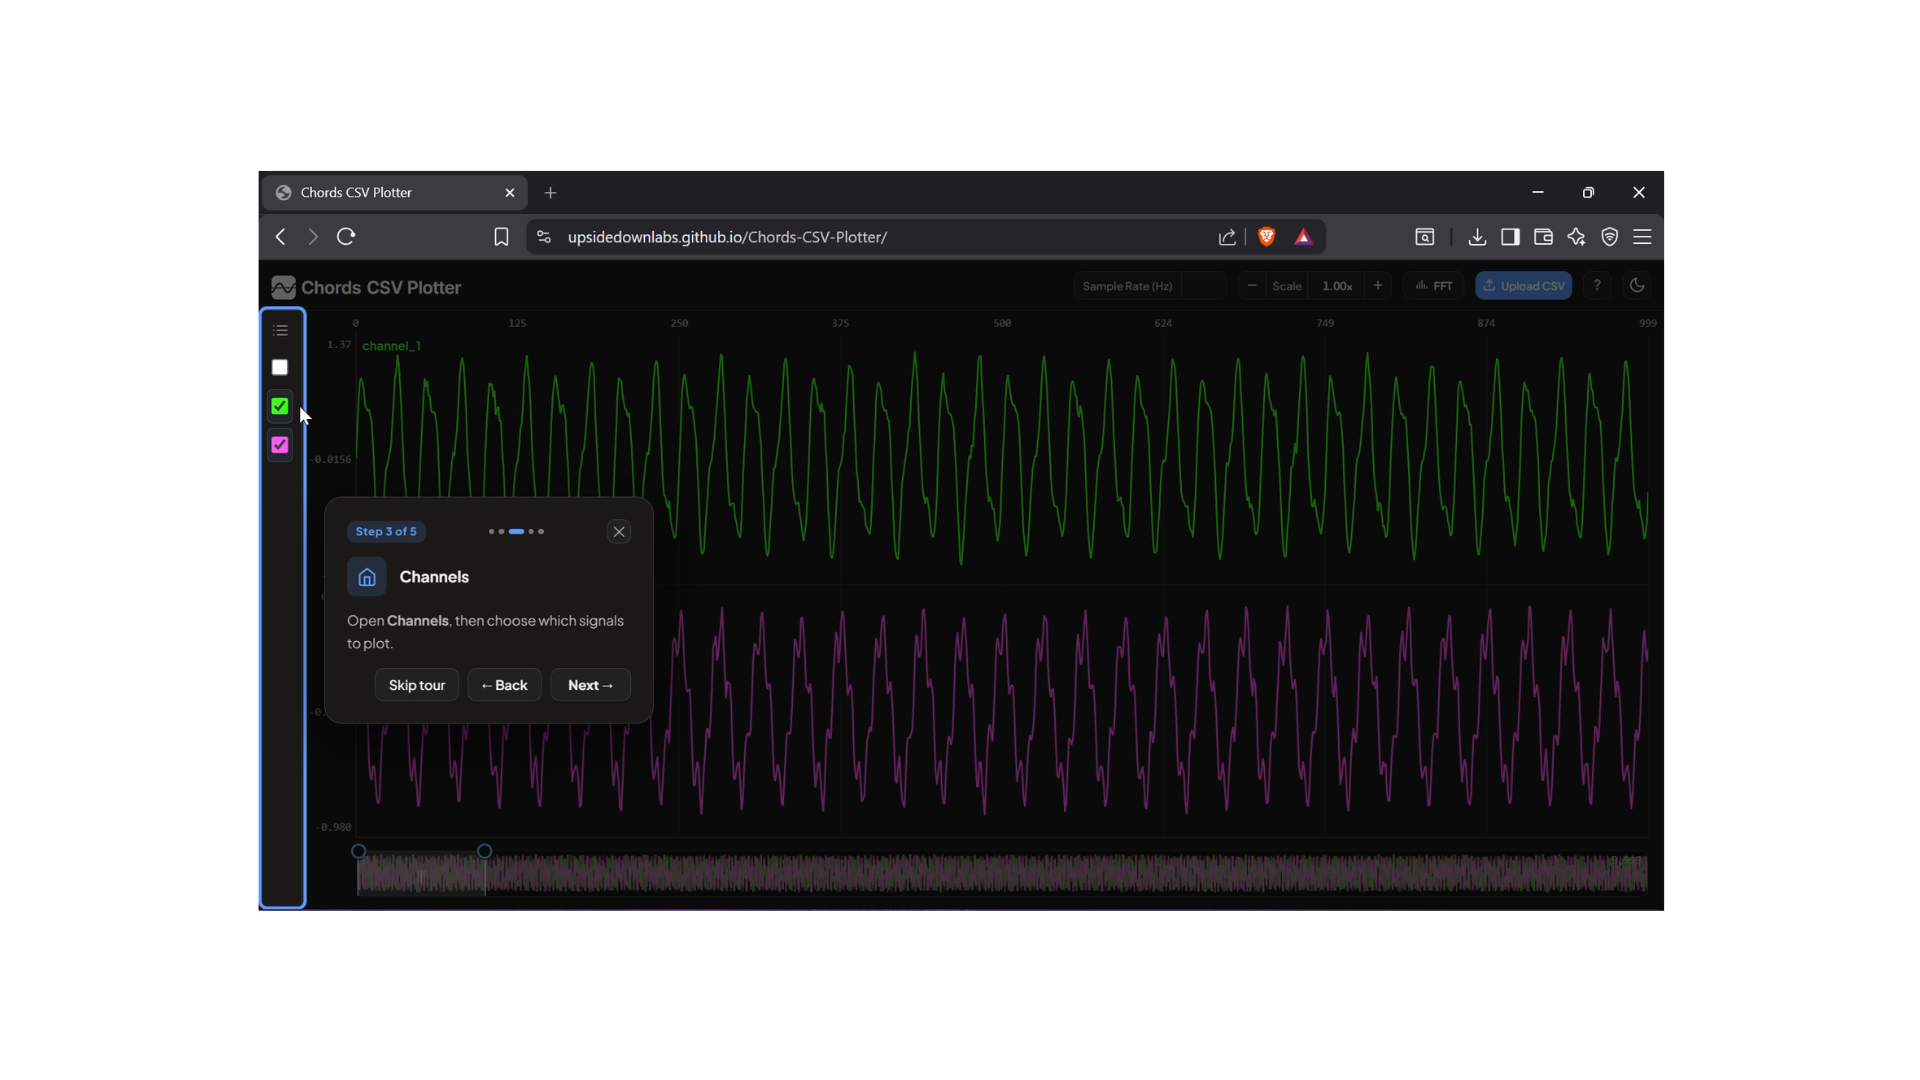
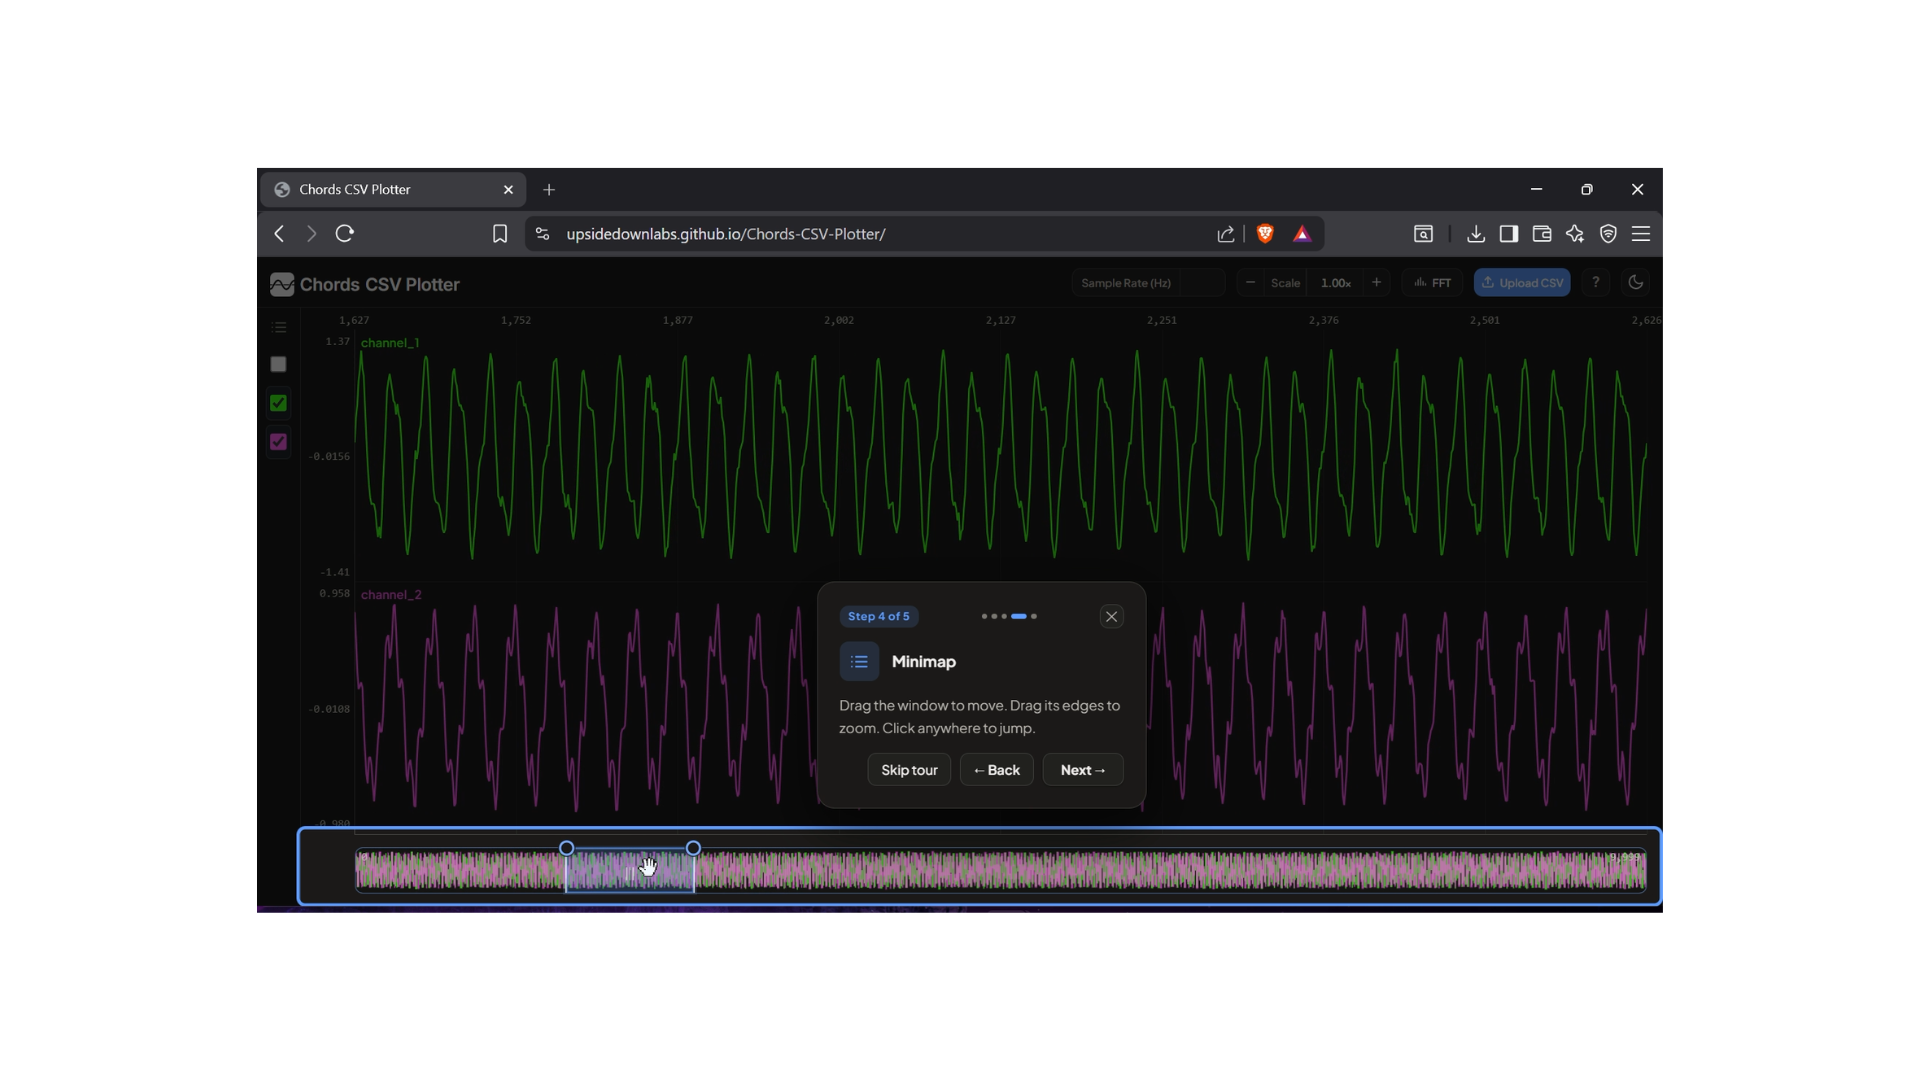
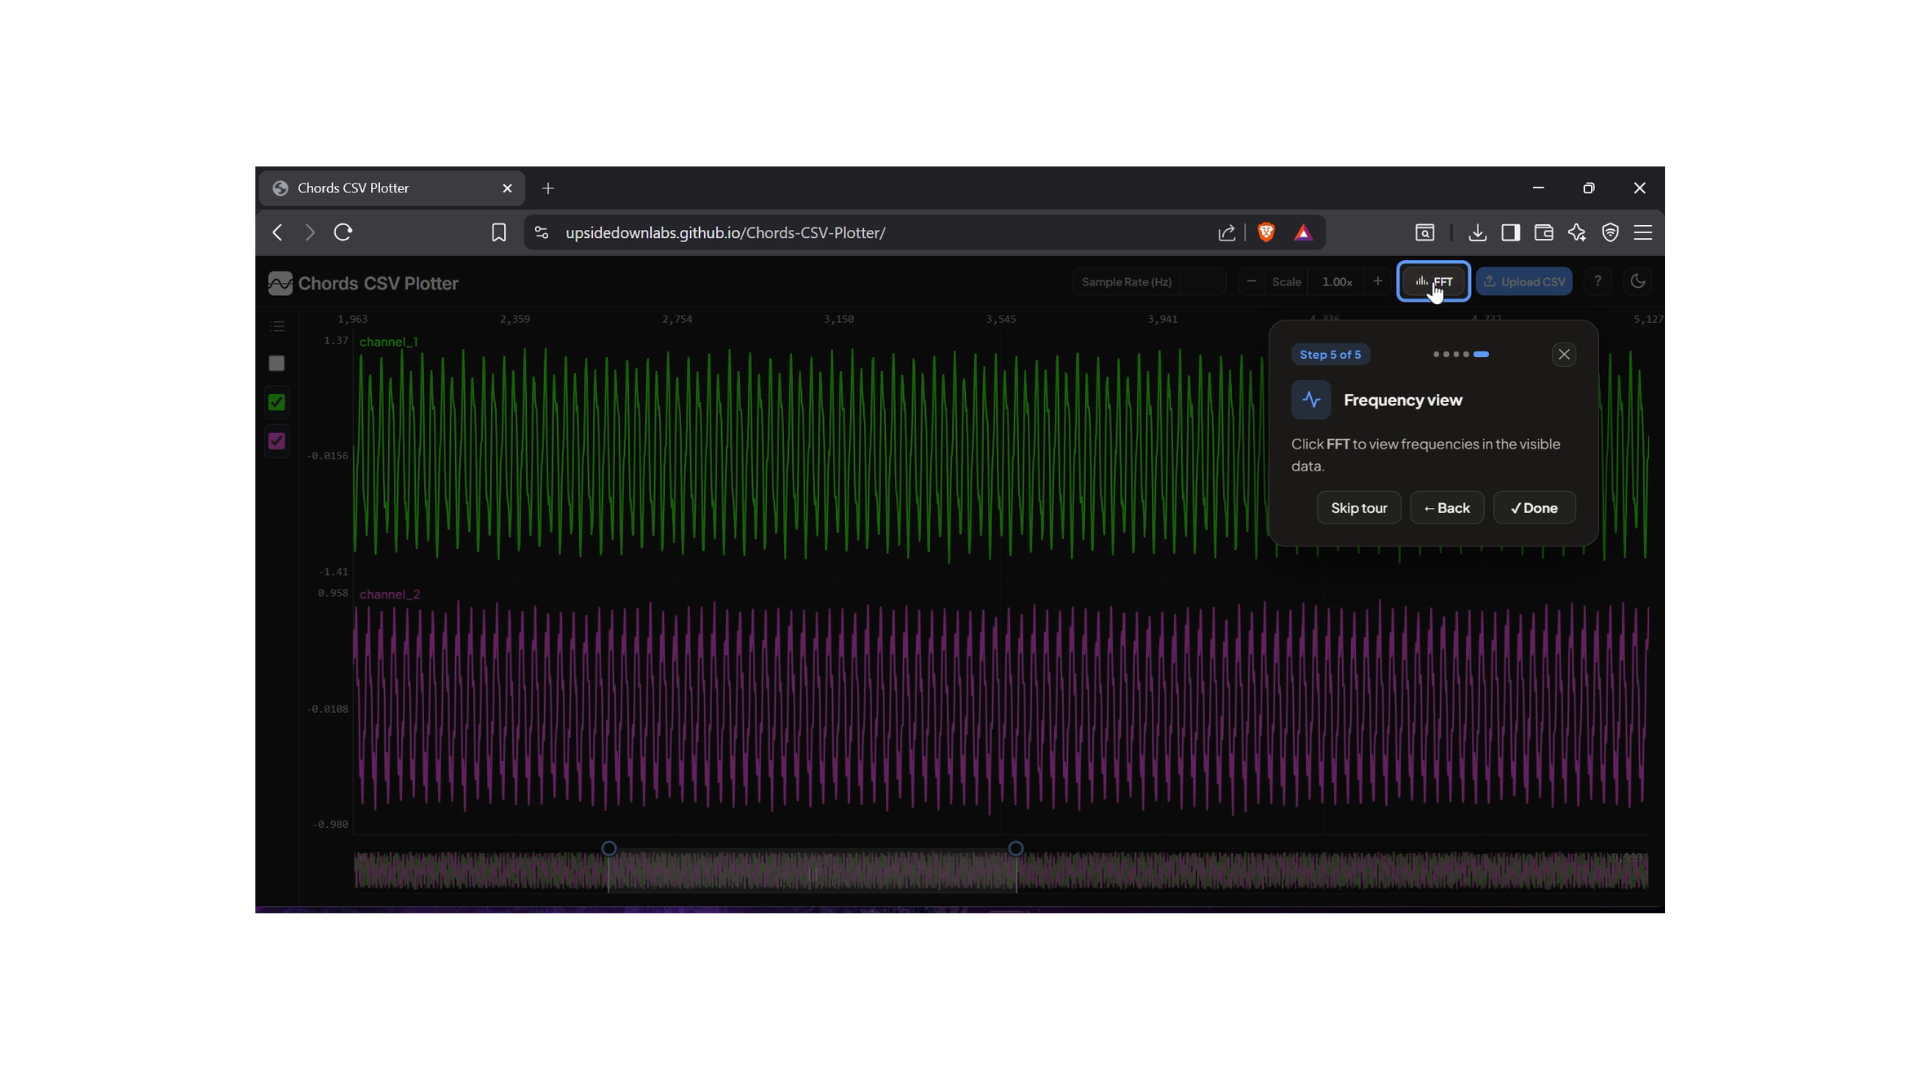
Let's look at the main parts of the interface.
- Upload – Upload your CSV file.
- Control Panel – Enter the sampling rate, adjust the signal scale, and enable the FFT Viewer.
- Channel List – Choose which channels you want to display.
- Plot Area – View your selected signals.
- Minimap – Quickly move through long recordings. You can also drag the panel borders to resize different sections of the interface.
- FFT Viewer – View the frequency content of the visible signal.
Enter the Sampling Rate
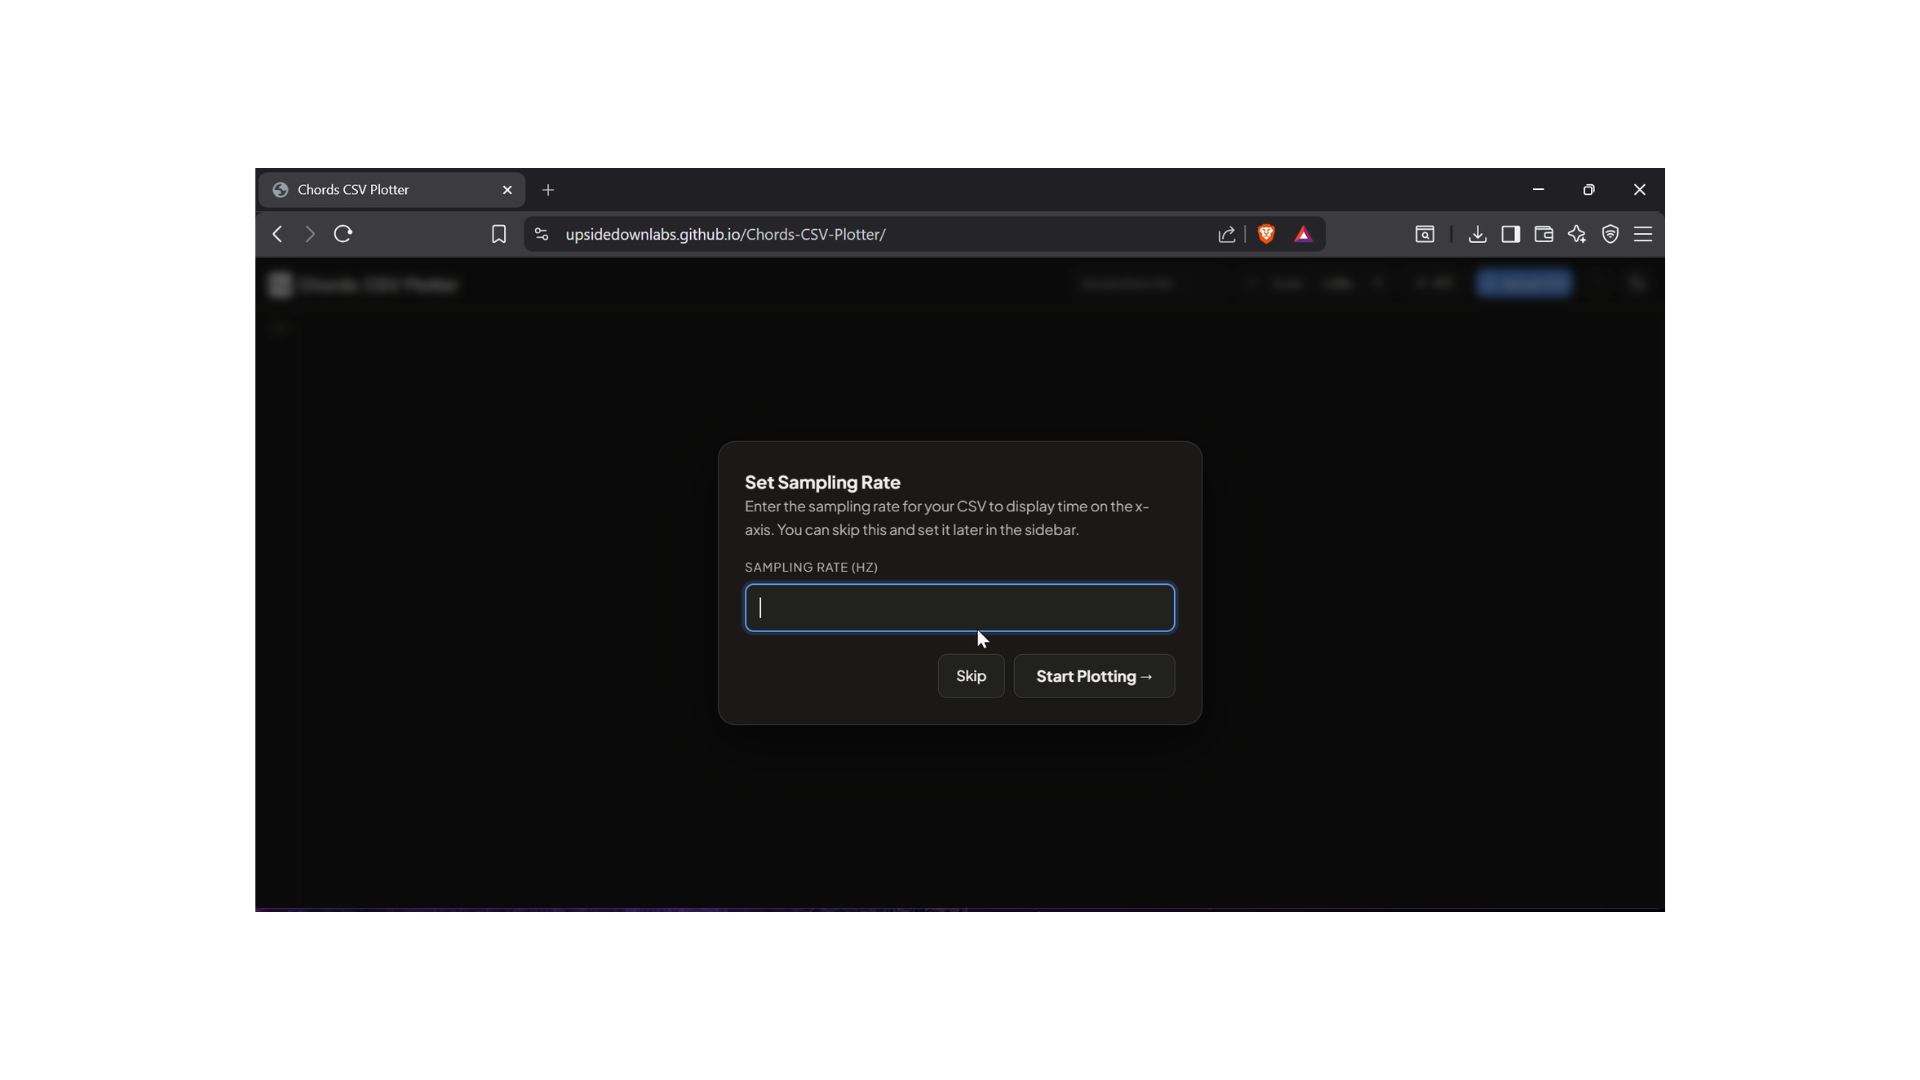
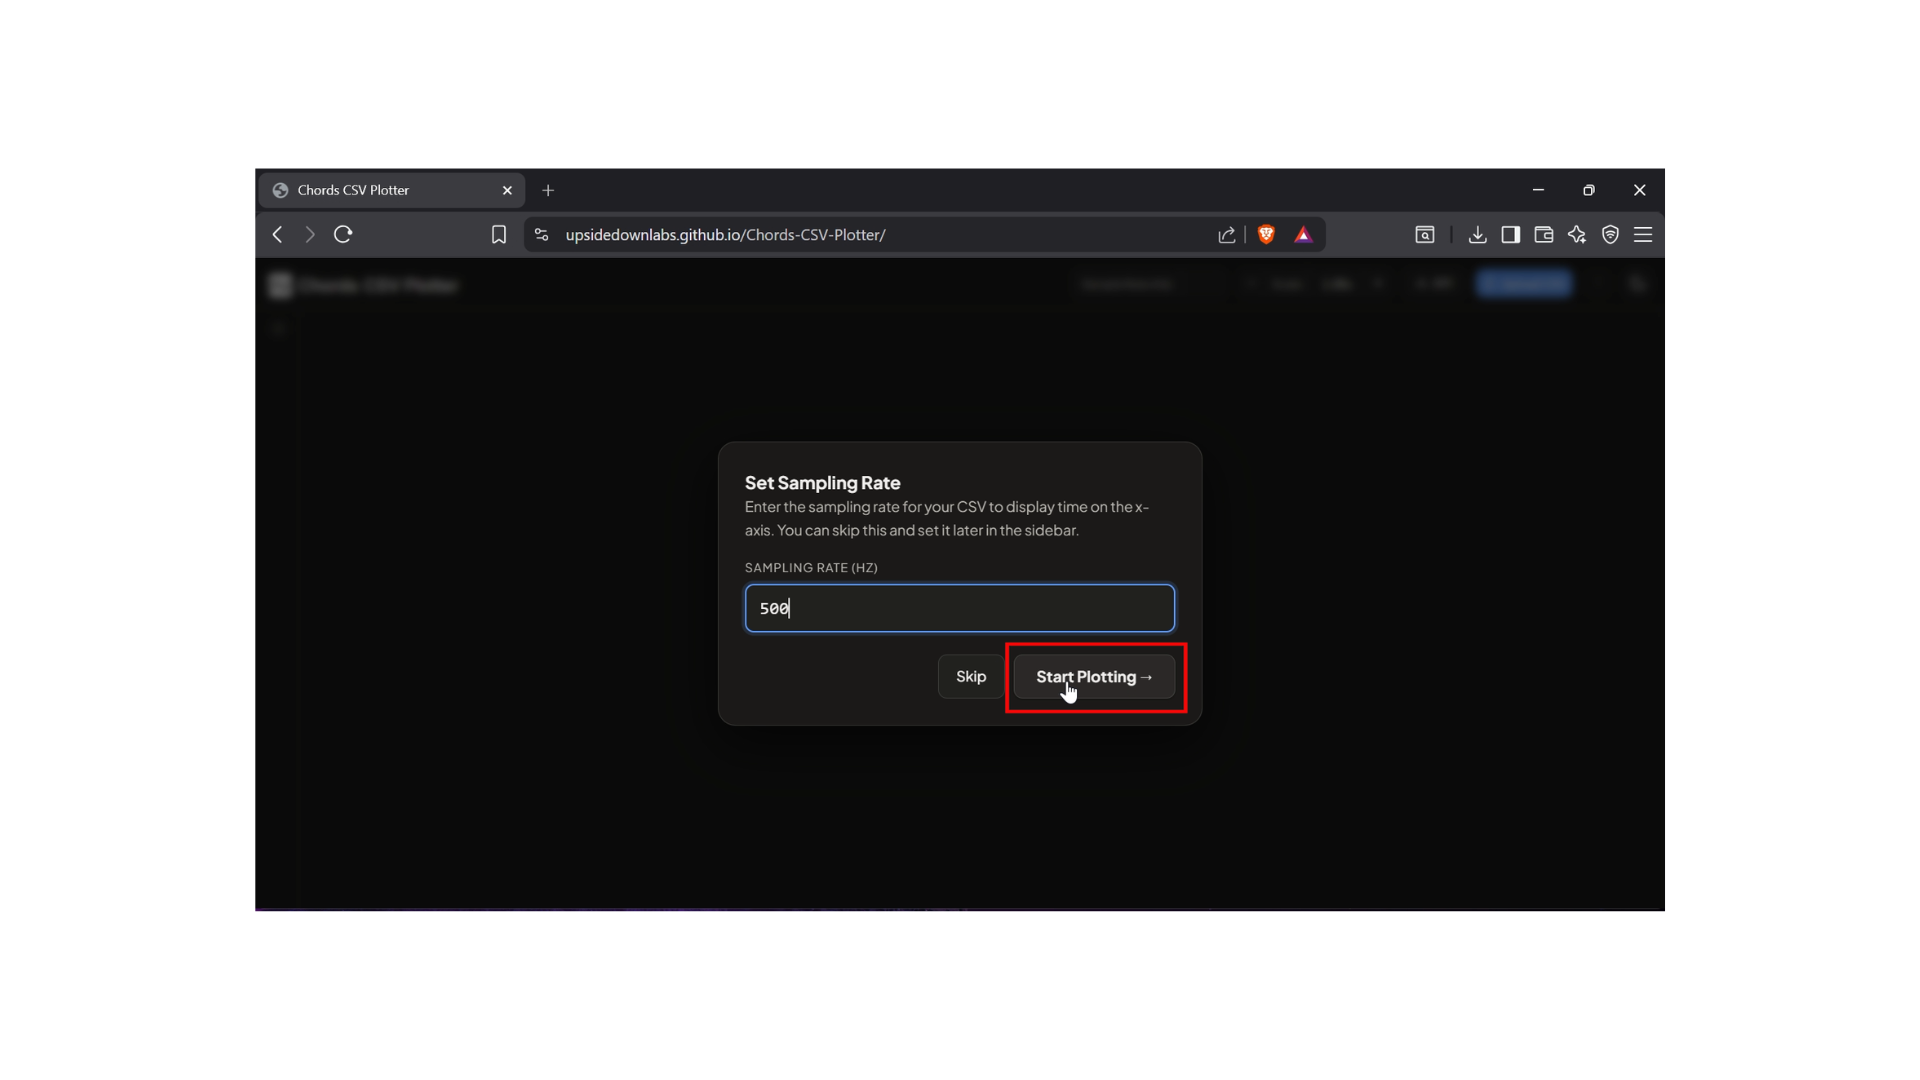
Enter the sampling rate of your recording.
This step is optional, but recommended. It changes the horizontal axis from sample numbers to time, making it easier to understand when events occurred during the recording.
Select the Channels
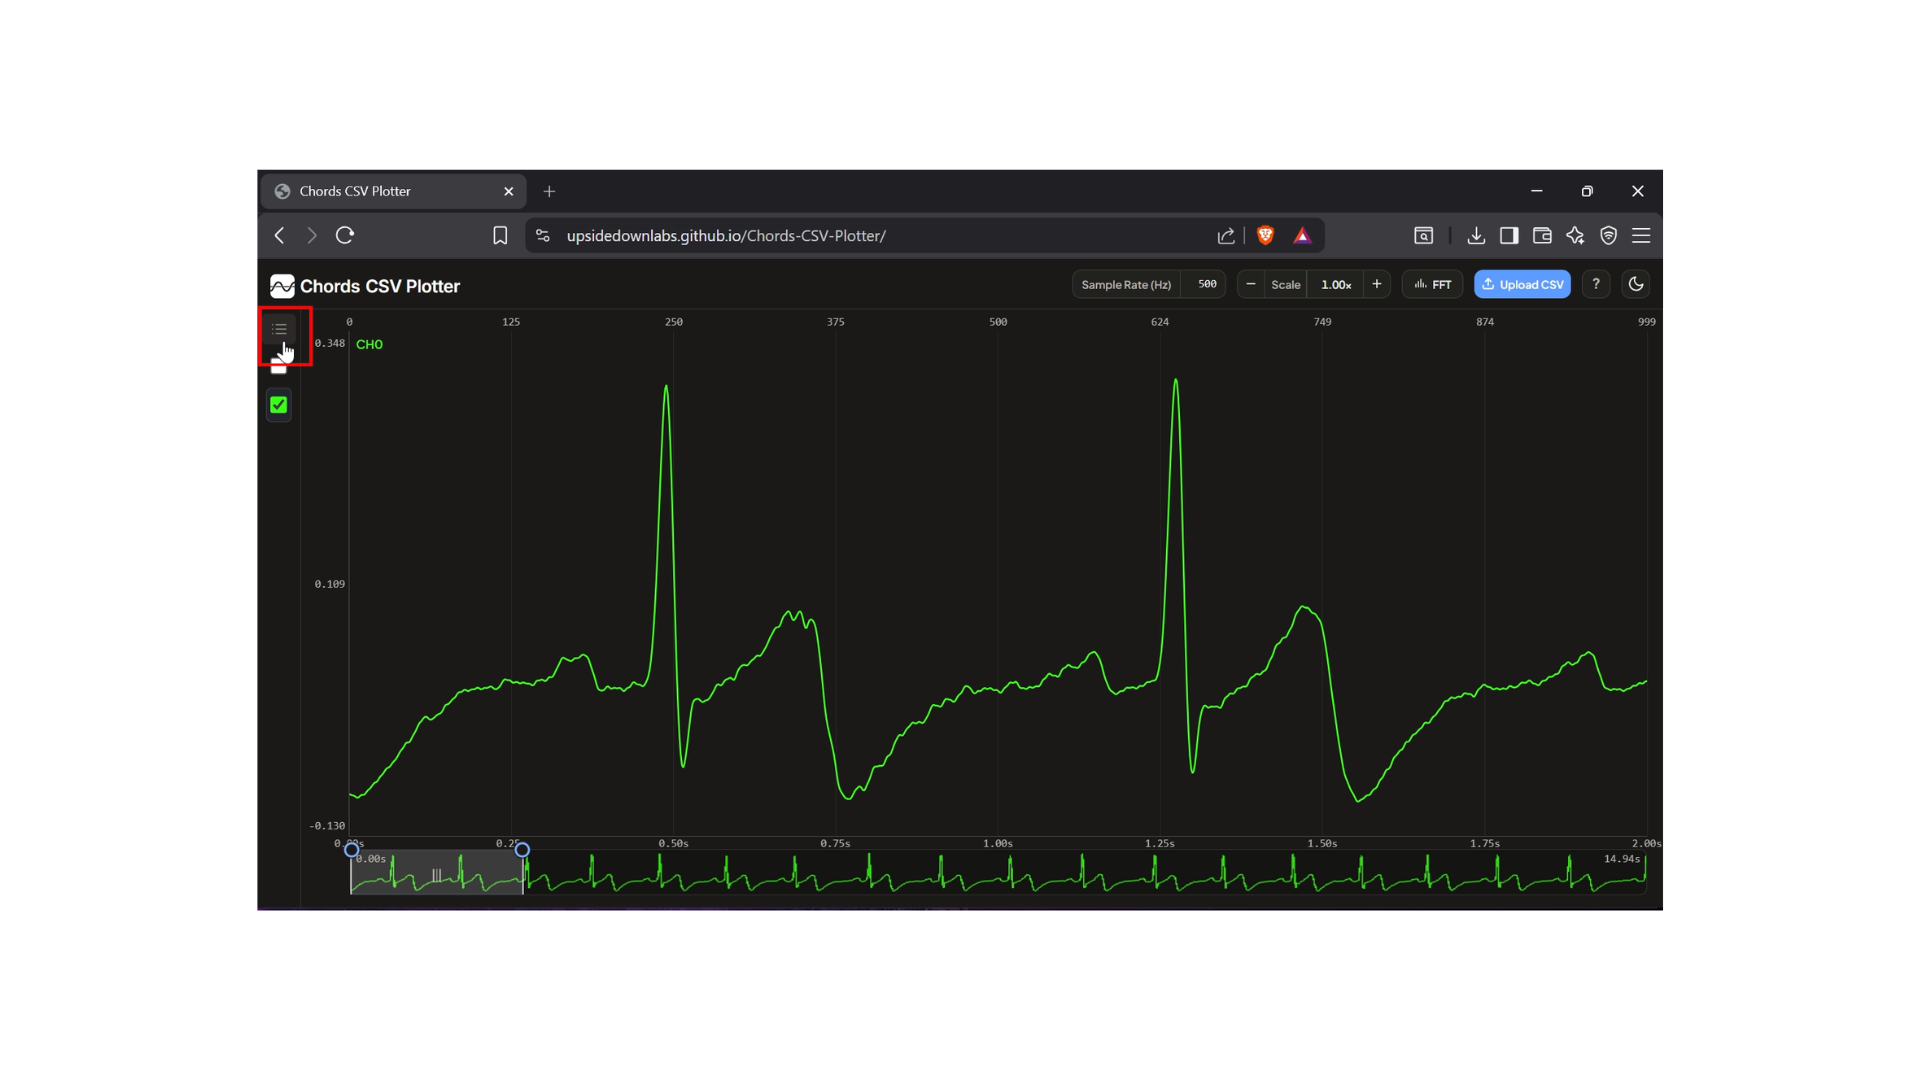
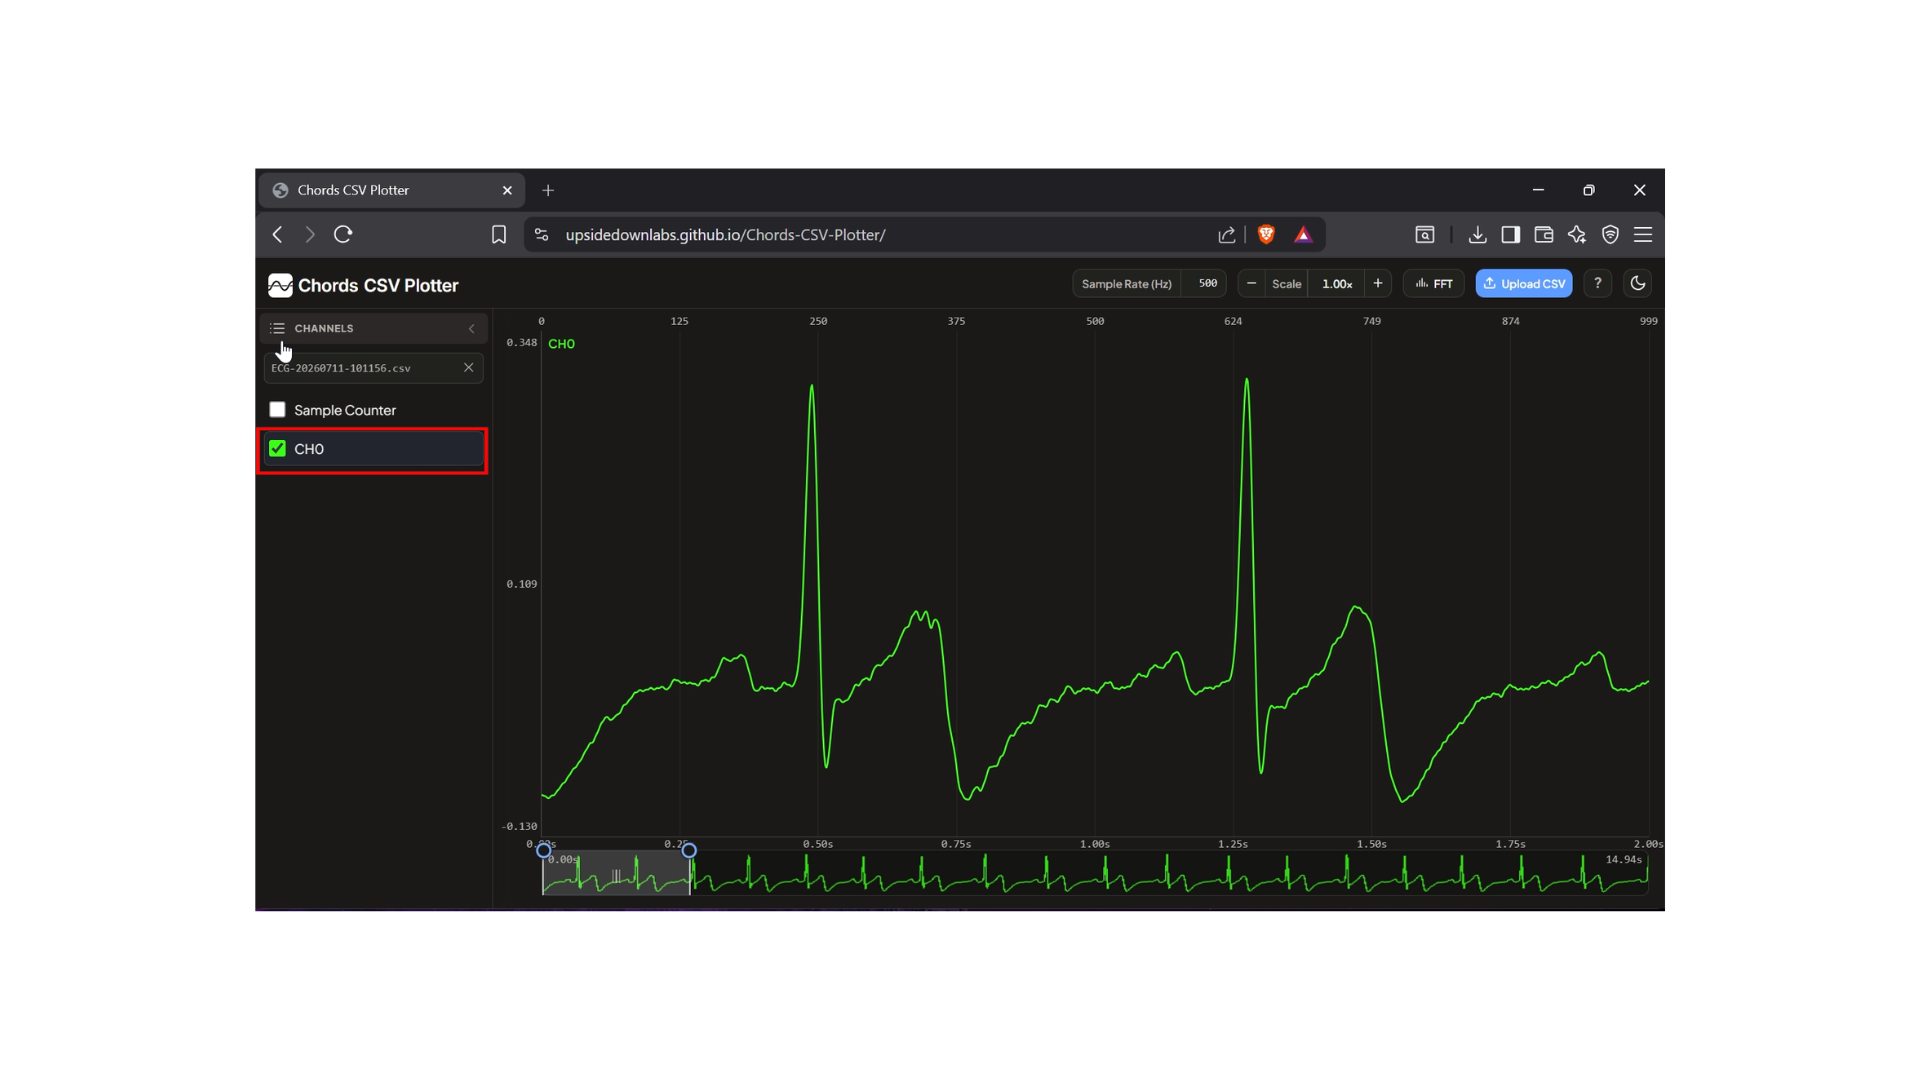
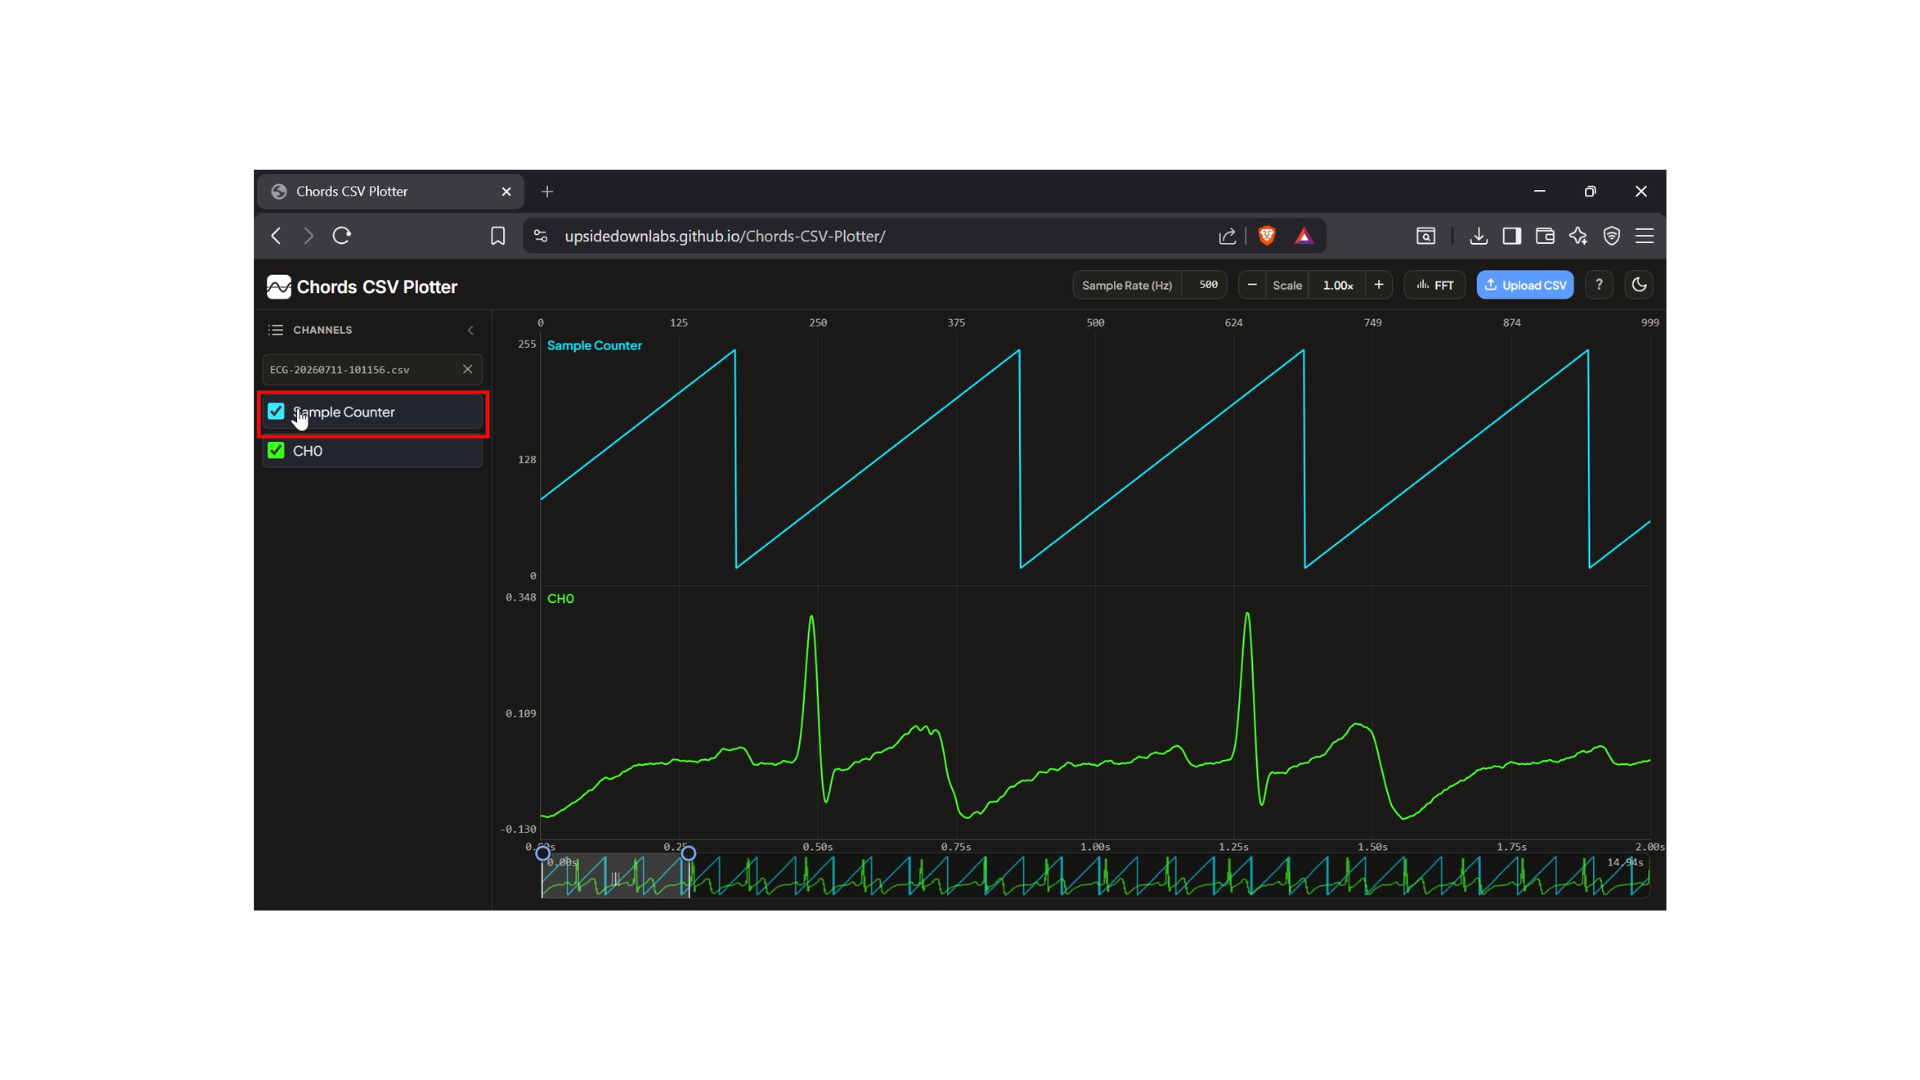
Choose the channels you want to view from the channel list.
As soon as you select a channel, its signal appears on the graph.
You can display one or multiple channels at the same time.
Move Through the Recording
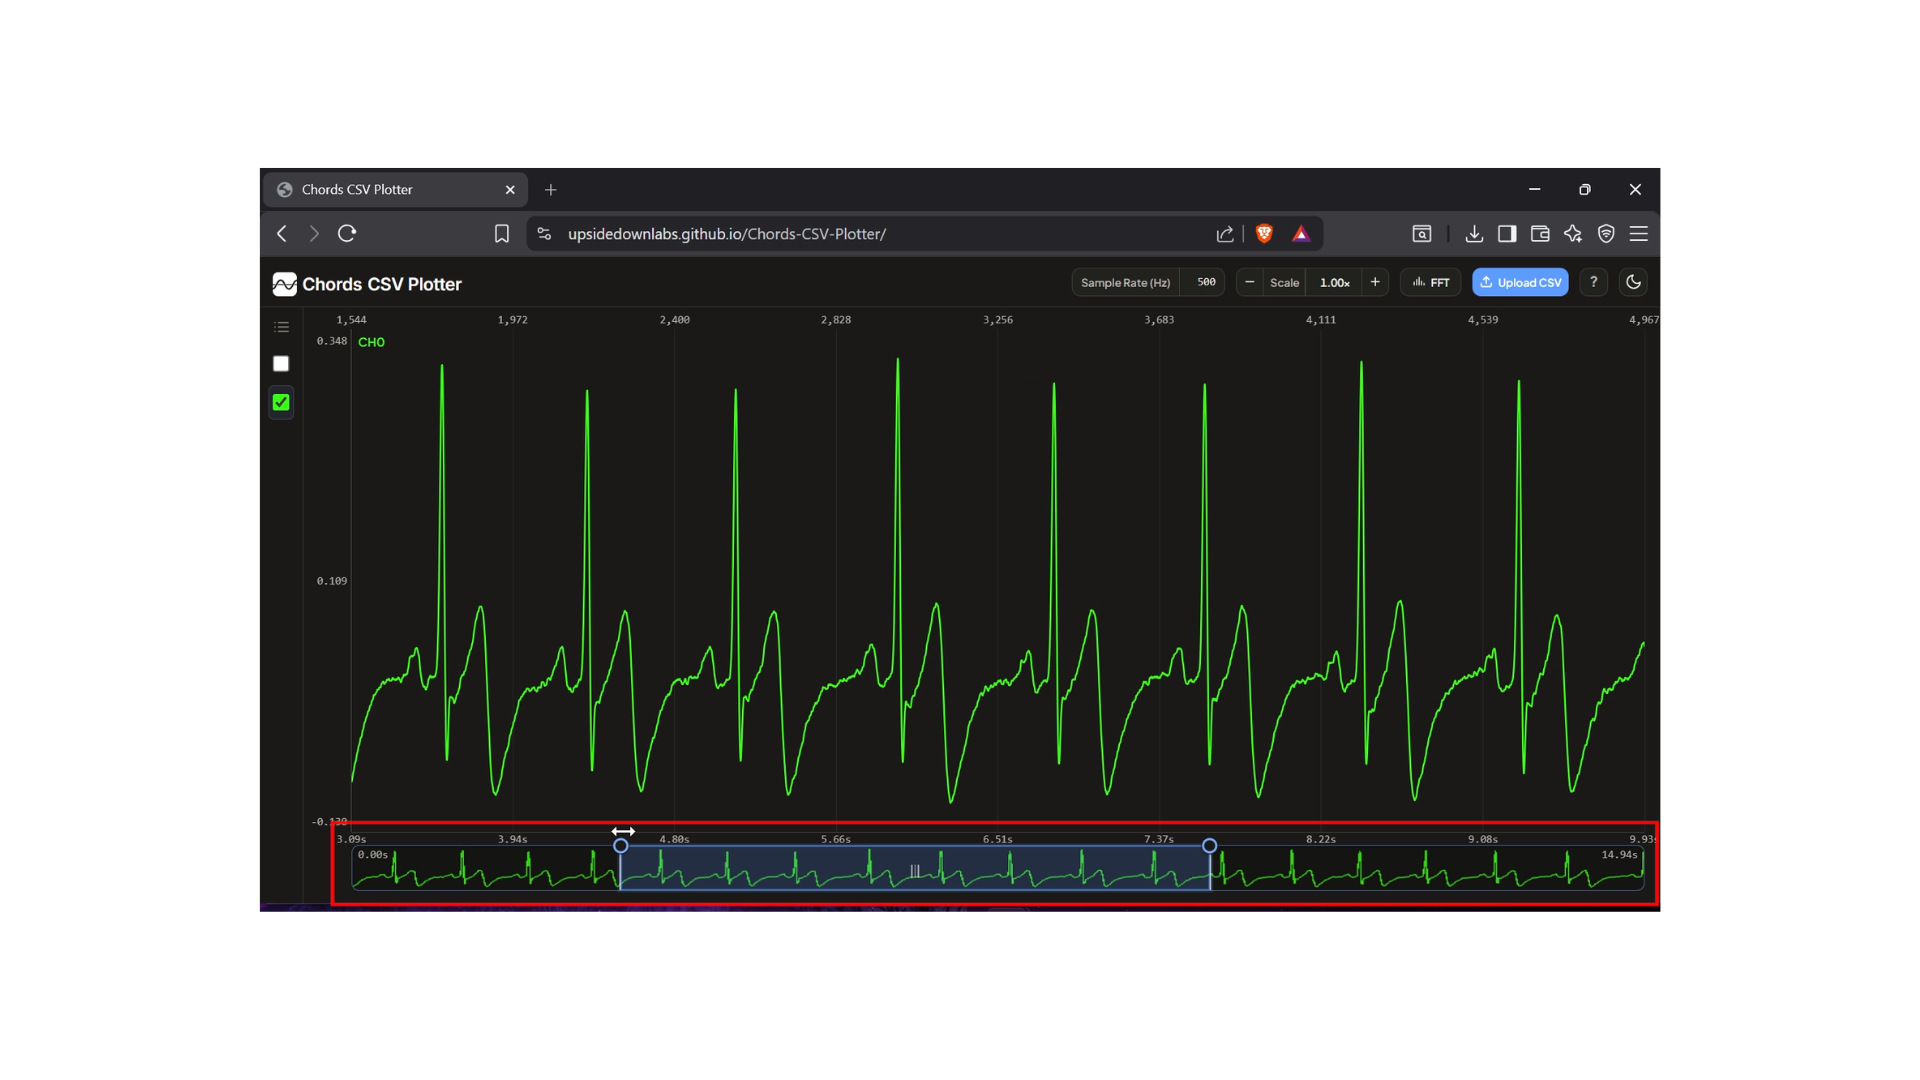
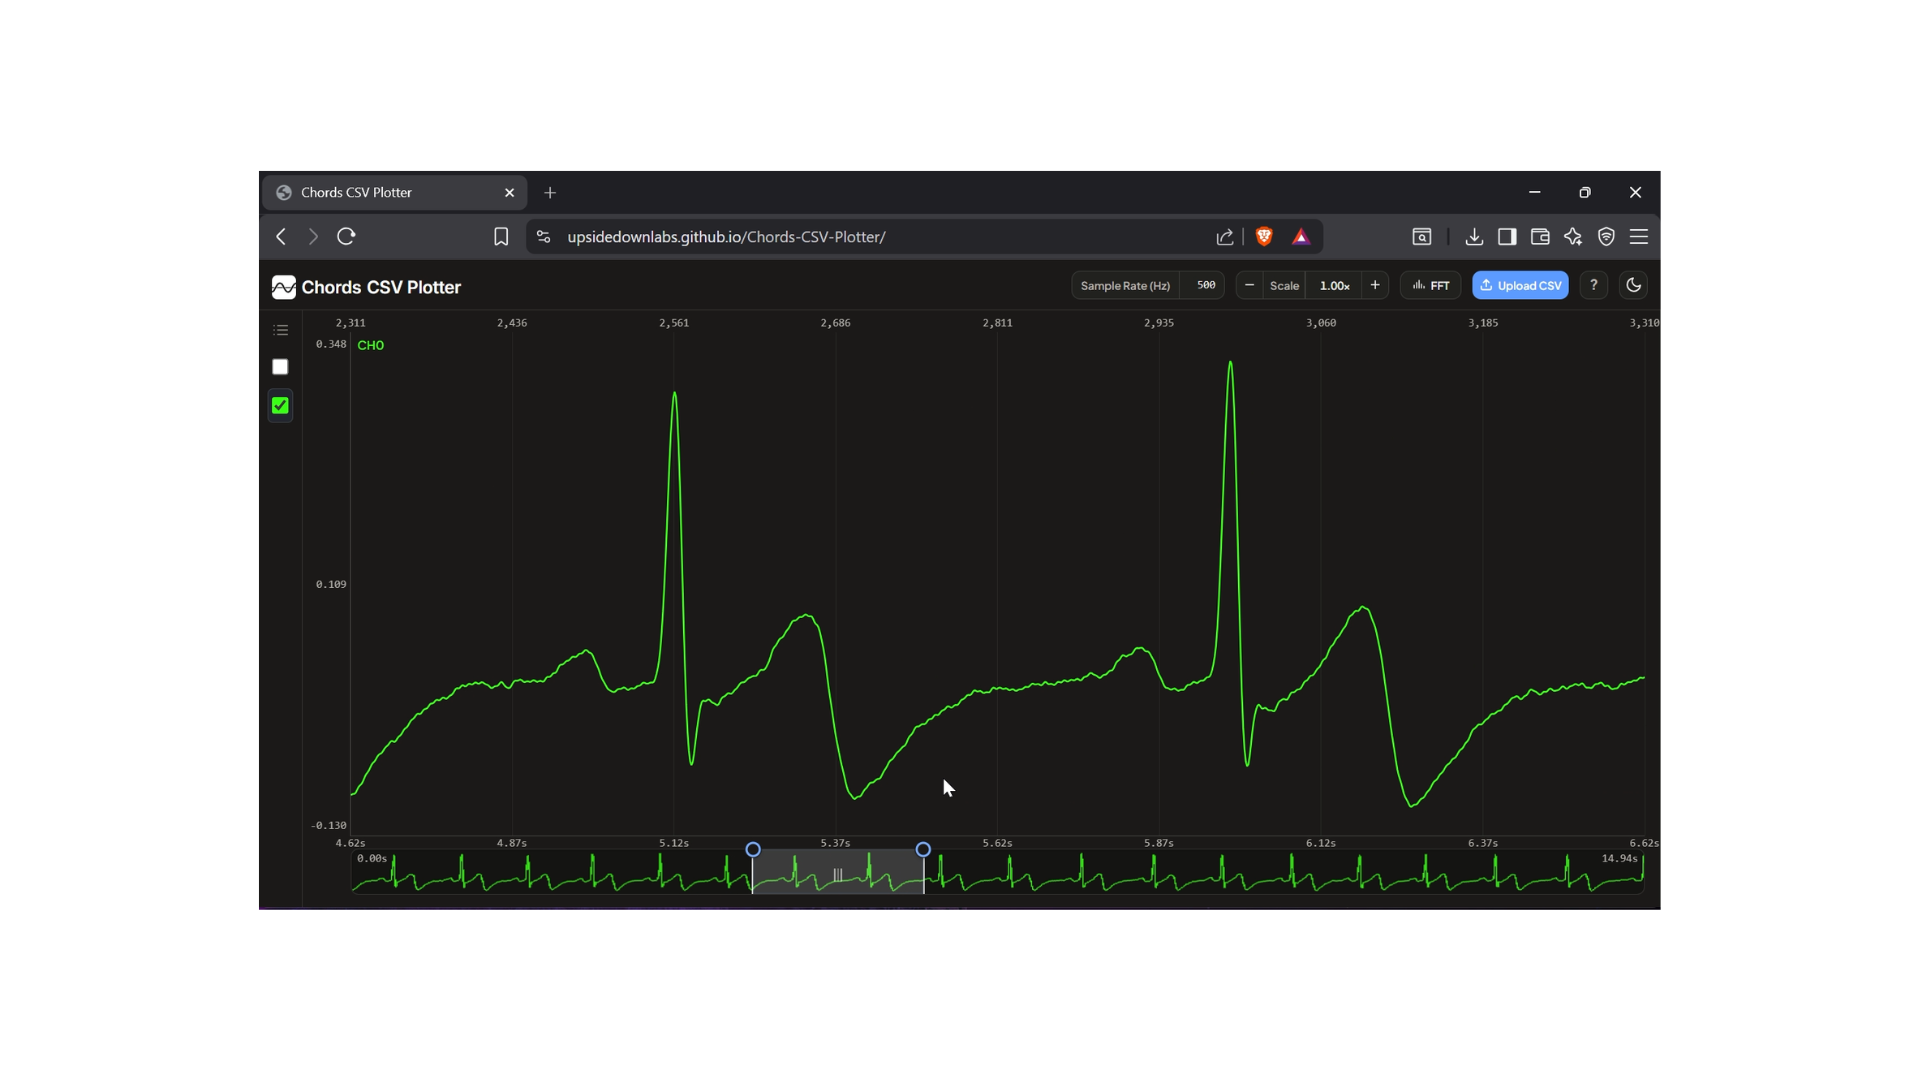
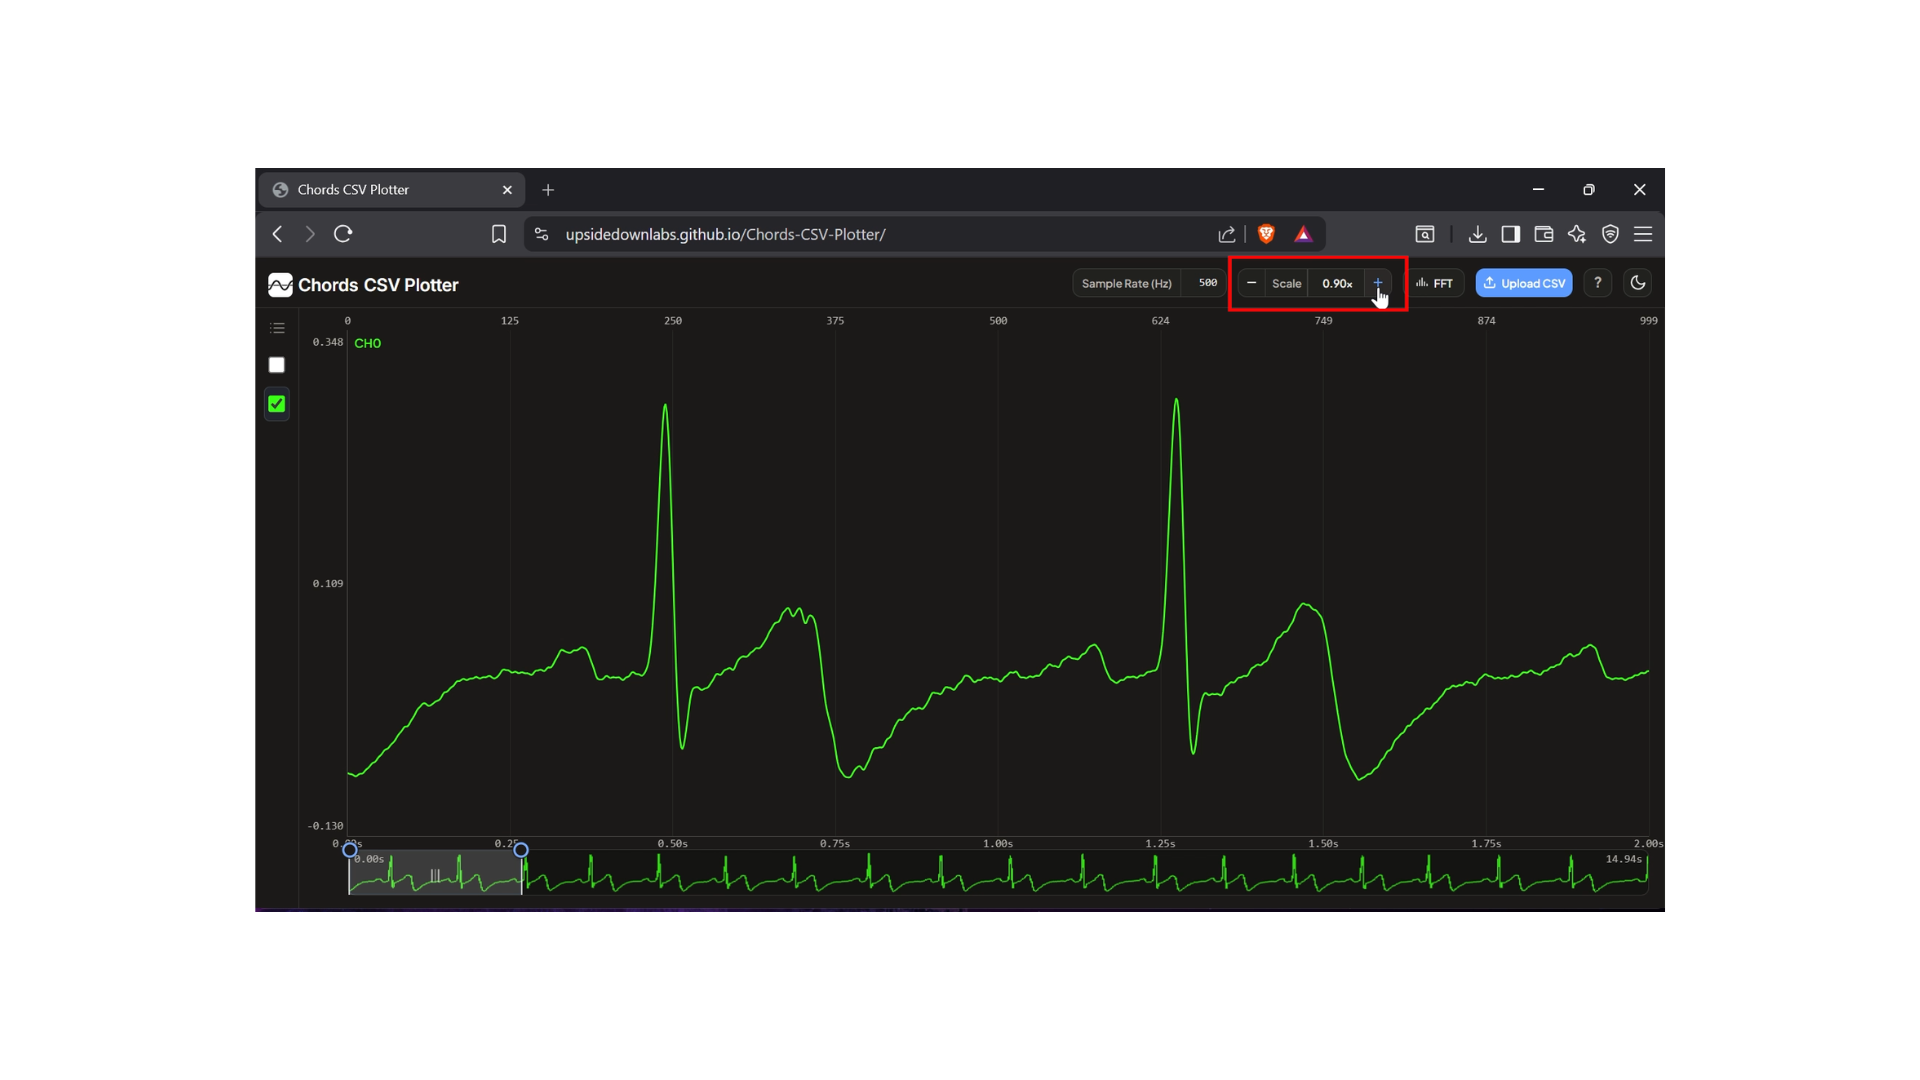
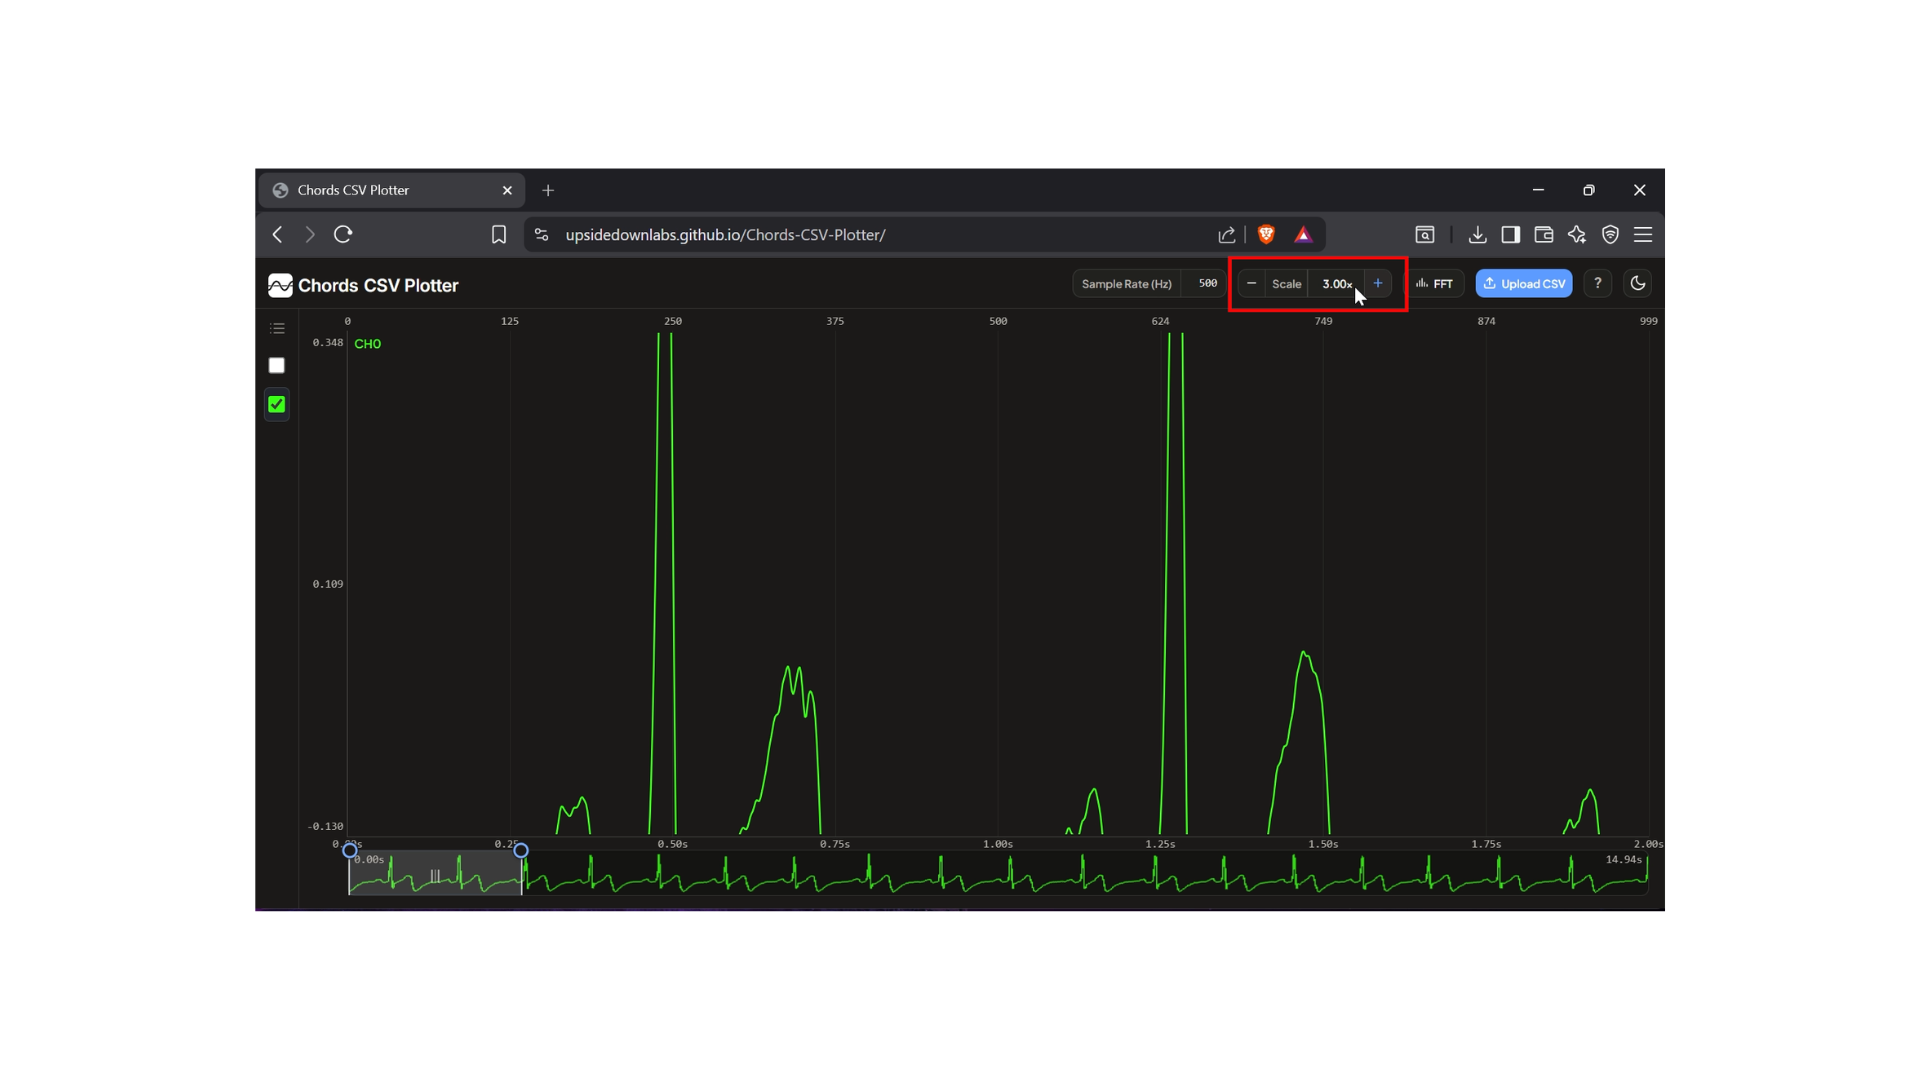
You can easily change how the signals are displayed.
- Zoom in to see small details.
- Zoom out to see more of the recording.
- Adjust the vertical scale to make the signals easier to read.
Use the FFT Viewer
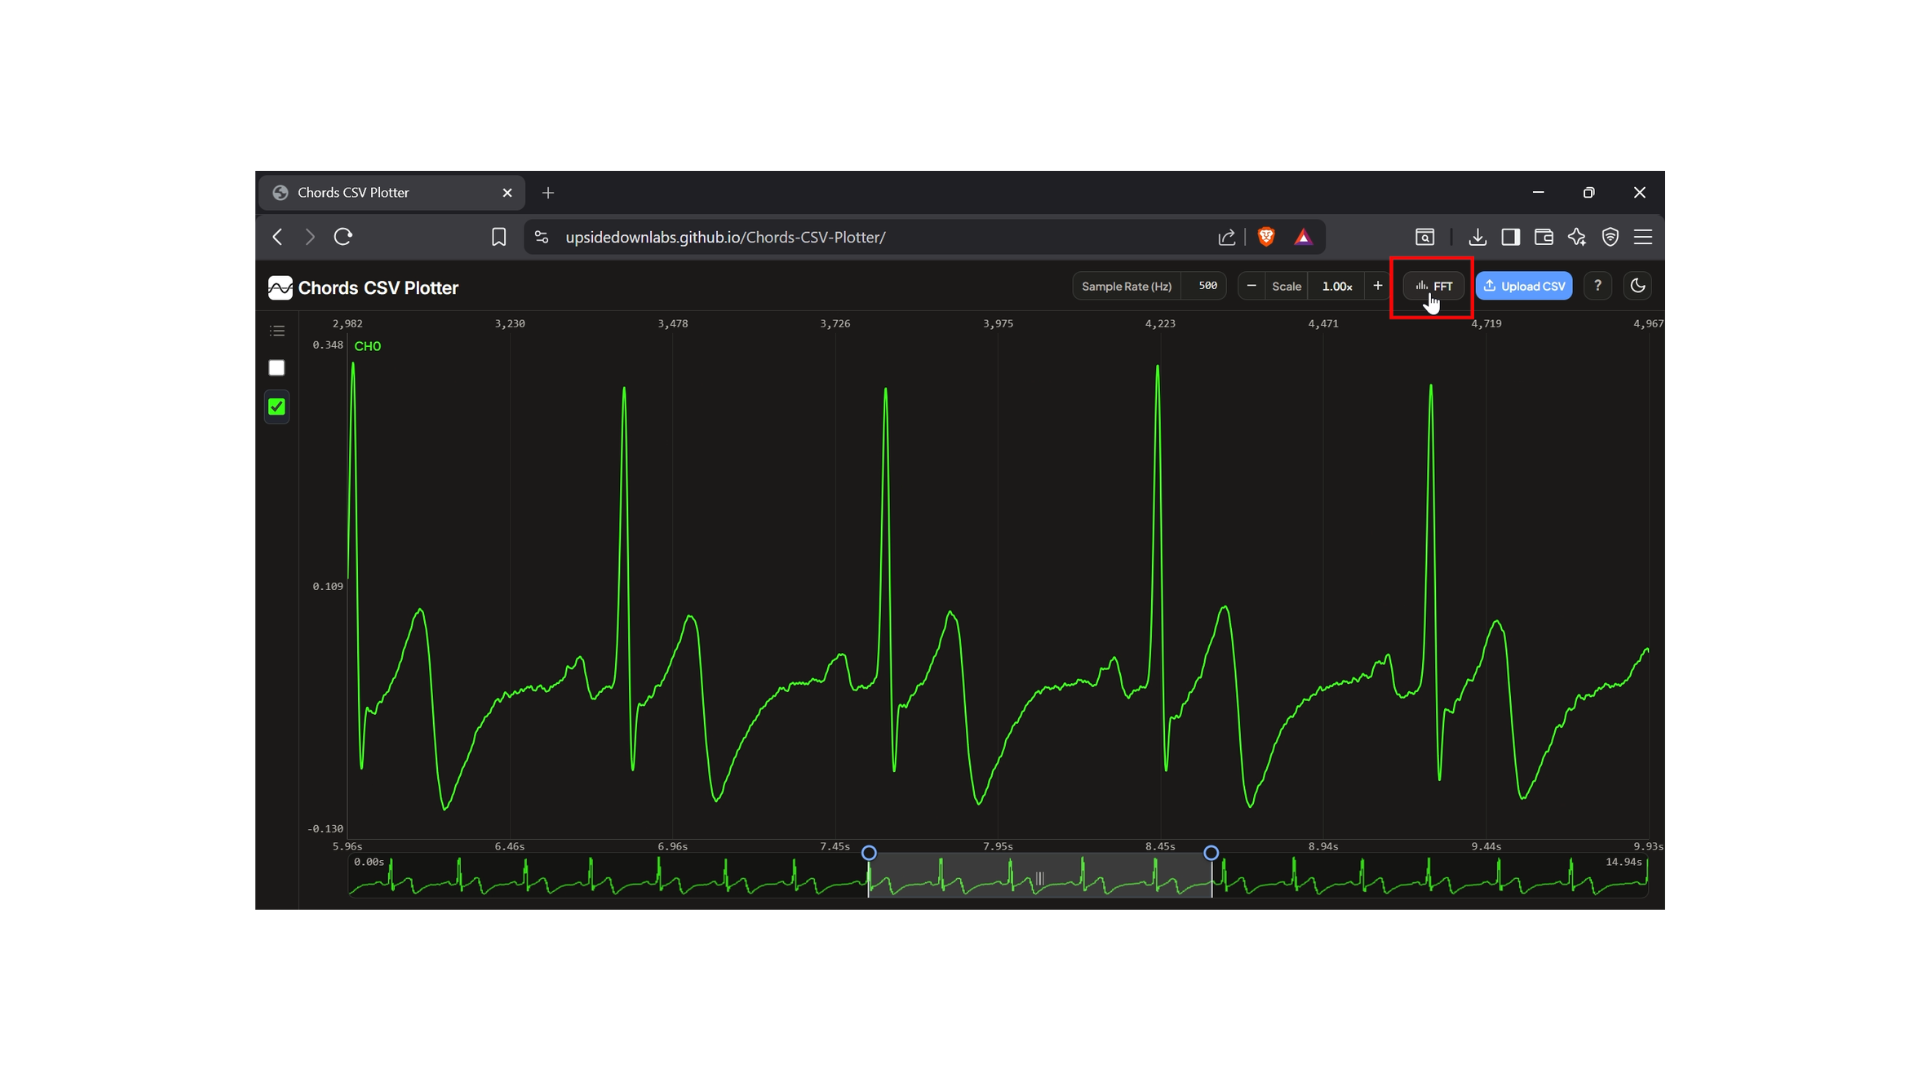
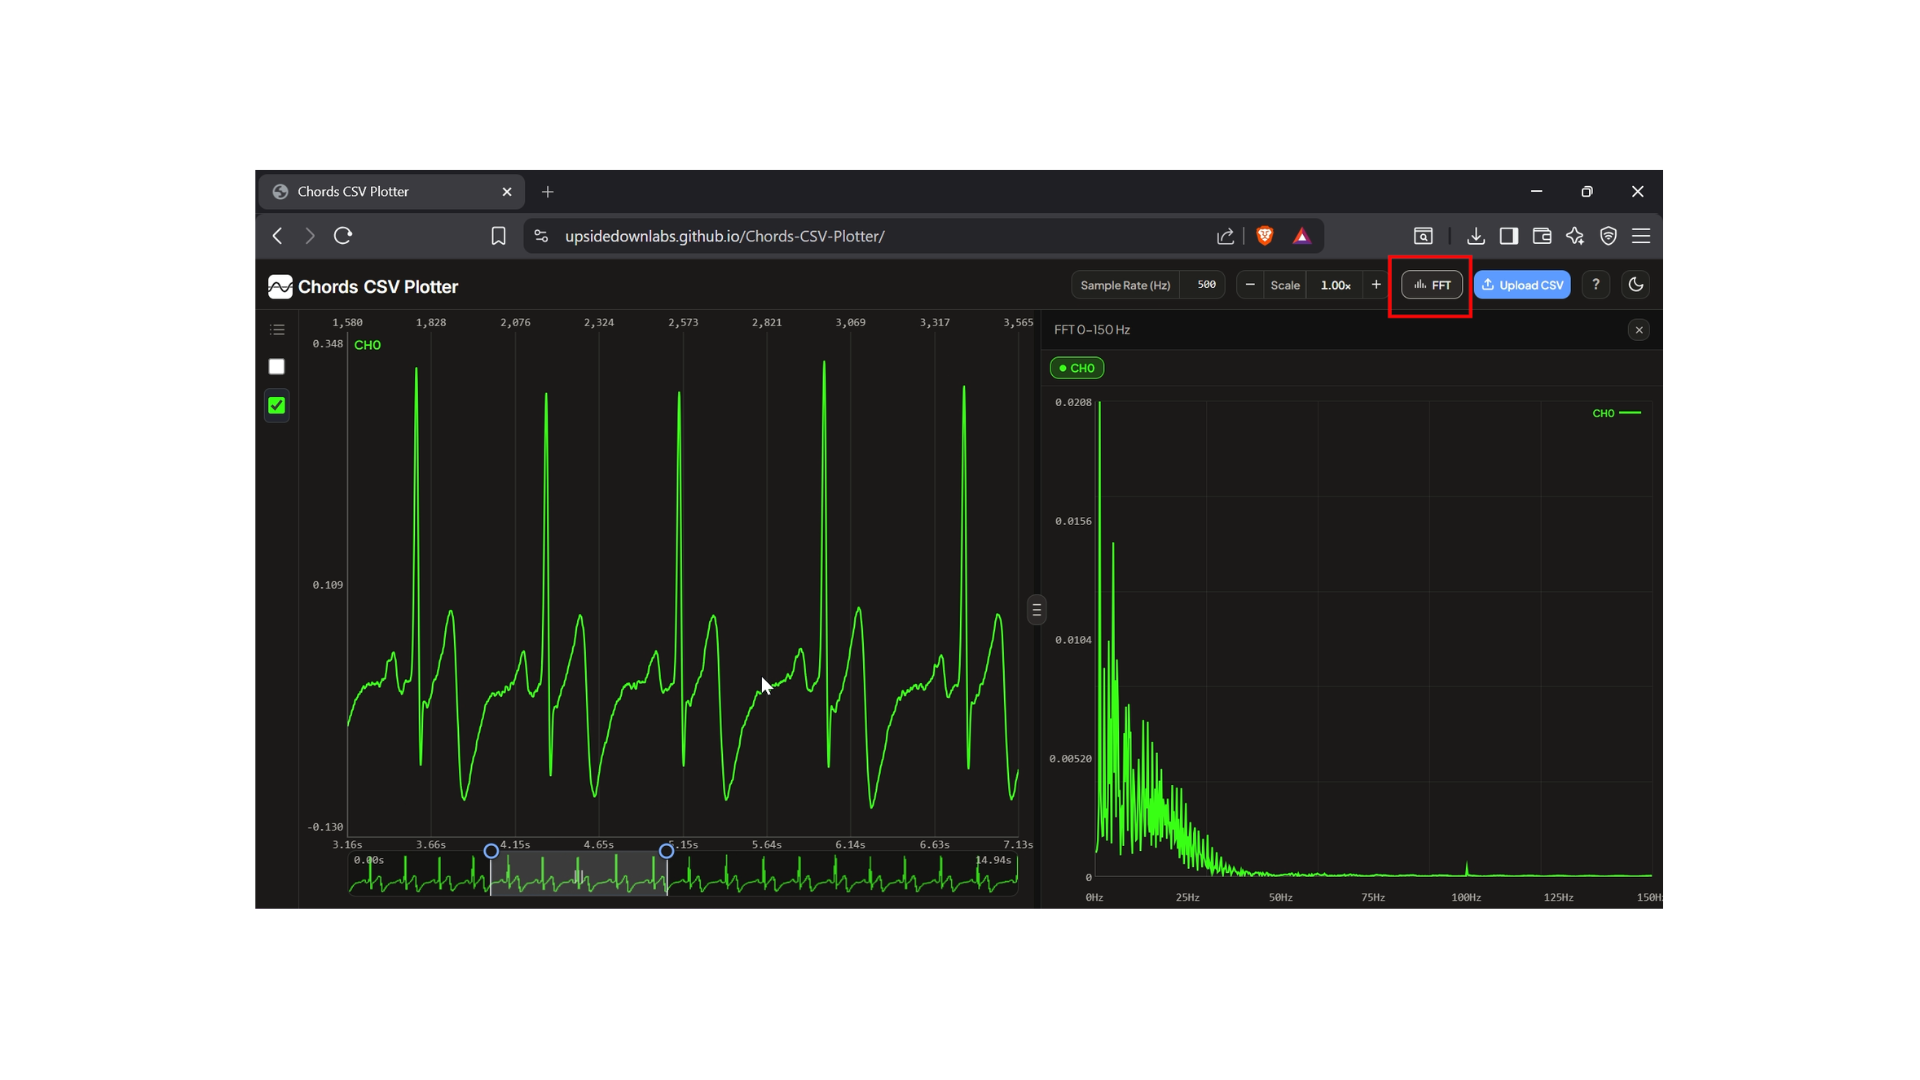
Click the FFT button to open the FFT Viewer.
The FFT Viewer shows the frequencies present in the visible part of your signal. This is useful for analysing signals such as:
- EEG
- EMG
- ECG
- IMU and vibration data
- Other time-series recordings
Resize the Workspace
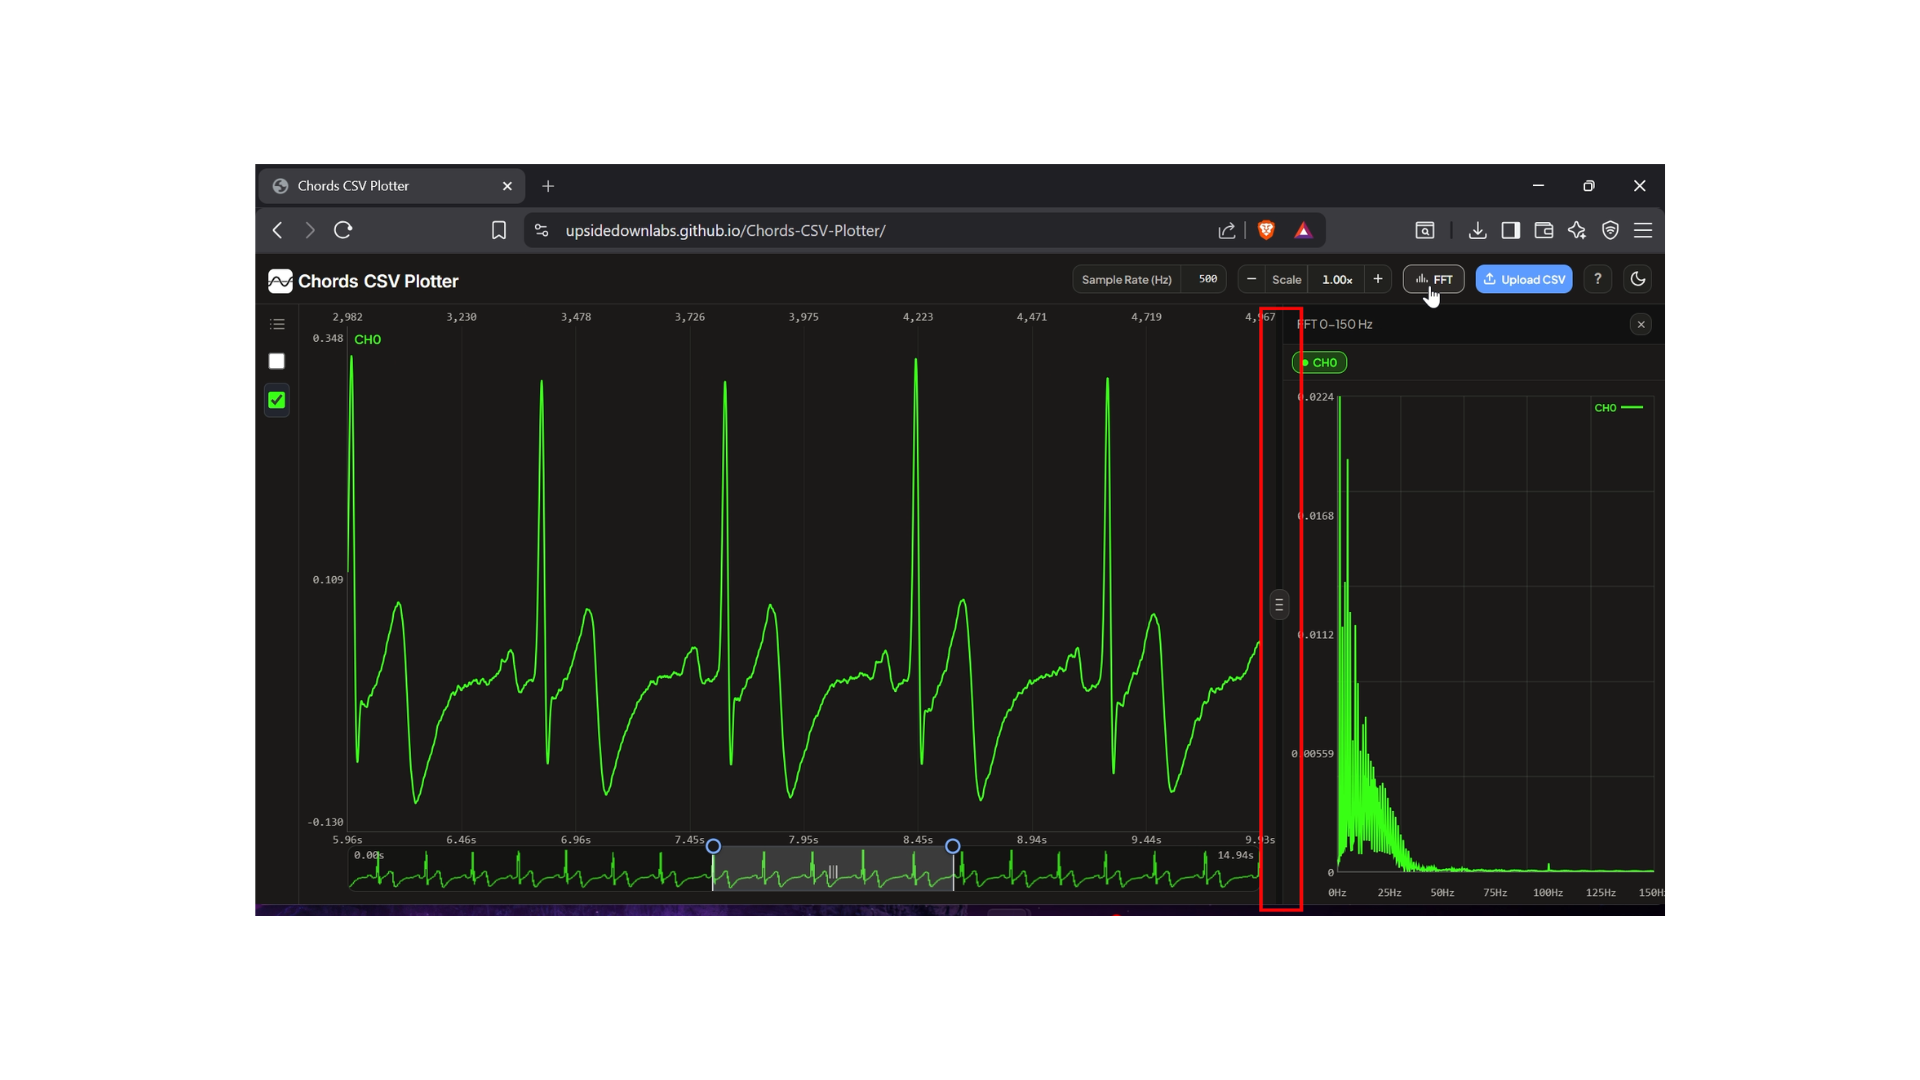
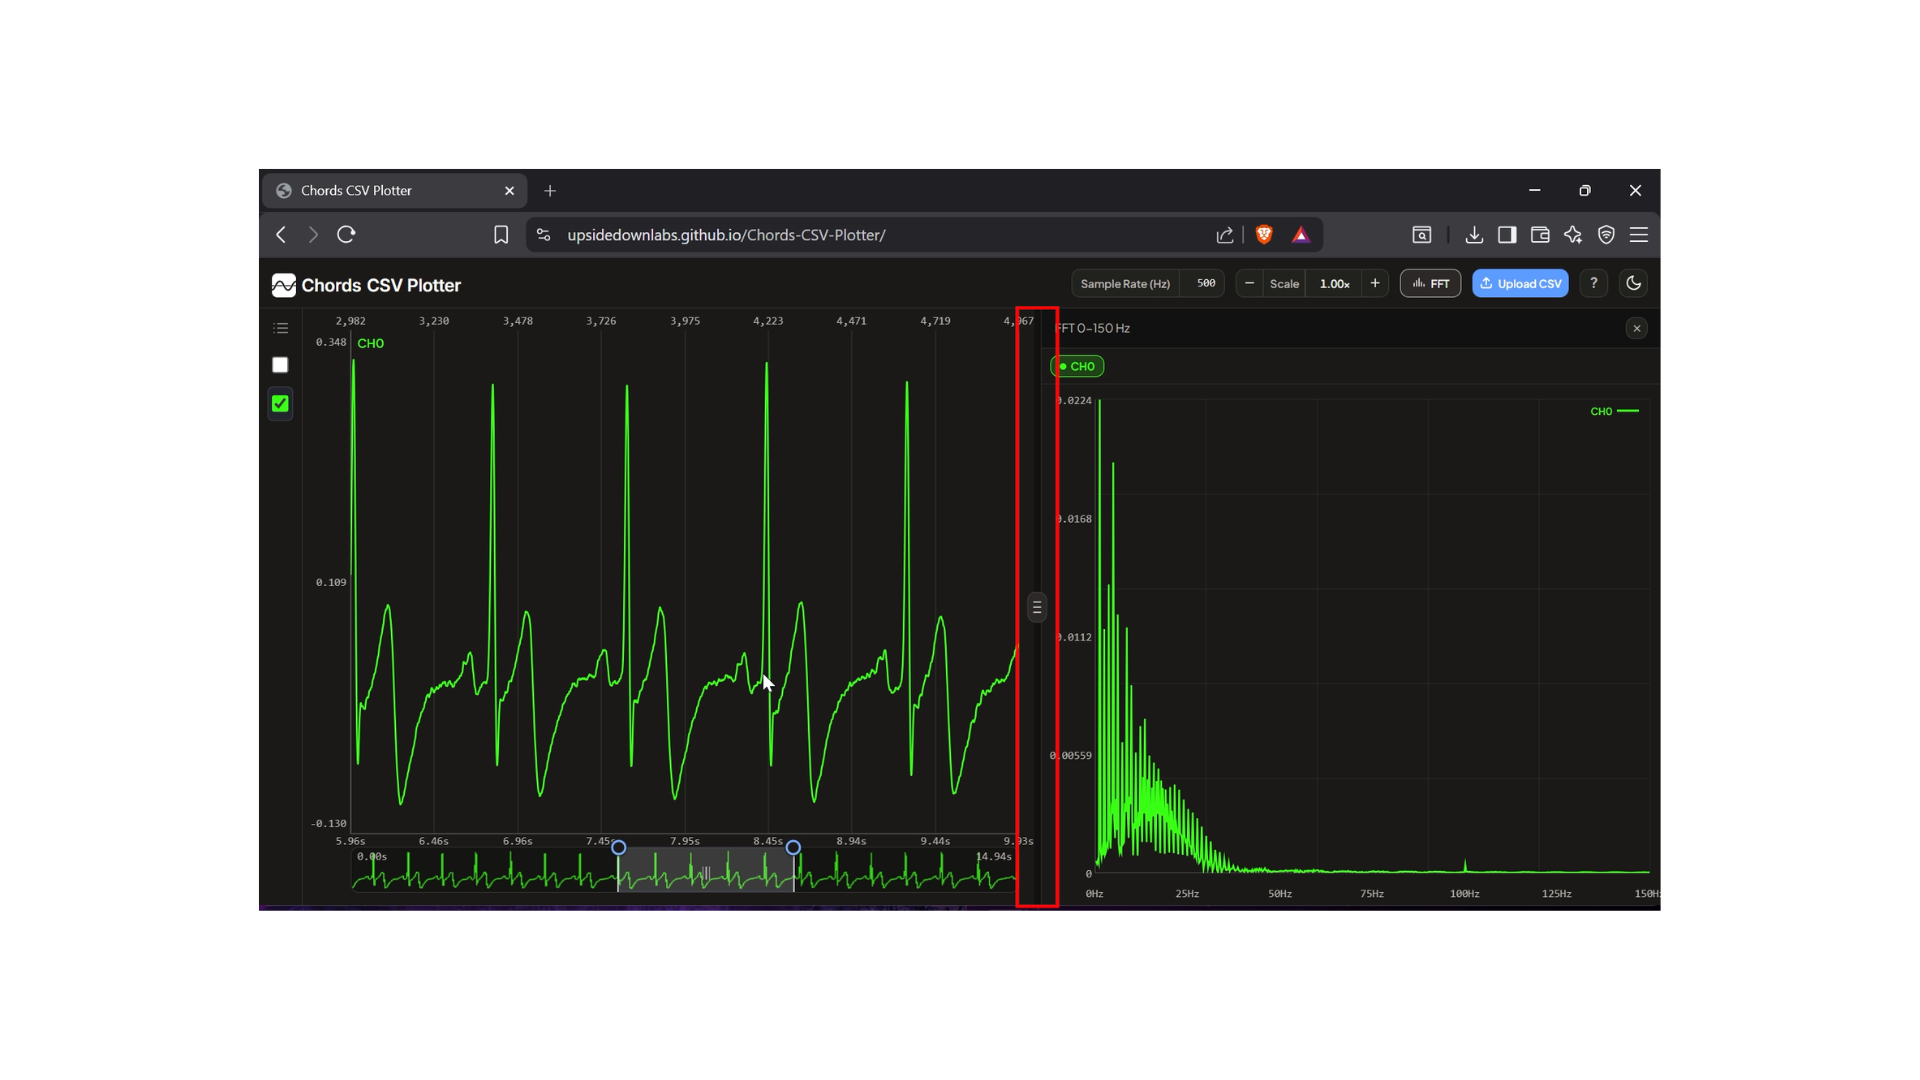
You can drag the panel borders to resize the plot and FFT Viewer.
This lets you create more space for whichever view you need
Change the Theme
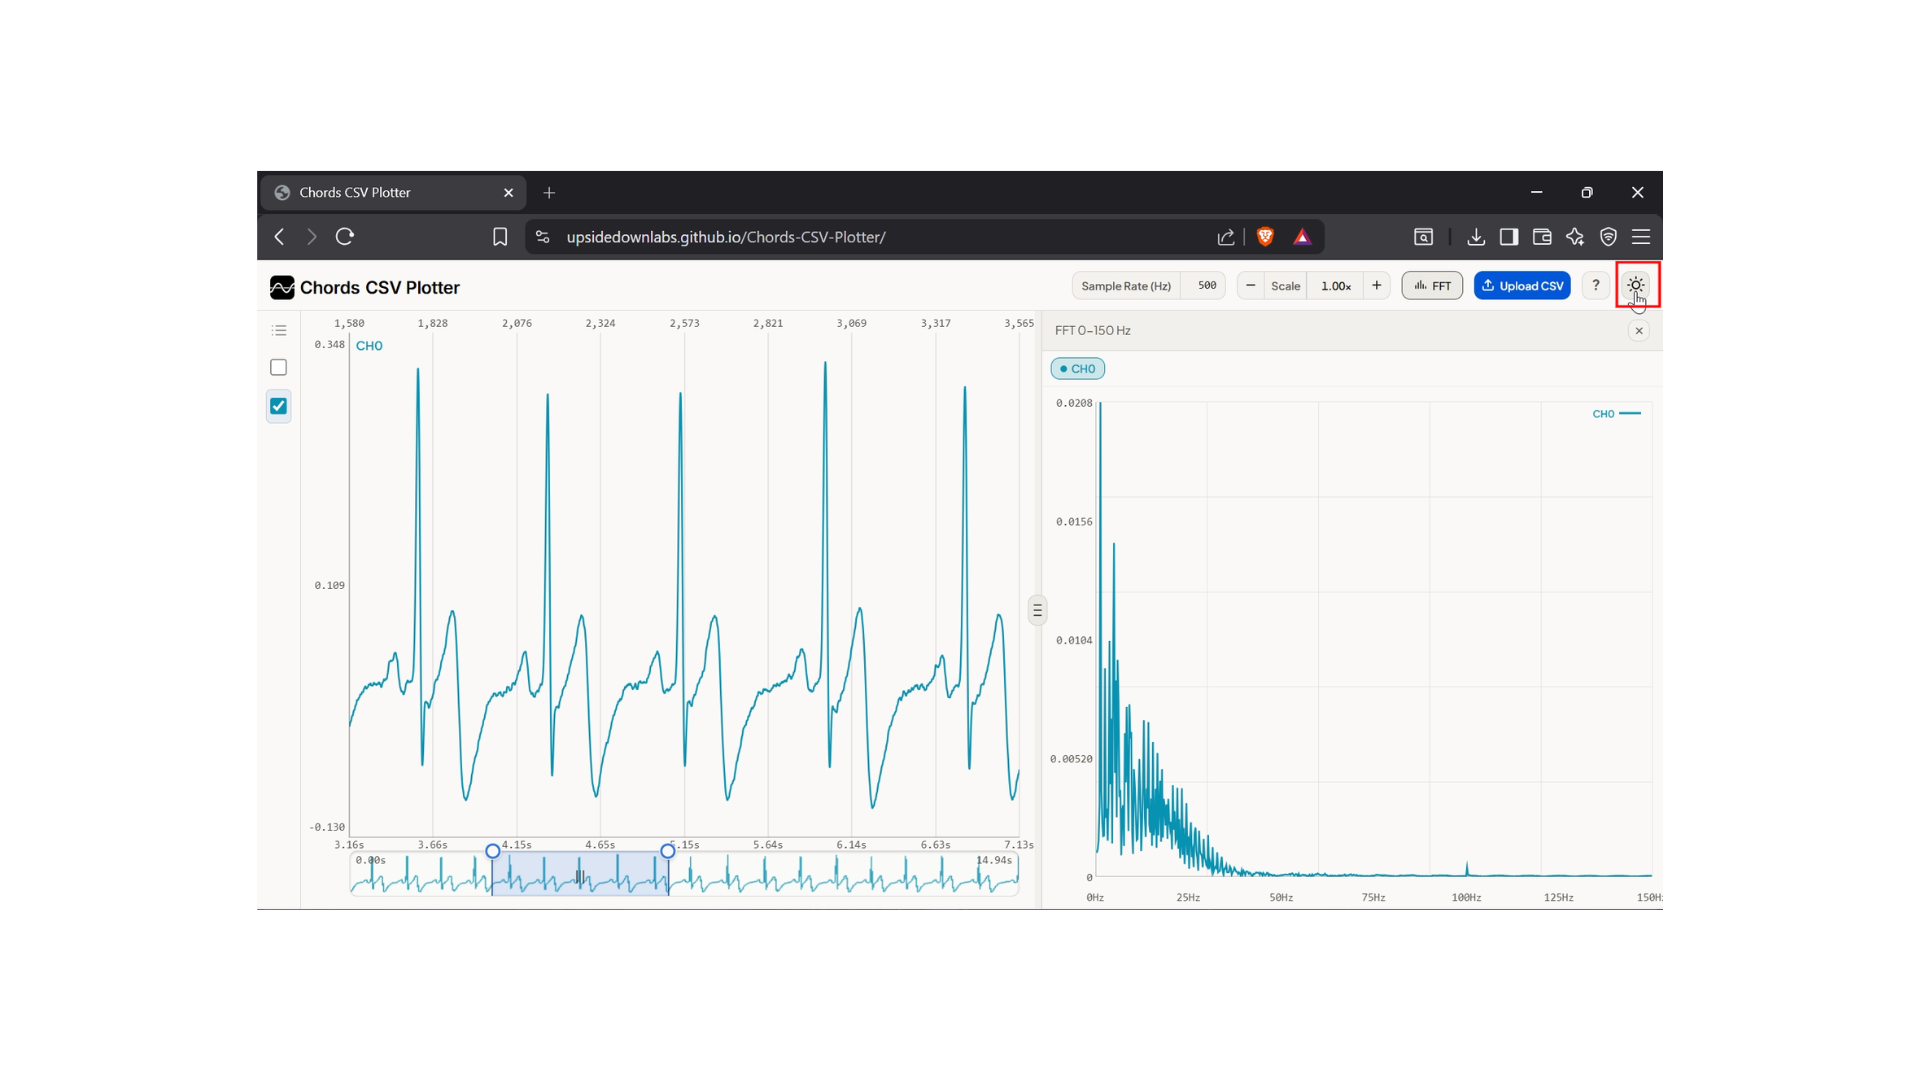
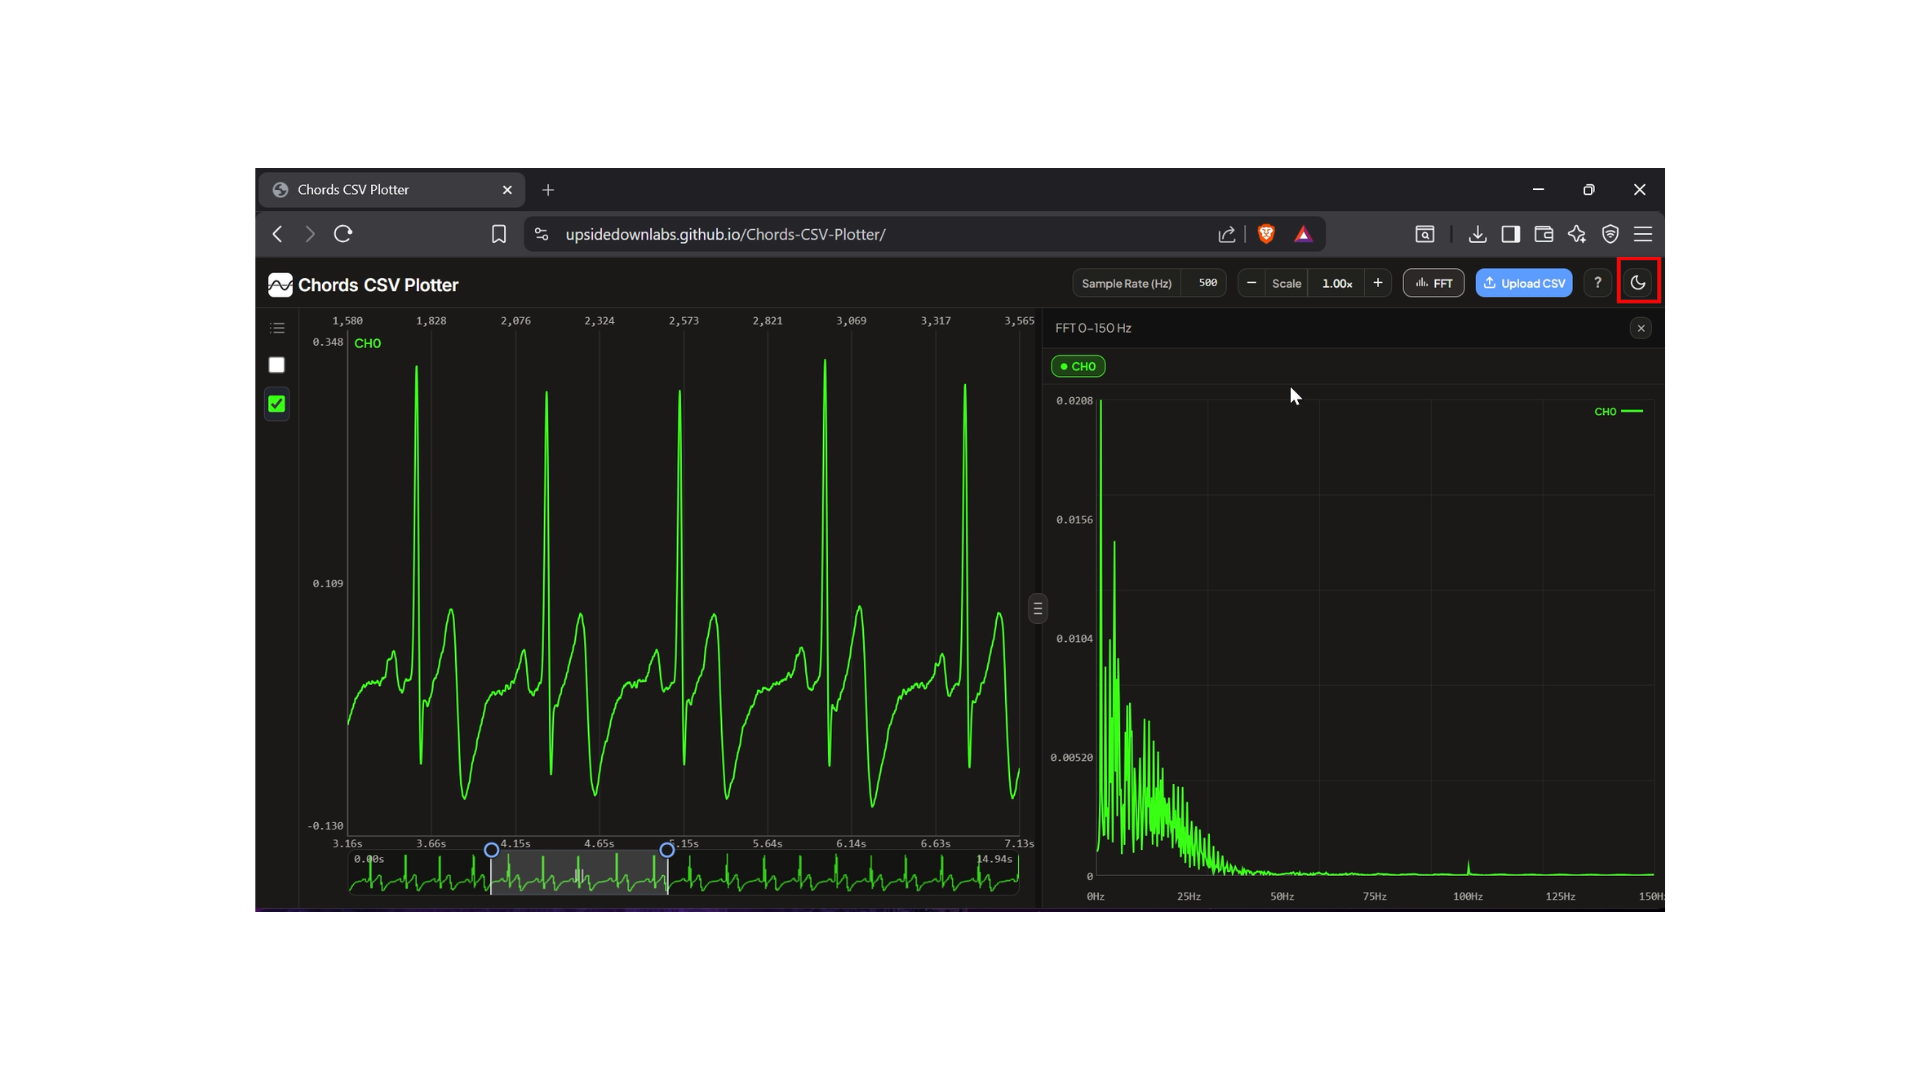
Click the Theme Toggle button to switch between Light Mode and Dark Mode.
Choose the theme that is most comfortable for you.
Conclusion
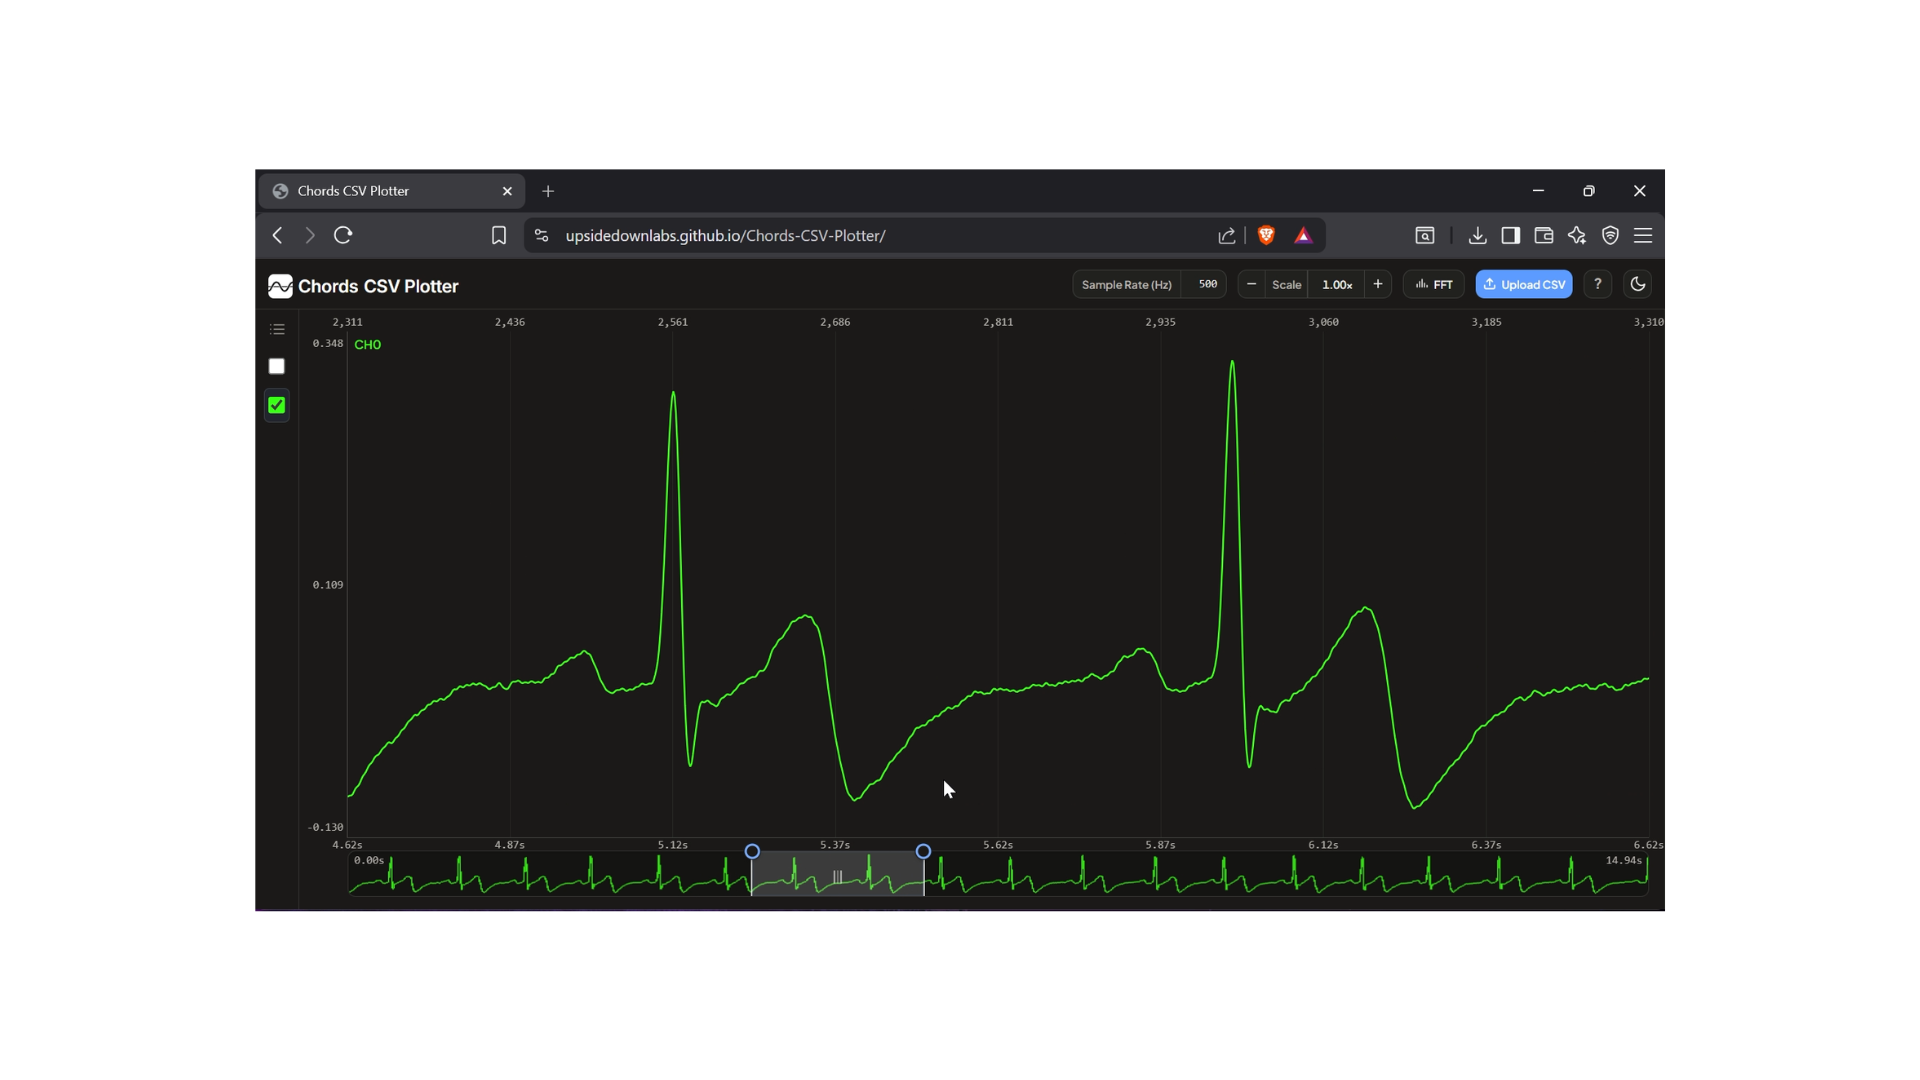
Chords CSV Plotter is an easy-to-use tool for viewing and analysing time-series CSV data directly in your browser.
With features like channel selection, zooming, timeline navigation, and FFT analysis, you can quickly explore your recordings without installing any extra software.
Whether you're working with biosignals or other sensor data, Chords CSV Plotter helps you understand your data faster and more easily.
Happy plotting!
Video Tutorial

Watch the complete step-by-step tutorial on YouTube