Water Rocket Forces and Motion -- Analysis and Modeling (Mr. Stapleton's EHS Physics 200)
by mrstapleton in Teachers > 9
2196 Views, 5 Favorites, 0 Comments
Water Rocket Forces and Motion -- Analysis and Modeling (Mr. Stapleton's EHS Physics 200)
The purpose of this project is to reinforce what you're learning in class with something real, hands-on, and fun. I want you to have something to remember years from now, when you reminisce about high school physics. Real science can be way harder than textbook science, but I will be there to help. :-)
There are two parts to the project:
- The contest, where you attempt to earn glory, donuts (or the equivalent), and maybe some extra points by building a rocket that stays in the air the longest; and
- The analysis, where you earn your grade. You will use the data we collect to analyze motion, calculate forces, and create numerical and graphical models of your rocket's behavior.
Don't worry! If you scroll down the page, it probably looks overwhelming. That's because I have tried to provide all of the information you may need. If you know what to do, you can skip a lot of the directions -- especially the parts that are meant mostly for the teacher/organizer. Just make sure you complete the graded items correctly.
Basic Rocket Requirements: Your rocket must go relatively straight up, in a controlled manner, and a parachute must deploy on the way down. At the very least, something needs to happen on the way down to markedly slow its descent. Your rocket must be powered by tap water and no more than 100psi compressed air, and it must be compatible with our class launcher (Pitsco Aquaport) -- unless you provide your own launcher.
Grading: is out of 120 points. After initial grading, you will get one chance to fix and resubmit your project for a re-grade. I will provide resources to help you on the second time around.
- Water Rocket Data and Calculations, Sheet 1 = 20 points (1 for each green or blue cell; 5 for the red)
- Water Rocket Data and Calculations, Sheet 2 = 70 points (1 for each cell)
- Motion Graphs: 30 points (1 point for each of the 8 "moments" on all three graphs; 6 points for satisfactory labeling values of peaks, troughs, and flat lines).
- +1% for the top team in each class; +3% for the top team overall
Supplies
- Basic Water Rocket Building Materials:
- At least two 2-liter bottles
- Duct tape
- Weights -- about 50 grams. These could be rocks, dead batteries, pieces of rebar...
- Cotton Twine
- Plastic drop cloth
- Hot glue guns and glue
- Scissors
- Utility knife
- 1/8" plywood
- Scroll saw or laser cutter
- Stapler
- Other things? PL Premium adhesive, if some of you want to bring in your own bottles to splice
- Launching and Data Collection Supplies:
- Launcher -- We will use an older version of the Pitsco Aquaport
- Lip balm -- in case the "plug" won't fit in a rocket; you can lube it with the lip balm.
- Bicycle pump or air compressor (and a backup, just in case). For many fast launches, it's nice to have a generator and a compressor, so you can launch quickly in a wide-open safe space.
- Launcher "shims" -- plywood for leveling or tilting the launcher into the wind
- Safety glasses -- for the pumper and anyone else close to the pressurized rocket
- Helmet and hearing protection -- if students are splicing multiple bottles together, you are likely to have some explosions.
- Wire "staples" for securing the launcher
- Funnel and extra bottles filled with water -- for a possible 2nd launch
- A note card for each student who is launching, with their name written clearly in black Sharpie.
- Two cameras:
- Camera set to slow motion video (and freshly restarted, if it is an iPhone) for documenting launch acceleration, velocity, and position
- 2nd Camera, set to regular speed video, for capturing the entire flight duration
- One camera holder/tripod to hold the slow motion camera motionless.
- Timers -- for timing the flight to apogee.
- A calibration pole -- a long stick with a known length marked clearly with tape (for scaling in the analysis software). This pole is going to be pounded or pushed into the ground, so design it for that. I sharpen the end. You can also add an extra cross-piece near the bottom to facilitate pushing or pounding.
- Duct tape -- for fixing stuff
- Multi-tool -- for fixing stuff
- Backup pressure gauge and teflon sealing tape
- Local weather app, like Weather Underground
- Wagon for hauling stuff.
- Container for trash.
- Video analysis software: we will use Vernier Video Analysis. I will give you our class link in Google Classroom.
- Rocket Flight Modeling Spreadsheet Templates:
- Water rocket Data and Calculations: for data collection and calculations
- Y Dimension Projectile Trajectory With Drag: for modeling the flight after thrust and until apogee. You will also use this for other purposes.
- Water rocket design help links
- Clifford Heath's Water Rocket Simulator -- I find this most useful for deciding how much water to try. I think there's something funny about some of his numbers -- particularly drag at burnout, which seems too low to me. Otherwise, his time aloft, maximum altitude, and crashdown speeds match our model pretty well.
- US Water Rocket Splicing Video (for making larger volume fuselages)
- Burst testing procedures by Air Command Water Rockets
Make a Rocket That Deploys a Parachute [For Students]
[**2025 post-project note to self -- make successful parachute deployment a strict requirement. The analysis is not as educational without the parachute. Students whose parachutes fail must come in for extra launches.]
This is a simple, time-tested design. The best way to get the full picture is to watch the short overview video. You can copy this design exactly, you can modify it, or you can make something completely different.
The coolest thing about this design is that there is absolutely nothing except air pressure holding the nose cone on to the body. As the rocket takes off, the fuselage "drafts" behind the nose cone like a Prius behind a semi. Until the rocket slows down at its apogee, this low pressure pocket stays intact, sucking the fuselage along. When the onrushing air stops, the effect ends and there's nothing holding the two parts together. If there's even a very slightly snug connection between the nose cone and fuselage, the rocket is likely to return to the Earth the way it went up.
Here's a link to my water rocket construction playlist, which contains all of these videos in order, plus the most popular video I've ever made.
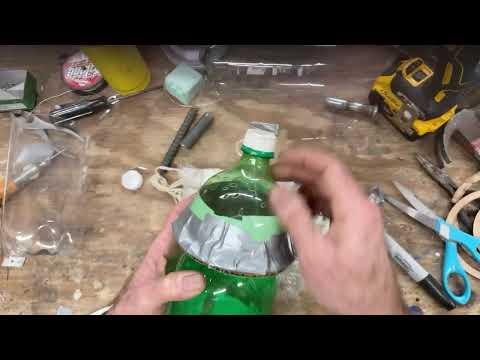
- Get two 2-liter bottles. At least one should have smooth, straight sides.
- Use the smooth bottle to Make Fins and a Nose Cone. I started to write step by step directions here, but this is much easier to understand with pictures or a video, so for now, watch this video from class. Make sure that you watch the part about the staples at 8:10.
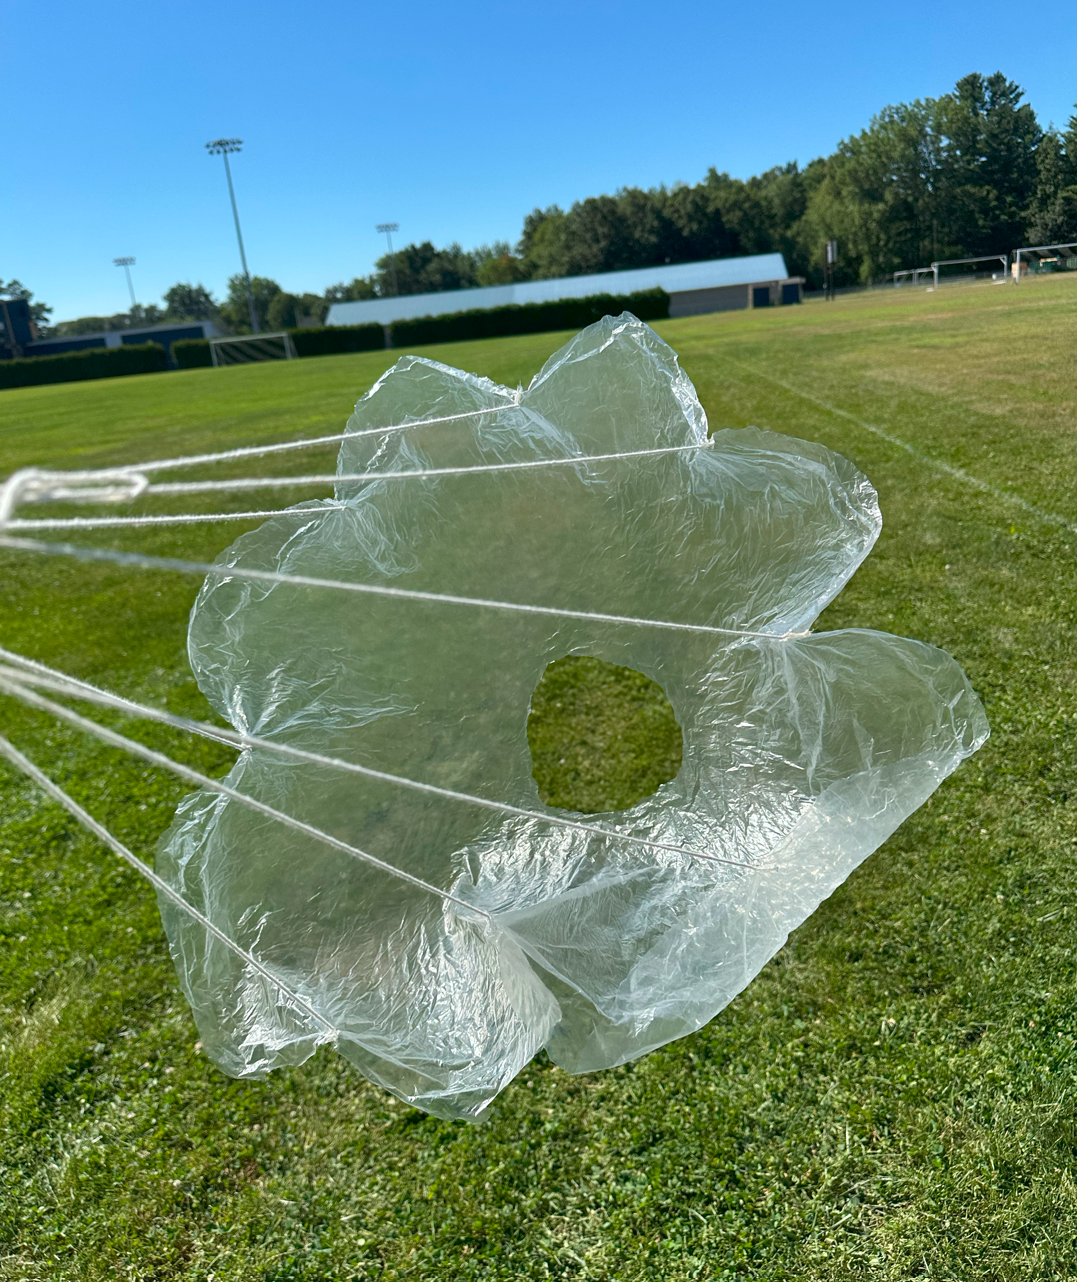
- Make a parachute. And make sure that it will fit loosely inside your nose cone. Again, a video is the easiest way to understand this process. You don't have to add a pilot chute like I do in this video, but I think it makes your parachute deployment more foolproof.
- Attach the Fins to the fuselage and the Flange to the nose cone. Here's the video.
- Attach the nose cone platform and parachute. Here's the video.
- That's pretty much it, but...
- If you want to start thinking about how much weight to add to the tip, and how much water to put in it, Clifford Heath's Water Rocket Simulator is a good starting place.
- If you want to try splicing bottles to make a really big one, this US Water Rocket Splicing Video will show you how. I can bring in some PL Premium. You have to supply the extra bottles.
Pre-Launch Procedure -- Mass, Water Volume, & Atmospheric Data Collection [For the Teacher]]
- Mass your dry rocket. Record this mass on sheet 1 of your Water Rocket Analysis and Calculations spreadsheet.
- Measure the amount of water that you add to your rocket. Also record this on sheet 1 of your Water Rocket Analysis and Calculations spreadsheet.
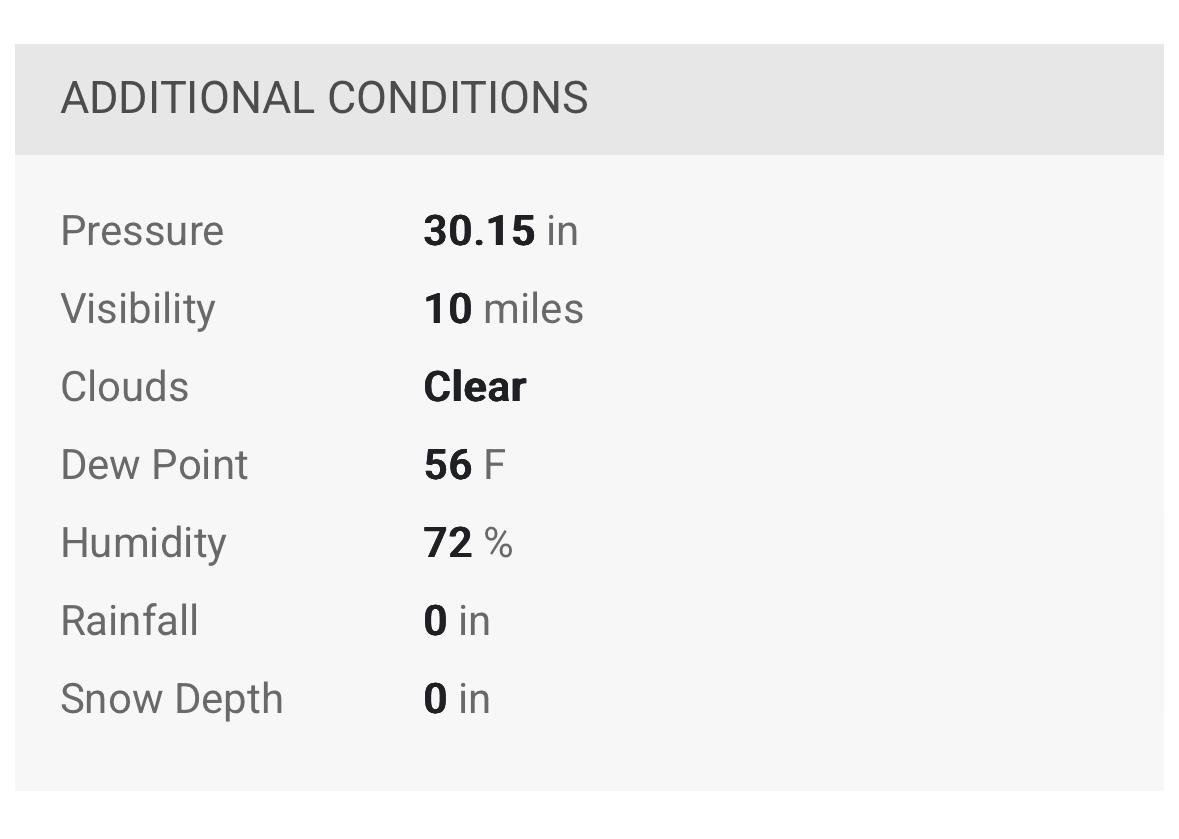
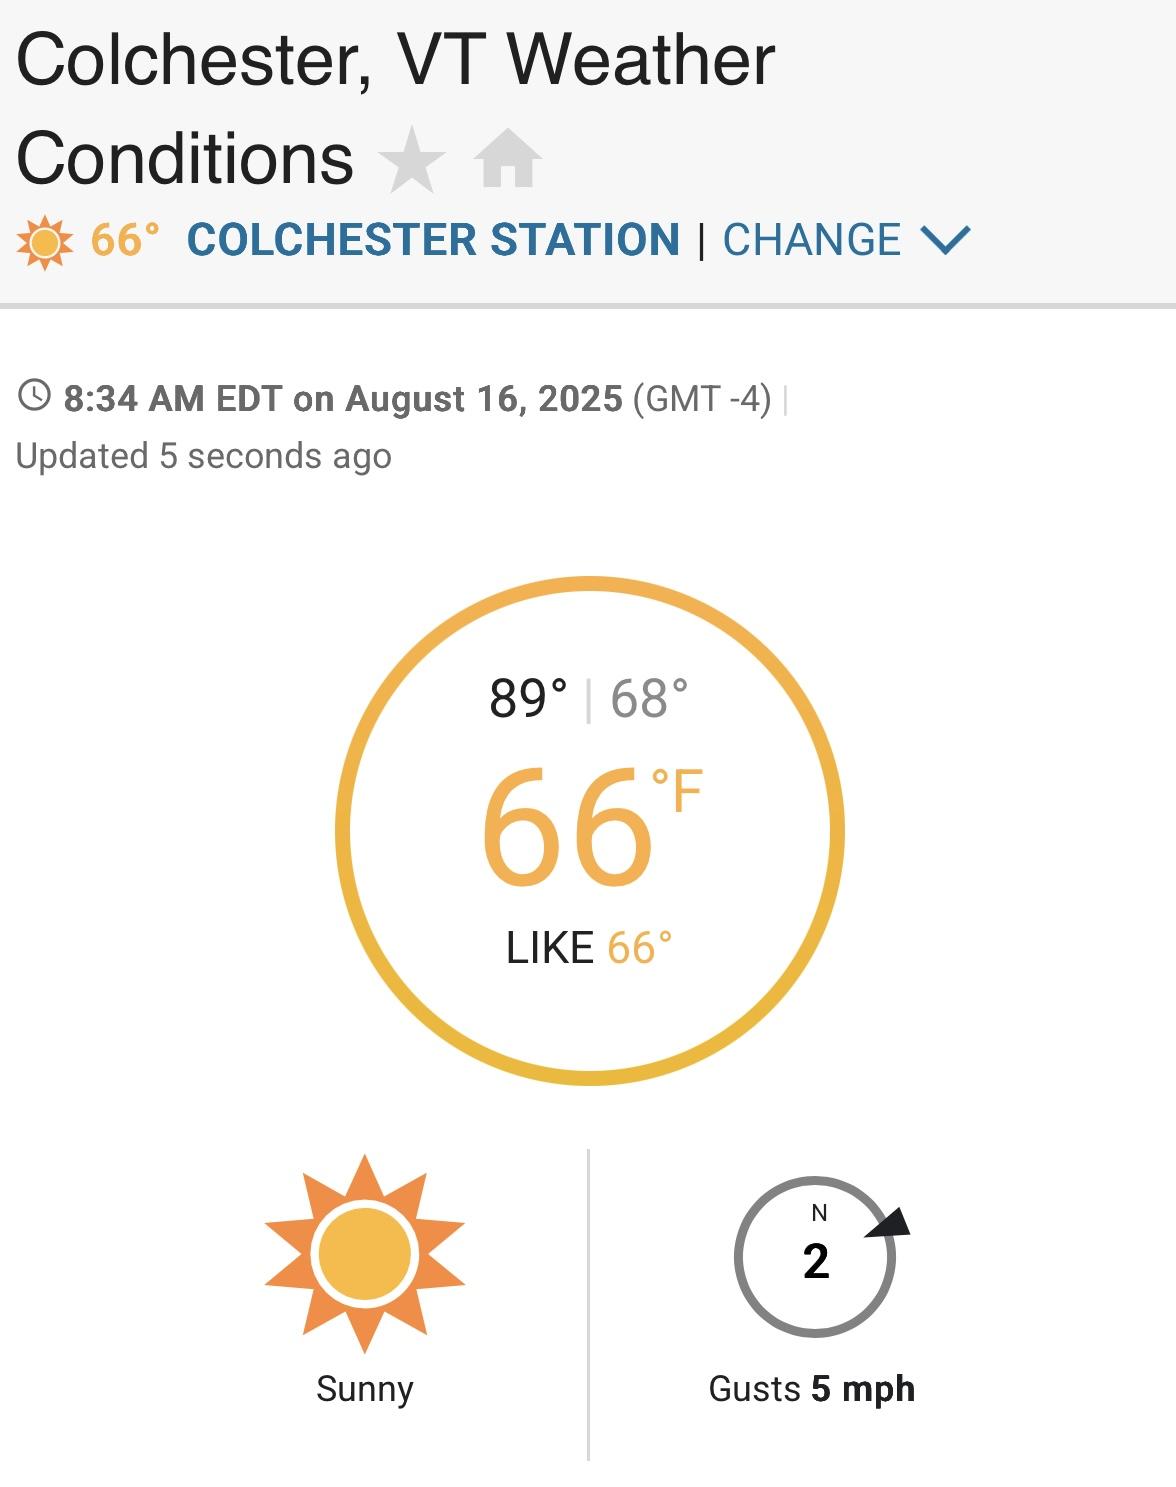
- Collect Atmospheric Data: This step can be completed just before, during, or after the launch. It probably isn't super-important, but if we are going to accurately determine drag coefficients, we need to know the density of the air the rockets are flying through. Here's my suggestion:
- Open up a weather app, such as Weather Underground and take screen shots of these three current conditions in your area:
- Temperature
- Air pressure
- Humidity
- Later on, you can plug those values into an app like the Omni-calcuator to calculate air density.
- [If you want to do a trial run, use my screenshots from above and see if you get the same density I did -- 1.21085kg/m^3.]
Launch Procedure -- at the Launcher [For the Teacher]
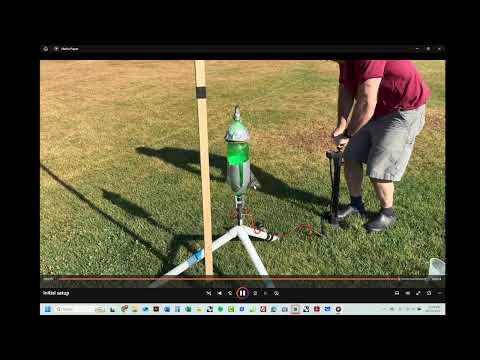
- Set up the launcher in an open field, far from anything that can be damaged by a falling rocket.
- Note the position of the sun and decide where the spectators will stand. Spectators should stand at least 10 meters away from the launcher with the sun at their backs. Otherwise, the sun will blind them and they won't be able to see the potentially dangerous rocket.
- Push or hammer the calibration pole into the ground next to the launcher. Position the pole so that it and the rocket will be the same distance from the spectators.
- Have the first team bring their rocket to the launcher, upside-down and with the bottle cap off.
- Insert the pressure hose plug with the rocket upside-down. If it won't go in, lube it with some lip balm. Engage and lock the launcher jaws.
- Anyone close to the pressurized rocket (within 10m or so) should wear safety glasses, just in case the rocket explodes. If you're worried about a rocket, you can pressure test it (*see step at and) ahead of time.
- Pump a small amount of pressure into the rocket, just until you see it shift slightly and then lock firmly against the jaws. Rockets often wobble and tilt during this initial inflation period. I always adjust them after they "lock in." It is at this point that a poorly-spliced rocket usually explodes or begins to leak.
- If needed, adjust the tilt of the rocket by placing plywood "shims" under the launcher legs.
- Stake the launcher legs with "staples" of wire bent into a "U."
- Inflate to 90psi. [When we bought the launcher, it was limited to 80psi. That part broke. Except for bottles that were compromised or bottles that were not meant to contain carbonated drinks, I have never had a bottle explode at 90psi in my 29 years of launching water rockets. 100psi is probably okay, too.]
- Confirm that everyone's camera is rolling and then have the trigger person begin a clear countdown.
- Loudly call out a 3-2-1, and then GENTLY pull the launch cord. A hard pull might yank the launcher over. Years ago, when I taught middle school a student (in another teacher's class) yanked the launcher over, and the rocket put the teacher in a wheelchair for two weeks. The stakes should prevent this, but a hard pull is still unnecessary and potentially damaging to the launcher.
- Keep your eyes on the rocket and get out of its way.
Launch Procedure -- Regular Speed Camera Responsibilities [For the Teacher]
There are main jobs of the person who is recording regular speed video:
- Start the video by zooming in on the person launching the rocket. This will serve as a record of the launch order.
- Record the entire flight so that we can see who won. This video can also be used to determine the time at which the parachute deployed.
These videos don't take up as much memory as slow motion videos, so trimming them is not as important. But if you do plan on trimming them, first go through them all and write down the launch order (who is launching each rocket). This order can be used with the slow motion videos, so that camera person does not have to bother with capturing the student launching the rocket.
Launch Procedure -- Slow Motion Camera Responsibilities [For the Teacher]
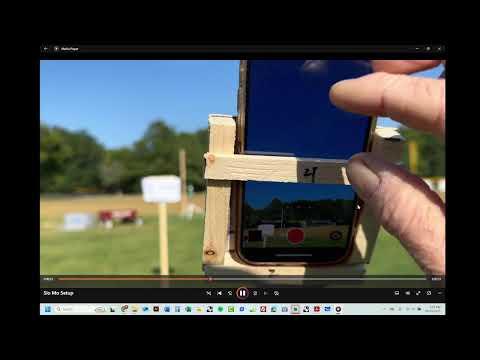
Thrust only lasts about 0.05 seconds. Your job is to create a slow motion video (trimmed to minimize file size) that will tell us:
- The rocket's starting position, relative to the ground
- The rocket's position at the end of the water thrust phase
- How long the water thrust phase lasted
- The rocket's position when it stopped accelerating upward (until the end of air thrust)
- How long the rocket accelerated (until the end of air thrust)
- The rocket's velocity at the end of upward acceleration
What to do:
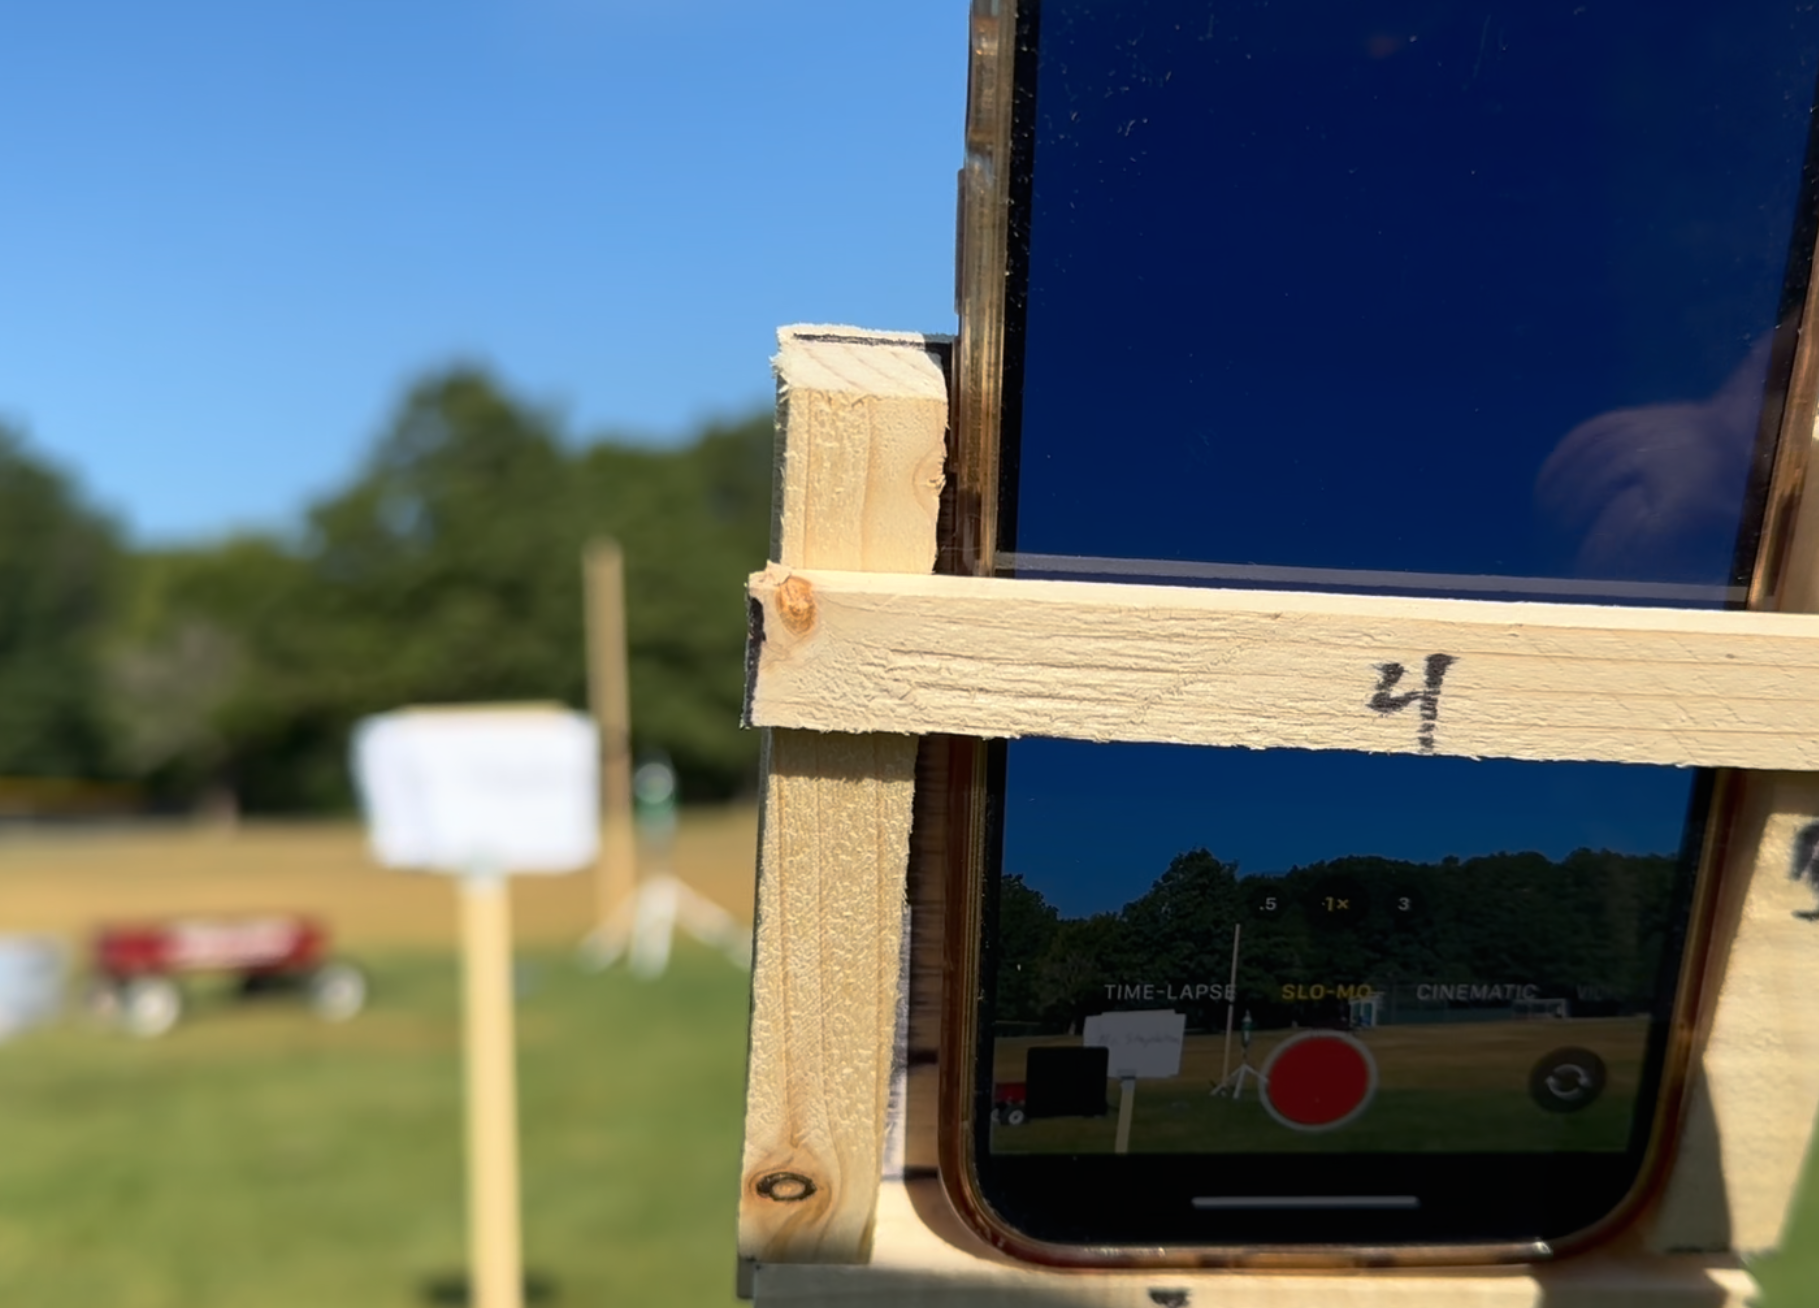
- Position the camera approximately 10m from the launch pad. Confirm that the camera is set for slow motion. [If it is an iPhone, you should shut it down and restart it before recording any videos. Otherwise the frame rate may not actually be 240fps.]
- Holding the camera in portrait mode, adjust the field of view. The field of view should stretch from the ground beneath the launcher to a point approximately 6m above the ground (to be sure to capture the full thrust phase). Portrait mode is best as long as your video analysis software doesn't turn it sideways. You goal is to be as zoomed in as possible without missing any of the rocket's acceleration.
- Start the video. Confirm that it is going, and call for a short countdown from the launcher, keeping the camera motionless and the card in the picture.
- Keep the camera motionless until the rocket has passed out of the field of view.
- Stop the video.
- Later on:
- "Edit" the video:
- Trim off the parts before and after rocket movement is visible [to keep the file size small for easier sharing and loading]
- Stretch the slow motion portion to span the entire video
- Upload all of the videos to a shared folder in Google Classroom. If you know the density of the launch air, include it in the folder name for safe keeping.
Launch Procedure -- Timer Responsibilities (Full Flight Data Collection) [For the Teacher]
[**2025 Post-project note to self -- we need to return to collecting these data with a video. We gave up on this because the camera operators couldn't handle the complication. Next year we will keep it simpler -- a camera will be on a tripod 70m from the launch area, with the launcher in the bottom of the field of view. The camera will be kept running until the rocket leaves the field of view. The rocket will be small, but we should be able to see it well enough to get time to apogee and parachute deployment position/time.]
My original plan was to use a camera to capture this data. That would have been more precise, but it was just too much for the camera people (including me) to handle in the heat of the moment.
The details
- For redundancy, at least three students should collect these data.
- Each student data recorder needs a stopwatch with a lap function.
- Timing
- Stand at least 50 meters away from the rocket, with the Sun at your back.
- Start the timer when the rocket launches.
- When the rocket reaches its apogee, press "lap."
- When the parachute fully deploys, press "lap" again.
- When the rocket touches down, press stop.
- If you're using a smartphone, take a screenshot at this point, as a data backup.
- Record the following [and the owners should transfer this to the "full flight time data" section of the water rocket data sheet]:
- Rocket owner's name
- Time to apogee
- Additional time to chute deployment
- Total flight duration
Thrust Phase Video Analysis and Calculations [For Students]

Thrust Phase Video analysis and Calculations: When you see bold font in the directions below, Record the data in the "Thrust Video Analysis Data" section on sheet 1 of your "Water Rocket Data and Calculations" spreadsheet. Here's the spreadsheet template. The numbers below correspond to the numbers on the worksheet and spreadsheet. You may find it useful to print a paper copy of the spreadsheet.
- Download the water thrust video to your device. Pay attention to where it goes, so that you can open it in the app.
- Open the Vernier Video Analysis App. The link is in the “general” folder in our Google Classroom.
- In the app, “Import” your video.
- Click “system” and then “scale,” and stretch the two dots to span the tape marks on the calibration pole. Type distance between the marks, in meters.
- Still in the “system” settings, click “origin,” and…
- Move the origin to a point on the ground directly below the rocket.
- Next grab either the x or y axis and rotate the system so that the y axis is parallel to the rocket’s path.
- This app does a pretty good job of measuring distances, but it does some screwy things with time, so we're not even going to worry about setting the video frame rate, but do enter the video frame rate on your data sheet. Ignore any times or velocities that you may see in the graphs!
- First we will get the water thrust data:
- Click “add.” Then move the slider until you see the rocket just begin to move.
- Drag the crosshairs to the top tip of the rocket and click.
- One data point should appear (see screenshot), and its x and y position should be visible in the growing “data set.” Record the starting height (initial y position) of your rocket’s tip, above the ground. The app records time but in the past the time has not been precise enough, so we will be calculating time for points after time 0s.
- If your data are in a graph rather than a table, select the display icon in the top right, and switch “data table” on and “graph” off.
- Record the Y position from the data table and record the current frame number from the frame counter below the video slider. To be certain that you have the right frame number, use the single frame button to reverse the video a little, then advance one frame at a time until your data point appears in the video. Check the frame number.
- Skip forward with the single frame advance button until you see the big puff of air indicating that the water is leaving and air is hitting it. This is the approximate end of water thrust. Record both the "Y position at end of water thrust"and the "video frame number." Again, ignore the time in the table. In the past it has not been precise, so we’re not trusting it
- Now we will find the maximum velocity (end of air thrust)
- Go back to the moment of launch and fill in the points that you skipped. If you can't tell exactly where the rocket's tip is, because the dots cover it up, take your best guess and click there. Continue until you think the rocket is finished accelerating.
- Still in Vernier Video Analysis, go to the data table. Select all of the Y Position data (by dragging down), and copy it. Paste that data into cell G15 of your Water Rocket Data and Calculations Spreadsheet. Then enter your frame rate into cell G12. This should give you a graph of velocity. There will probably be some outliers, because of the bugginess of this process. Ignore them and estimate the max velocity. This is Vy max. Record it.
- Use the data in columns G, I, and J to estimate the time and y position corresponding to the max velocity. Record Y position and time at end of water thrust.
- You're done collecting data. Now transfer your data to the spreadsheet (template link above) and complete the calculations in the green, turquoise, and red cells. When you're done, get your answers checked by the teacher.
Full Flight Video Analysis [Students]

- Download your full flight video.
- Open the video in Vernier Video Analysis.
- For our purposes here, the time information provided in the video controls of the app is precise enough. Open your video in the app and use the slider to check the times at the beginning of launch and the moment of touchdown. Subtract to get the full flight time. Enter this into the "Rocket touches ground" cell. of your "Water Rocket Data and Calculations" spreadsheet.
- Hopefully someone timed your rocket's flight to apogee -- and hopefully they did a good job. Enter this number in the cell above the touchdown time cell. If you suspect that whomever did your timing was very inaccurate, its okay to change this time to make it more reasonable. [If we had video footage of your rocket from far away, we could get a precise number, but operating the distant camera was just too difficult.]
Create a Spreadsheet to Model Coasting Flight With Drag [For Students]
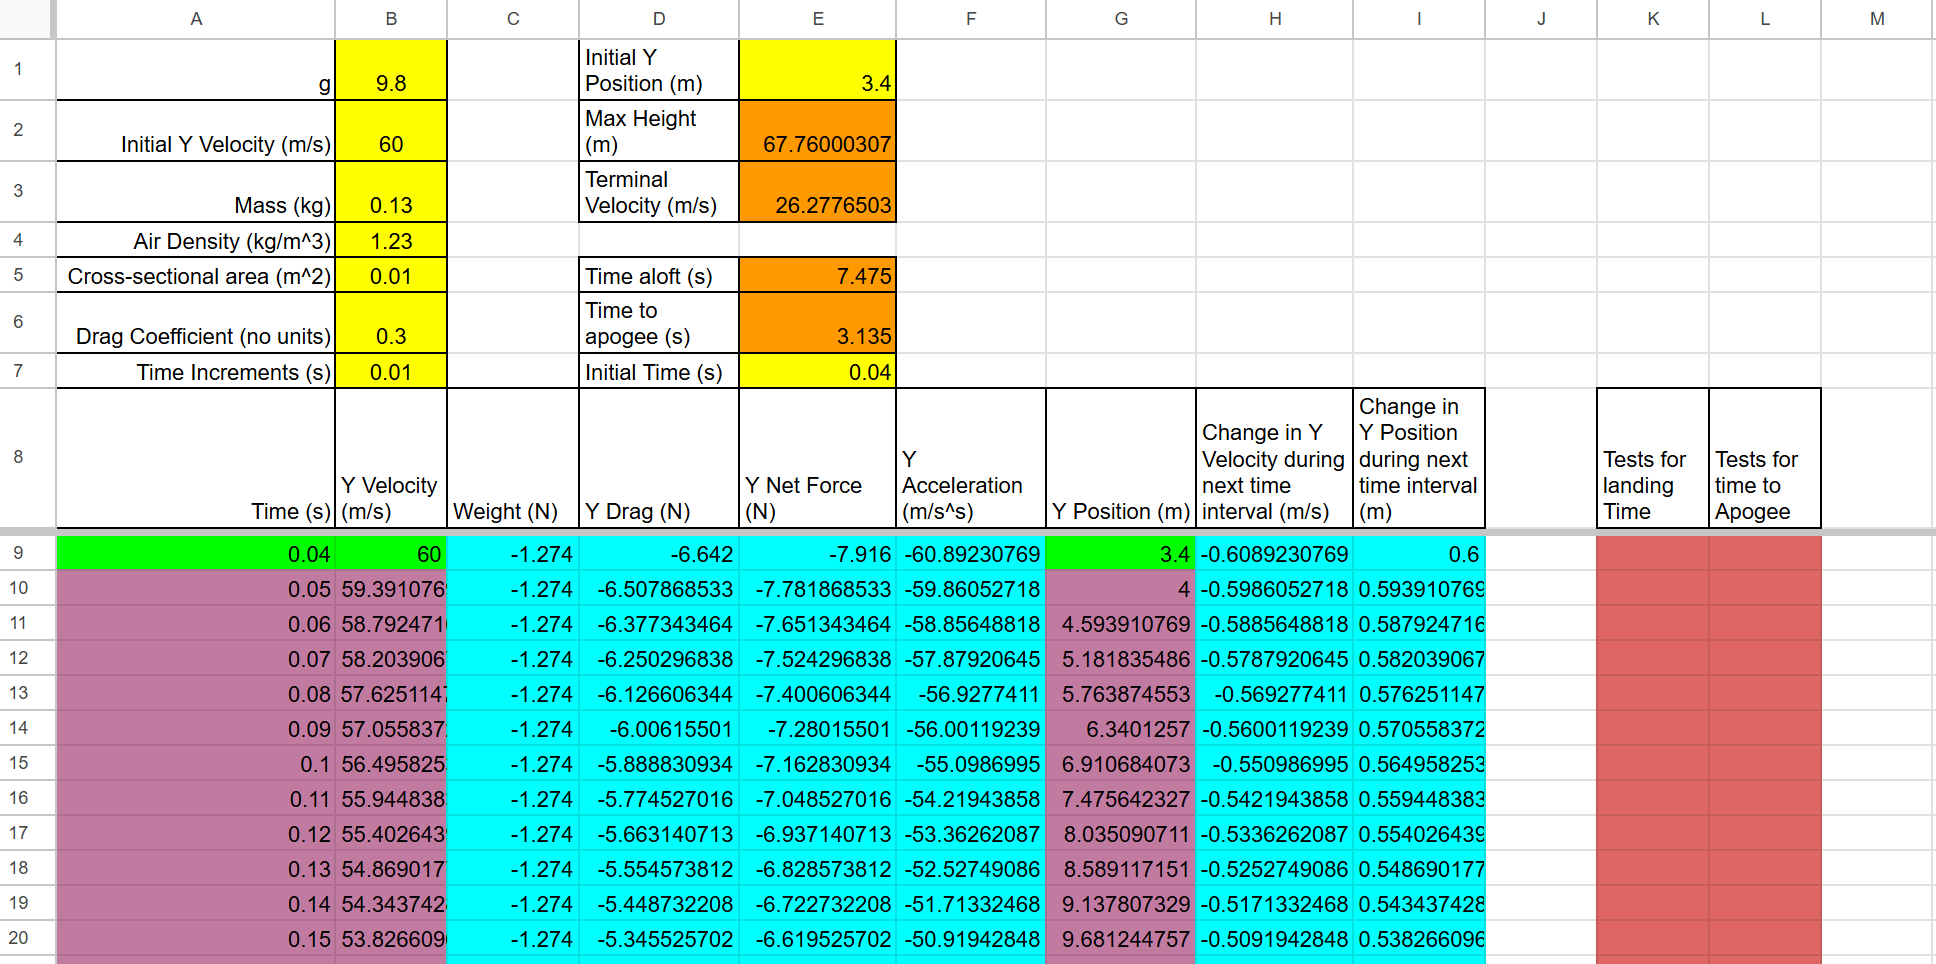

"Coasting" is what you do on a bike when you stop pedaling. Coasting is what these rockets do when they stop exerting thrust. Make a copy of the Y Dimension Projectile Trajectory With Drag spreadsheet template. This spreadsheet models the flight of a projectile traveling up and down in the Y dimension only. It will be very useful for modeling your rocket's flight from the end of air thrust until soon after the rocket reaches its apogee. You will use it to estimate your rocket's maximum height and drag coefficient. With some tinkering, it can also be useful for modeling the descent.
You can figure this out all on your own, or you can follow my directions, below. Or you can follow along with me as you watch a video of me entering the formulas. Regardless of which approach you take, you should check your progress as you go by looking at the attached answer key (make sure your yellow inputs are the same as mine). It's easier to pinpoint problems if you check as you go, rather than trying to do your debugging at the end.
**If you're wondering why the layout is a little strange, it's because I changed some things after I had already written most of these directions, and I didn't want to rewrite them all. :-)
First, the easy, green cells
- For the starting time, in cell A9, enter the formula "=E7" to grab the initial time from up above.
- For the starting y velocity, in cell B9, enter the formula "=B2" to grab the y velocity from up above.
- Same for the starting y position (G9). Enter a formula to take the initial y position from above.
Now the turquoise cells...
- First, if you don't know what dollar signs (absolute cell reference) do in spreadsheet formulas, you should look it up or watch my video. For this spreadsheet, the simple rule is that you should just put them before every row number above row 8 on the spreadsheet -- and not before any row number below row 8. For example, you might want to enter the formula "=E9/B$3" because 9 is below row 8 and 3 is above it.
- Weight = mg, but let's use "=-B$3*B$1" because weight is a downward (negative force).
- Drag is a tricky, so let's do it partway now, and fix it in a couple of minutes. Drag = 0.5*A*Cd*Density*v^2, so the basic formula in D9 should be "=-0.5*B$5*B$6*B$4*B9^2" Notice that only velocity does not get a dollar sign, because it's below row 8. Also, note that drag is negative because it is initially downward.
- Net force is simple, since this spreadsheet only applies to the coasting phase -- no drag. So the net force is the sum of drag and weight. Since both forces have the sign built in, we can just add them... "=C9+D9"
- Y acceleration comes from Fnet=ma. You can do this one. Solve for a and make sure that the mass gets a dollar sign, because it's above row 8.
- Skip Y position for now, and move on to "change in y velocity during the next time interval." Since acceleration = (change in velocity) / (change in time), change in y velocity = acceleration * change in time. "Change in time" is provided in the time increments cell, which you should enter as B$7. In your formula, use the acceleration you calculated in cell F9.
- Finding change in position is like finding change in velocity, except that you use the velocity formula ( v = change in position / change in time ).
- Now let's fix drag. The problem with our formula is that it's always going to give us negative drag, but when the rocket's velocity is negative (moving downward), drag should be positive (upward.) We need to use a conditional formula, like this "= if(logical test,value if true, value if false)". The test will be the current velocity (B9). If it's positive, drag should be negative. If it's not positive, drag should be positive. You can copy and paste what you already have to save time. Here's what it should look like... "=if(B9>0, -0.5*B$5*B$6*B$4*B9^2, 0.5*B$5*B$6*B$4*B9^2)"
- Now that the turquoise cells are done, we need to copy them down to the next row. The easiest way to do this is to select several of them at once and then grab the little "handle" in the bottom right of the selected cells and drag it down one row.
Now the "light magenta" (pinkish/purplish) cells...
- The time needs to move forward by one increment every row, so the formula in A10 is "=A9+B$7"
- The new Y velocity is the old Y velocity (from Cell B9) plus the amount that velocity has changed during the time interval (H9).
- Similarly the new Y position is the old Y position plus the previous change in y position.
- Now you can select all of the magenta and turquoise cells in row 10, grab their "handle," and copy them all the way down to row 1000. It will take a while.
Now the easy orange cells...
- Max height can be found with the "max" function. In Cell E2, enter the formula "=max(G9:G1000)"
- To calculate terminal velocity, you will need to solve for v. At terminal velocity, weight = drag, so set mg=.5*A*Cd*density*v^2, and solve for v. Then enter your formula, starting with an equal sign.
Finally, the cells that work together -- the remaining orange cells, and the red cells...
- To determine time aloft, we're going to use a formula in column K to look for rows late in the flight when the rocket is very close to the ground, and we're going to average those times together. First, in cell E5, enter the formula "=average(K9:K1000)"
- Now, in cell K9, enter "=if(abs(G9)<0.5,A9,""). This is checking the absolute value of the rocket's y position. If the rocket is closer than 0.5m to the ground, the current time (from A9) appears in this cells. If it is not greater than one, the two quotation marks with nothing between them ("") causes the cell to be blank.
- We will be copying the red K9 formula down to row 1,000, but first let's take care of finding time to apogee. Then you can copy the two red cells down together. In cell E6, enter a formula like the one in cell E5, except that the values to average will be in column L instead of column K.
- In cell L9, create a formula like the one in K9, but this one is a test for the rocket reaching its highest point. Ask yourself what value would tell us whether the rocket is reaching its highest point? Use that value as your test. You will again need to use the absolute value function, abs().
- Now select the two red cells ( K9 and L9) and copy them down to row 1000. If you scroll past rows 292 and 703, you should see the times appear.
Fit Your Coasting Spreadsheet Model to Your Data [For Students]

Your task here is to model your rocket's flight from the end of thrust until it reaches its apogee. First, you will plug your flight data into your "Y Dimension Projectile Trajectory With Drag" spreadsheet. Then you will do some guess & check with your rocket's drag coefficient and area until everything matches up.
[Some of you may also want to modify the spreadsheet to model the entire flight. To do that, you will need to add a mechanism for cross-sectional area and/or drag coefficient to change during the flight.]
First, transfer your data...
- Open your two spreadsheets: "Y Dimension Projectile Trajectory With Drag" and sheet 1 of "Water Rocket Data and Calculations."
- Do not make any changes to the "Water Rocket Video Data and Calculations" sheet. In the following steps, you will be finding data on that sheet and entering it into the trajectory sheet.
- "Time at end of air thrust," from your thrust video analysis data, is the initial time for the coasting phase. Enter it into cell E7 on the trajectory spreadsheet.
- "Vy max" from your thrust video analysis is the initial velocity for your rocket's coasting flight. Enter it into cell B2 of your trajectory spreadsheet.
- The initial y position on your trajectory spreadsheet comes from the "Y position at the end of air thrust" that you found in your thrust video analysis. Enter that position into cell E1.
- During coasting, the rocket has no water, so enter your rocket's dry mass into the mass cell -- B3.
- Enter the air density from the top of the data sheet.
- The cross-sectional area of a 2-liter bottle rocket is around 0.01m^2. Use your best estimate. Keep in mind that a wobbly rocket is going to periodically expose more of itself to oncoming air.
- For a drag coefficient of 0.3 is a good starting place.
Now make adjustments...
- Compare your trajectory spreadsheet's calculation of time to apogee with the time to apogee from your "Full Flight Time Data." If they're the same, great!
- If they're not the same, try to make them the same by changing the drag coefficient in your trajectory spreadsheet. This is the guess and check part. If you need to lengthen the time, think about the sort of change in drag that would cause the rocket to rise for longer.
- Keep guessing and checking until your spreadsheet time to apogee matches your actual time to apogee.
- When you're done, you will have an estimate of max height, as well as a bunch of data about forces acting on the rocket during this part of its flight.
- At this point, you could alter the spreadsheet to model the parachute descent, but that can be messy, so I recommend doing it the easy way, in the next step.
Modeling the Descent -- Finding the Rocket's Terminal Velocity [For Students]
This can be the murkiest step in the process. It requires a lot of nuance to really get it right. However, you can choose the "simple" approach, below. If you feel like you want your model to be more realistic, you can figure that out on your own.
The "simple" approach: To keep things simple, we will assume that your rocket reaches terminal velocity before landing. We will also assume that your rocket follows the coasting spreadsheet model during the first part of its descent, and that it rather suddenly shifts to falling at terminal velocity. [In reality, it takes a while for a parachute to deploy, but its okay to keep the model simple by pretending that deployment (and slowing to terminal velocity) is abrupt. In fact, some of your parachutes never deployed, and your rockets never reached terminal velocity, but as an intellectual exercise we will pretend that they did.]
- Gather/find the following information:
- The time when your rocket reached apogee
- Your rocket's height at apogee
- The time at which your rocket touched down
- Open your coasting model spreadsheet. Take a reasonable guess about where and when your parachute deployed. We're going to assume that your rocket shifted rapidly to terminal velocity at this point. Write down the time and the height. This will represent the height and time when it reached terminal velocity.
- With these assumptions, it is easy to calculate terminal velocity. We can use the formula distance = rate x time. The "rate" is terminal velocity. The "distance" is the distance that the rocket will fall (the current height). The "time" is the number of remaining seconds until the rocket lands. For example, if your chute deploys at a t = 4s and at height = 30m, and it lands at t=22s, then the terminal velocity is 30m/(22s-4s) = 1.67m/s. To make this a velocity, we should actually make it negative (-1.67m/s).
- Record your estimated terminal velocity, as well as the height and time at which your rocket reached terminal velocity, in the "descent" portion on page 1 of your "Water Rocket Data and Calculations Spreadsheet."
8 Snapshot Models of Significant Moments During Flight [For Students]
[*2025 Project Update: We didn't have time for a process that included a first submission, grading, and resubmission, so I made this video to walk students through all of the steps.]
Now it is time to create 8 "snapshots" of what is going on at significant moments during the rocket event. For each snapshot, you will create two products:
- An annotated sketch of the rocket at that moment, showing the individual forces and the net force acting on the rocket. In a nearby data table, you will provide the net force acting on the rocket, as well as its mass, acceleration, velocity, height, and elapsed time. Complete your work on the attached template.
- A spreadsheet summary of the precise data provided in your diagrams (sheet 2 of your "Water Rocket Data and Calculations" spreadsheet) . This is where I will be checking your calculations to make sure that they are internally consistent and that they make sense. Individual forces should add to the net force; net force should equal mass x acceleration; all numbers should match your launch data and calculations, and when they can't they should be reasonable...
I recommend working on these two products simultaneously, but the first step should be to work on the force diagram sketches. Once you sketch the forces, I would work on populating the spreadsheet summary (sheet 2 of "water rocket data and calculations"). Once you are happy with your calculations in the spreadsheet, you can transfer your data to the tables that go with each sketch. Feel free to round your numbers on the force diagram shees.
I will follow these grading guidelines:
- Up is positive and down is negative. All vectors must follow this convention.
- If you have the exact value for some bit of data somewhere in your other spreadsheets, I will expect the exact value.
- If you do not have the exact value somewhere in your spreadsheets, I will expect a reasonable value.
- For each "moment," the quantities must be internally consistent. For example, Fnet must equal ma, and Fnet must equal the sum of the individual forces.
Recommended data sources:
- For moments before the end of air thrust and after parachute deployment, first look at sheet one of your "Water rocket Data and Calculations" spreadsheet.
- For moments from the end of air thrust to apogee, use your "Y Dimension Projectile Trajectory With Drag" spreadsheet modeling your rocket's coast to its apogee. For this part of the flight, you should be able to find all of the necessary data here.
- For moments 6* and 8, you won't be able to find the answers anywhere in your work. You will simply have to make up reasonable numbers. Use your brain and come up with numbers that don't not make sense! :-) [*For some rockets, moments 6 and 7 look the same, so those should be able to find precise answers for moment #6.]
Graph Motion for the Entire Flight (Position, Velocity, Acceleration) [For Students]
Sketch and annotate graphs of height, velocity and acceleration (all vs. time) for the entire flight, beginning 1 second before launch and ending when the rocket comes to rest. These are challenging things to represent graphically, because the scale of what is happening changes so dramatically during the different stages of the event. Therefore, in order to make the graphs most meaningful for our purposes, we are going to throw some normal graphing rules out the window. The biggest rule we are going to break is that we are NOT going to create gridlines or any sort of labels on the axes. We will sketch changes in slope, and we will label important points (the snapshots from the previous step) with x and y data.
- Try to use most of the space on the page. Don't make a tiny graph that's all crammed into the center left part of the page. The time of your rocket's touch down should be at the far right end of the X axis. Your highest and lowest Y values should reach to near the top and bottom of the sheet.
- On each graph, create a dot for every snapshot captured by your force diagrams in the previous step.
- Label each dot with the snapshot number and x and y data. For example, on the "height vs time" graph, label your first dot with "#1," the height of your rocket when it on the launcher, in meters, and the time, which should be -1 seconds.
- Make sure that you include correct units with your data labels.
- Make sure that your slopes and signs are changing as they should be.
- You do not need to worry about the exact heights and troughs of your graphs peaks and troughs, but their highness or lowness relative to one another should be correct -- at least in the sense that, if they were ranked by highness or lowness, that rank order would be correct.
- Don't sweat the small stuff.
- I am not concerned about:
- precise slopes
- Exactly how high or low each peak or trough reaches
- Whether or not the time scale matches perfectly on all three graphs (if you overlay them). It would be nice if you tried to keep it pretty close, but this is not a requirement.
- I am concerned about:
- Your graph must use most of the space on the page. The time of your rocket's touchdown should be at the far right end of the graph. Your graph should come close to either the top or the bottom of the page (or both).
- Whether slopes are positive, negative, or zero at the right times.
- Whether signs are positive, negative, and zero at the right times.
- Relative heights of peaks and troughs. Ones with greater magnitude should be taller, but a peak with a 2x greater magnitude doesn't have to be exactly 2x taller.
Pressure Testing
Pressurized bottles full of air are bombs. Luckily, when they explode, the PET plastic isn't brittle; in my experience it doesn't create shrapnel. But that doesn't mean it won't send a bottle cap, a fin, or a nose cone weight into someone's eye.
If you are dubious about a rocket's integrity, fill it with water and pressurize it to a higher pressure than you plan to pressurize it during launch. The energy is stored in the compressed air. Since water is essentially incompressible, pressurizing a bottle full of water doesn't store as much energy. You should still wear safety glasses during pressure testing, but a bottle failure won't be dangerous. It will spill a lot of water, so plan for that. The most dangerous rockets are the ones that are almost good enough. They can handle 99psi, but not 100psi. The ones that are obviously compromised -- like when somebody tries to splice together two bottles using hot glue and duct tape -- are just going to immediately fail and start hissing as soon as you begin pumping.
Here's a page, with videos, from Air Command Rockets, explaining how to conduct burst tests.
Turn in Your Project
- In the "Rocket Project Turn-In Location" assignment in Google Classroom, one member of your group must turn in:
- A finished copy of your "Y Dimension Projectile Trajectory With Drag" spreadsheet, with numbers that model the coasting portion of your rocket's flight
- A copy of your "Water Rocket Data and Calculations" spreadsheet, with all of your correct calculations
- Your group must turn in paper copies of:
- Your annotated force diagrams of the 8 snapshots
- Your motion graphs of height, velocity, and acceleration vs. time