XYZ Point Scanner Using Salvaged Rotary Encoders
by mcgurkryan in Circuits > Electronics
3042 Views, 8 Favorites, 0 Comments
XYZ Point Scanner Using Salvaged Rotary Encoders

Having acquired quite a large number of discarded rotary optical encoders from my work place, I finally decided to do something fun/useful with them.
I've recently purchased a new 3D printer for my home and what could compliment it better than a 3D scanner! This project also provided me with the perfect opportunity to employ my 3D printer to manufacture the required parts.
Supplies
Optical encoders and corresponding optical sensors
Arduino UNO
optional prototyping shield
steel-bar rails
access to a 3D printer
The Optical Encoders


Almost any rotary encoder could be used for this project, as long as it provided you with a relatively high number of 'clicks' per mm. Obviously different encoders will require a suitable mounting solution.
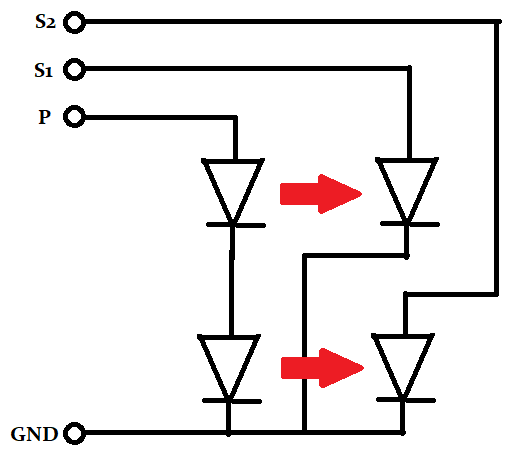
I used a continuity meter to trace out the wiring diagram for the photo-sensors.
3D Printed Parts
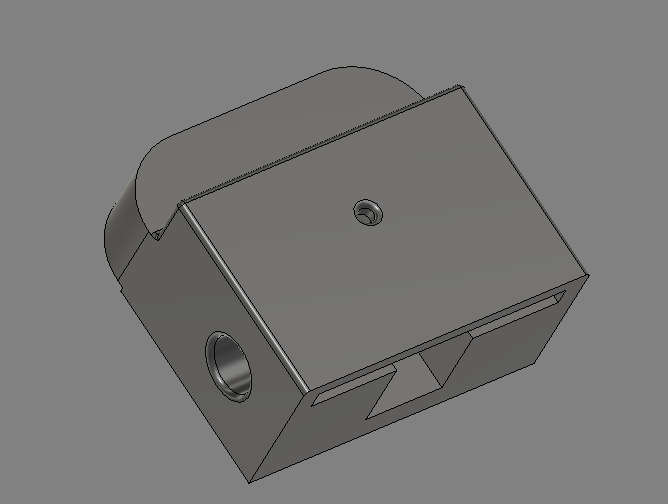
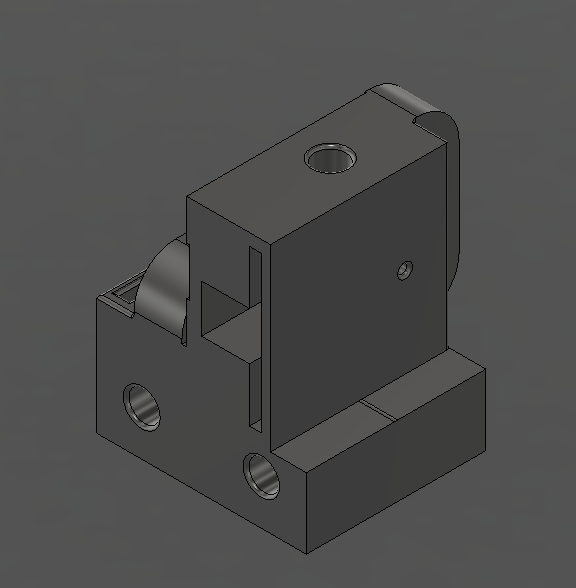
These parts house the rotary encoders and provide a slide for the rail. The single encoder housing has two holes in the back for the cross rails to mount to. The dual encoder housing is simply two single housings fused together at the right angles.
I designed these mounts on fusion360 to suit my choice of encoders and rails, the shaft of the encoder has a short piece of slingshot rubber sheath, to help it grip the stainless steel shaft better.
You want the shaft to slide freely and to fall thru the housing when held vertically, yet it must exert enough pressure on the encoder not to slip. What worked for me was to allow the slide for the shaft to overlap with the encoder shaft by 0.5mm. The slingshot rubber is soft enough to deform by that amount and provide good traction.
Wiring Diagram

The circuit is very simple. The opto-sensors require some current for the IR emitter diodes, a ground and pull-up resistors for the photo-diodes.
I decided on 5mA for the in-series emitter diodes, in this particular encoder the voltage drop across the diodes is 3.65V. I'm using a 5V supply from the Arduino, that leaves 1.35V for the resistor, at 5mA this works out to be 270 ohm.
10k ohm was selected for the pull-ups as the photo-diodes can only sink a small current, 10k ohm was also used for the push button. There's a button available for use on the prototype board already connected to ground, just provide it with a pull-up resistor and wire it to the desired input pin.
Arduino Code

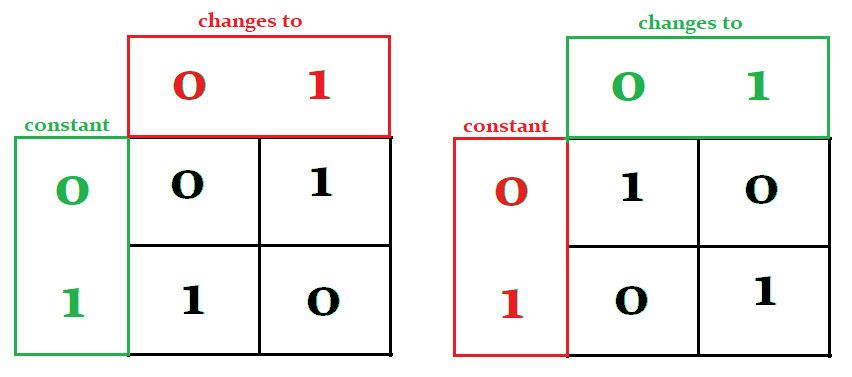
The code needs a little explanation as its operation may not be immediately obvious, yet it had to be optimized this way to be able to process 3 encoders quickly enough.
Firstly we only want to process direction data IF there has been a change in encoder position.
changes = new_value ^ stored value;
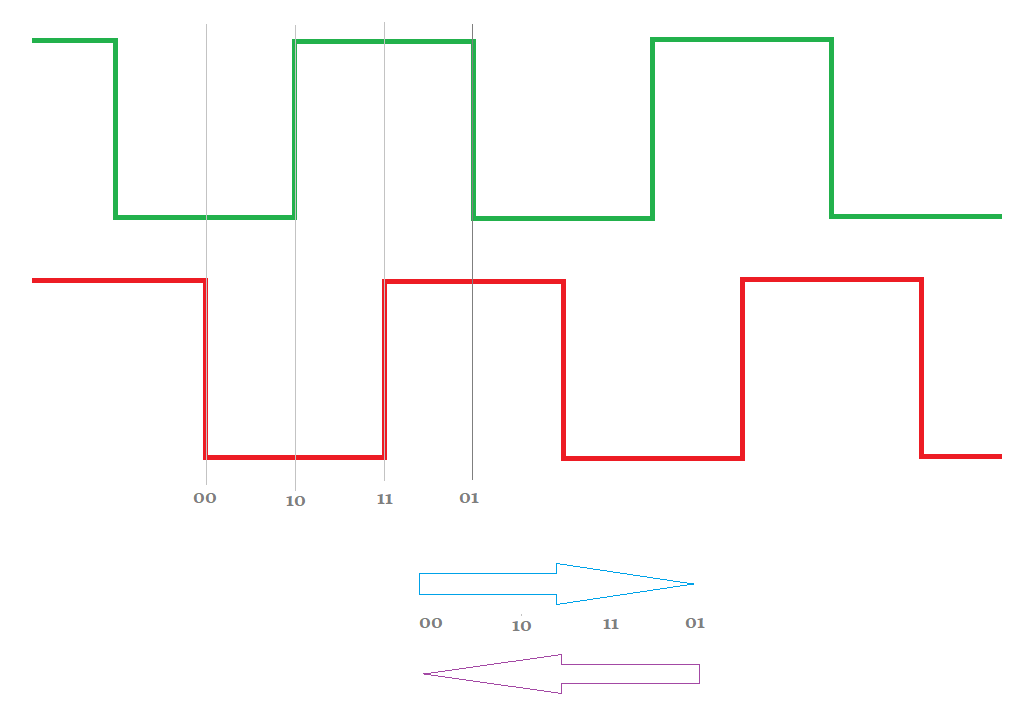
In order to get more resolution from my encoders I had to process both rising and falling edges.
On my setup my resolution is 24 clicks per 1cm.
This leaves us with a few scenarios.
S1 is constant 0 and S2 toggled from 0 to 1
S1 is constant 0 and S2 toggled from 1 to 0
S1 is constant 1 and S2 toggles from 0 to 1
S1 is constant 1 and S2 toggles from 1 to 0
S2 is constant 0 and S1 toggled from 0 to 1
S2 is constant 0 and S1 toggled from 1 to 0
S2 is constant 1 and S1 toggles from 0 to 1
S2 is constant 1 and S1 toggles from 1 to 0
These conditions are better understood in the truth-tables above, also each condition yields a 'direction', arbitrarily named 0 or 1.
The charts give us two vital clues:
1) one chart is the complete inverse of the other, so if we have one, we can easily compute the other by simply inverting the output. We invert the output only if one pin is changing and not the other, we can pick one arbitrarily.
2) the chart itself is simply the XOR of the S1 and S2 signals. (the other chart is the NOT of this).
Now understanding the code is simple.
// read in PORT in parallel
//remember adjacent pairs belong to the same encoder
state = PINB & 0x3f;
// what pins have changed if any
diff = hold ^ state;
// XOR adjacent S1 and S2 signals to get truth table
// eaiest way is to make a copy of the current state
// and shift it to the right by one bit
lookup = state >> 1;
// now bits are aligned for XOR
dir = lookup ^ state;
// remember, the table needs to be inverted if one
// of the inputs remained constant, we don't need an IF
// statement for this. Currently the desired direction bit
// is the right hand bit of every pair in the 'dir' variable
// the left hand bit is meaningless
// the 'diff' variable has the bit that changed 'set'
// so we either have '01' or '10'
// XOR this with the 'dir' byte will either
// invert or not the meaningful bit.
dir ^= diff;
// now update hold variable
hold = state;
// if either bit has changed for this encoder
if(diff & 0x03) {
 // determine direction
 if(dir & 0x01) {
 // based on your hadware and wiring either ++ or --
  --z;
 } else {
  ++z;
 }
}
// ditto for the rest
if(diff & 0x0c) {
 if(dir & 0x04) {
  ++y;
 } else {
  --y;
 }
}
if(diff & 0x30) {
 if(dir & 0x10) {
  --x;
 } else {
  ++x;
 }
}
When the button is pressed we send the current XYZ value to a terminal program.
The serial data is slow, but during normal operation the positions of the encoders will not be changing during this time anyway.
The data is sent as raw counts. You could do the maths and send the data in mm or inches etc. I find raw values are just as good because we can scale the object later in software.
First Scan
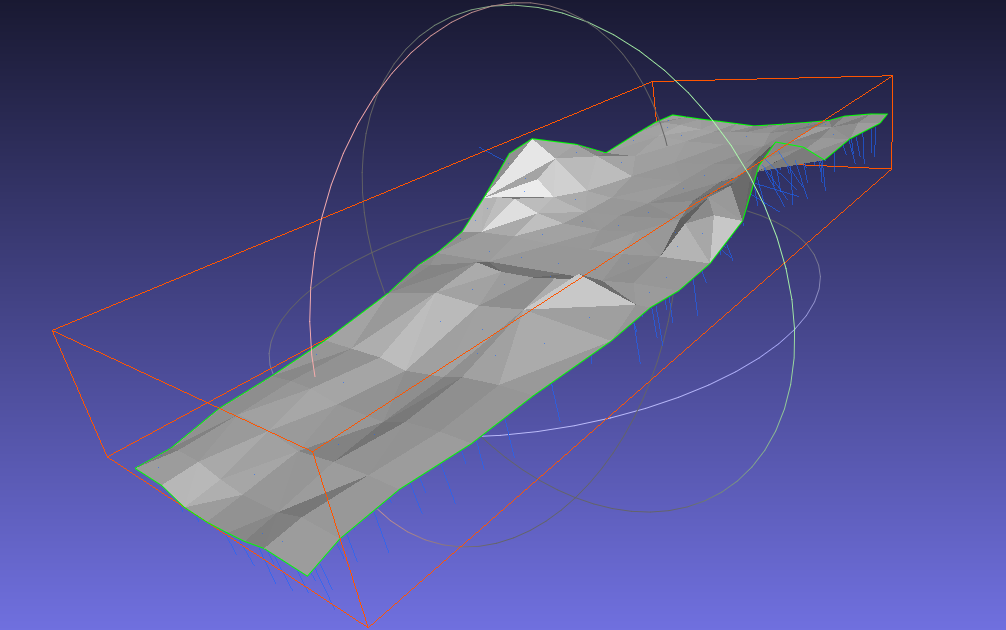

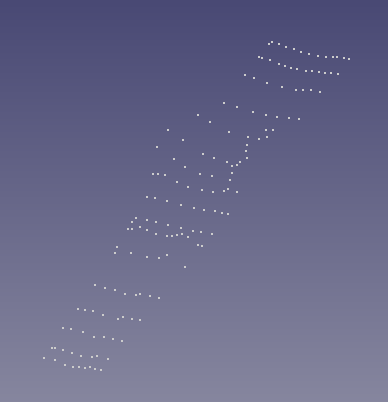

Gathering the points is a slow process, I floor the probe at the top left corner and reset the Arduino.
This zeros the position as home.
Then move the probe to the location on the target, hold it steady and press the 'snapshot' button.
For this rather large sample piece I took only ~140 points, so detail is not great on the final product.
Save the data into a .PCD file, and add the header
# .PCD v.7 - Point Cloud Data file format
VERSION .7
FIELDS x y z
SIZE 4 4 4
TYPE F F F
COUNT 1 1 1
WIDTH (your point count)
HEIGHT 1
VIEWPOINT 0 0 0 1 0 0 0
POINTS (your point count)
Put you point count in the header, this is easy on any editor that provides you with line numbers.
Above the dots can be seen in freeCad, they are then exported from freeCad as .PLY file.
Open the .PLY on MeshLab and surface the object. Done!!